-
iestinstrument
Cyclic Voltammetry(CV): The Diagnostic Report for Electrode Materials
1. What is Cyclic Voltammetry?
Cyclic Voltammetry (CV) is a fundamental electrochemical characterization technique, often termed the “diagnostic report” and “performance decoder” for electrode materials. Its principle involves applying a triangular waveform potential (e.g., cycling from -0.2 V → 1.0 V → -0.2 V) to a working electrode while recording the current response, generating a closed current-voltage curve (CV curve). This process simulates dynamic battery charge/discharge behavior, revealing critical information:
-
Redox Properties: Peak potentials correspond to reaction potentials of active materials; peak currents reflect reaction kinetics.
-
Reversibility: Smaller potential separation between oxidation/reduction peaks (ΔE<sub>p</sub>) indicates higher reversibility.
-
Mass Transport Mechanism: Scan-rate dependence distinguishes diffusion-controlled from surface-controlled reactions.
-
Stability: Post-cycling changes in peak current/area quantify material degradation.
In Li-ion battery research, Cyclic Voltammetry directly visualizes processes such as Li+ intercalation/deintercalation (e.g., graphite at 0.2 V vs. Li+/Li) or electrolyte decomposition (>4.5 V), functioning as an “electrochemical ECG.”
2. Experimental Data & Interpretation
Cell: 24 mAh coin cell (LiCoO2 cathode vs. graphite anode)
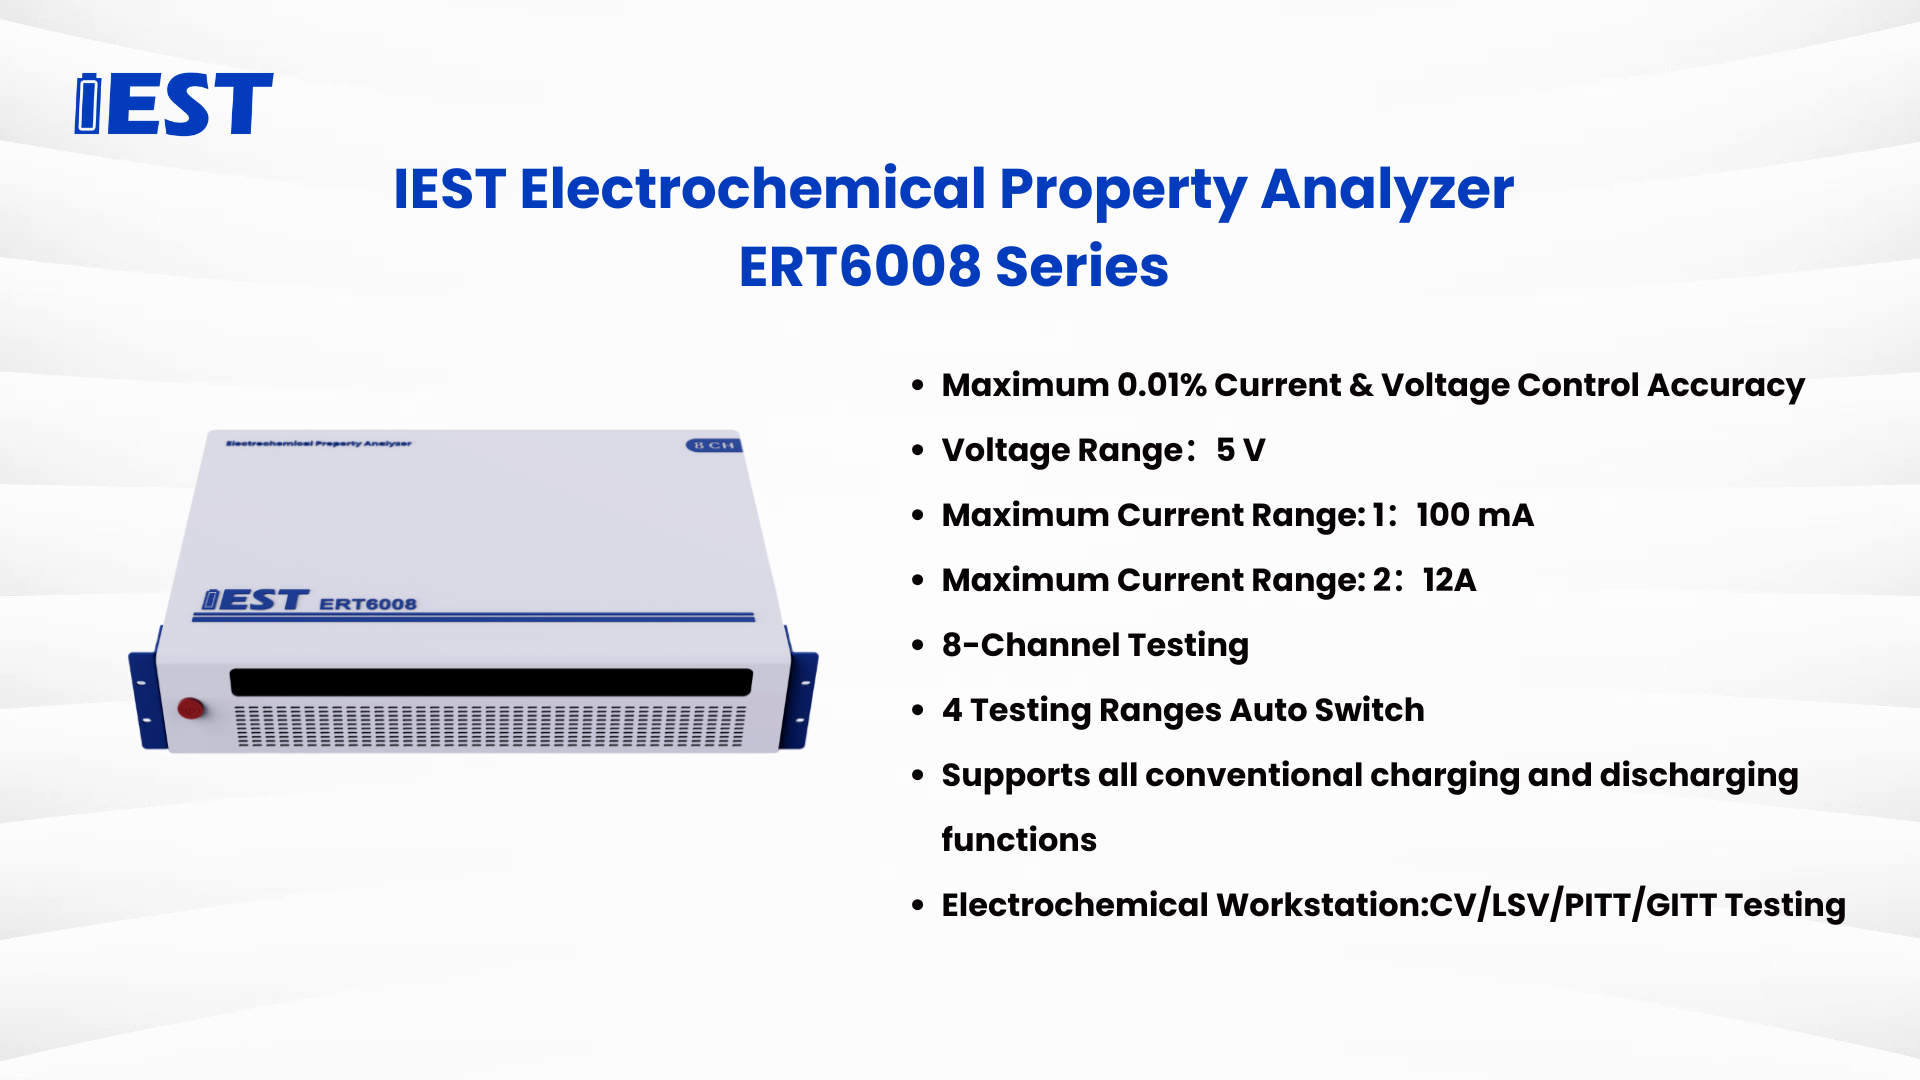
Equipment: IEST ERT6008-5V100mA High-Precision Electrochemical Analyzer (0.01% F.S. accuracy)
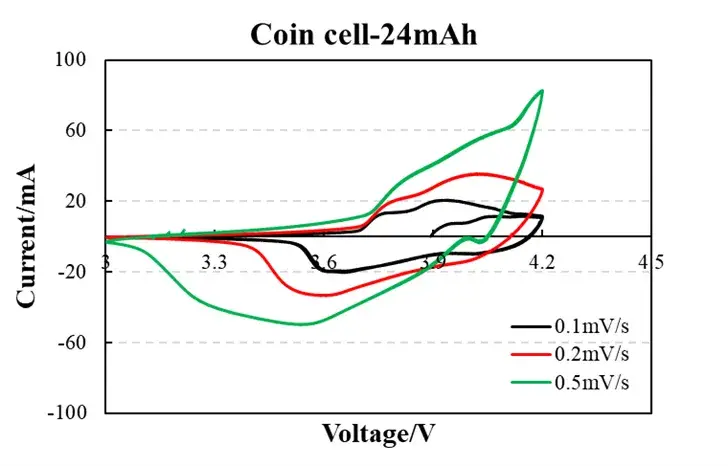
Conditions: Scan rates: 0.1/0.2/0.5 mV/s; Voltage range: 3.0–4.2 V vs. Li+/Li

Figure 1. Experimental Data
Low scan rate (0.1 mV/s, black curve):
-
Low peak current (~0.5 mA) and symmetric redox peaks indicate minimal polarization (diffusion-controlled process).
-
Peak separation ΔE<sub>p</sub> ≈ 60 mV (near theoretical 59 mV/n) confirms highly reversible Li<sup>+</sup> intercalation/deintercalation.
High scan rate (0.5 mV/s, green curve):
-
Peak current increases to ~1.2 mA, but ΔE<sub>p</sub> widens to 90 mV, signifying charge-transfer resistance and kinetic polarization.
-
Curve shape retention implies excellent structural stability (no parasitic reaction peaks).

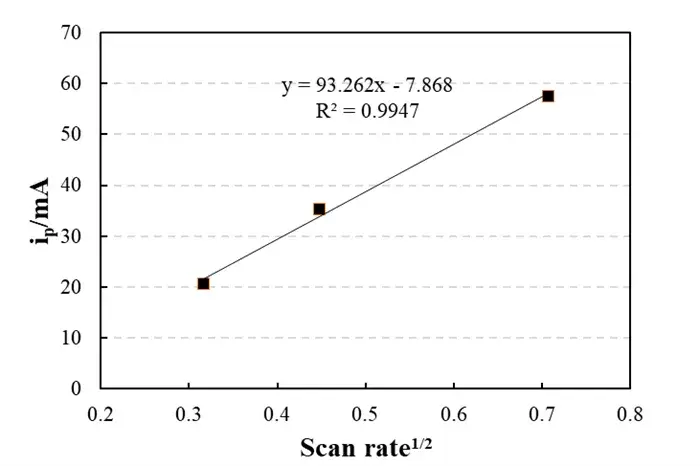
Figure 2. Linear Fitting Plot
Linear fitting: y = 93.262x – 7.868,R² = 0.9947
-
The peak current i_p is proportional to the square root of the scan rate, which is consistent with the classic Randles-Sevcik equation.
-
Slope (93.262) yields Li diffusion coefficient D≈10-10 cm2/s (typical graphite range).
-
Intercept (-7.868 mA) near zero indicates negligible non-Faradaic (double-layer charging) effects.

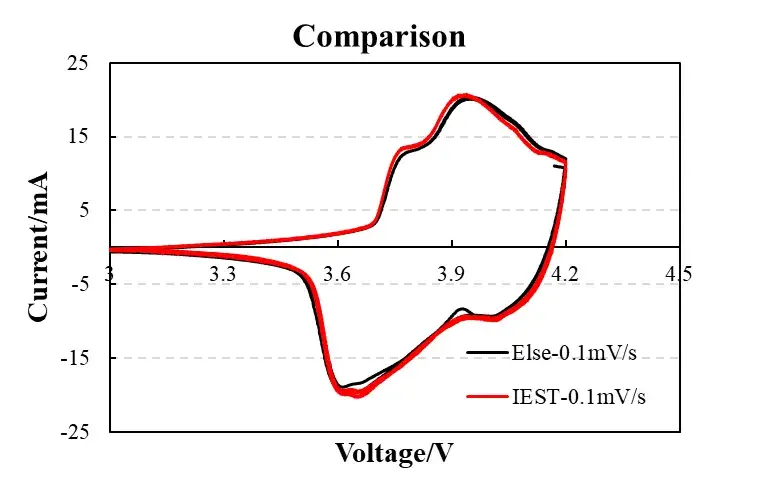
Figure 3. Device comparison (IEST vs. commercial workstation)
The CV curves of the IEST device and commercial electrochemical workstations (such as BioLogic) have a coincidence rate of >95%, especially in the high potential region (4.0-4.2V), where there are no abnormal fluctuations, proving that the data credibility meets scientific research requirements.
3. Key Equation & Conclusions
Experimental results align with the Randles–Ševčík equation:

Figure 3. Randles–Ševčík equation
Variables:
-
i_p: Peak current
-
F: Faraday constant
-
A: Electrode area
-
n: Electron transfer number
-
D: Diffusion coefficient
-
C0: Surface concentration
-
v: Scan rate
-
R, T: Gas constant & absolute temperature
In essence, this equation demonstrates that the peak current ipip is directly proportional to the square root of the scan rate vv. Consequently, while the shape of the CV curve varies with scan rate, its fundamental profile remains consistent.
4. Summary
Cyclic Voltammetry serves as a comprehensive diagnostic tool and performance profiler for electrode materials. This experiment fully demonstrates its robust analytical capabilities while highlighting the exceptional performance of IEST instrumentation. Our equipment maintains data accuracy consistent with internationally renowned brands (e.g., BioLogic), with comparative deviations rigorously controlled within 1.5%, coupled with significant cost advantages.
More notably, we will launch a revolutionary intelligent electrochemical data analysis system in Q2 2025, enabling advanced CV curve processing:
-
Batch Cyclic Voltammetry(CV) curve visualization
-
Feature point identification and smoothing algorithms
-
Automated peak recognition/fitting for extracting peak position, height, and area parameters
-
Cyclic Voltammetry(CV) curve smoothing functionality
Innovatively, we have integrated cloud-based data synchronization, enabling real-time interfacing between central and cloud databases.
With its precision, intelligence, and reliability, IEST electrochemical analyzers are becoming the primary electrochemical diagnostic platform in growing numbers of laboratories. We cordially invite you to experience this professional solution delivering comprehensive testing capabilities from R&D through mass production.
Contact Us
If you are interested in our products and want to know more details, please leave a message here, we will reply you as soon as we can.


