1. Manual Assembly VS Auto Assembly
| Assembly Comparison | Manual Assembly | Automatic Assembly | |||||
|---|---|---|---|---|---|---|---|
| Item | Charge capacity (mAh/g) |
Discharge capacity (mAh/g) |
Efficiency (%) |
Charge capacity (mAh/g) |
Discharge capacity (mAh/g) |
Efficiency (%) |
|
| NCM-1 | Range value | 1.1 | 1.3 | 0.22% | 0.7 | 0.7 | 0.26% |
| Average | 225.525 | 211.142 | 93.62% | 225.325 | 211.05 | 93.66% | |
| σ | 0.384 | 0.396 | 0.001 | 0.226 | 0.198 | 0.001 | |
| COV | 0.17% | 0.19% | 0.07% | 0.10% | 0.09% | 0.08% | |
| NCM-2 | Range value | 1.8 | 2 | 0.23% | 0.6 | 0.9 | 0.23% |
| Average | 225.467 | 211.7833 | 93.93% | 225.292 | 211.6083 | 93.93% | |
| σ | 0.44 | 0.465 | 0.001 | 0.178 | 0.231 | 0.001 | |
| COV | 0.20% | 0.22% | 0.07% | 0.08% | 0.11% | 0.07% | |
| Assembly Comparison | Manual Assembly | Automatic Assembly | |||||
|---|---|---|---|---|---|---|---|
| Item | Charge capacity (mAh/g) |
Discharge capacity (mAh/g) |
Efficiency (%) |
Charge capacity (mAh/g) |
Discharge capacity (mAh/g) |
Efficiency (%) |
|
| Silicon base-1 |
Range value | 20.6 | 12.6 | 0.55% | 17 | 16.8 | 0.25% |
| Average | 1908.4 | 2046.9083 | 93.24% | 1907.592 | 2044.9083 | 93.28% | |
| σ | 6.948 | 4.391 | 0.002 | 4.553 | 4.678 | 0.001 | |
| COV | 0.36% | 0.21% | 0.18% | 0.24% | 0.23% | 0.07% | |
| Silicon base-2 |
Range value | 39.7 | 22.4 | 1.46% | 19.9 | 22.2 | 0.38% |
| Average | 1897.85 | 2039.7833 | 93.02% | 1903.992 | 2041.5667 | 93.26% | |
| σ | 11.669 | 6.954 | 0.005 | 5.211 | 6.322 | 0.001 | |
| COV | 0.61% | 0.34% | 0.49% | 0.27% | 0.31% | 0.11% | |


For NCM materials:
- The range of charge/discharge specific capacity for NCM with automatic assembly is 0.6~0.9 mAh/g (σ ≈ 0.25), while with manual assembly it is 1~2 mAh/g (σ ≈ 0.4).
For Silicon-based anode materials:
- The range of charge/discharge specific capacity for Si-based materials with automatic assembly is 15~20 mAh/g (σ ≈ 4~6), while with manual assembly it is 20~40 mAh/g (σ ≈ 5~10).
Conclusion: While the average specific capacity values obtained from automated and manual assembly methods were comparable for both material types, automated assembly demonstrated superior stability compared to manual assembly.
2. Automatic Coin Cell Assembly of LFP Cathodes
| LFP Cathode | ||||||||
|---|---|---|---|---|---|---|---|---|
| Category | Item | Group 1 | Group 2 | Group 3 | Group 4 | Group 5 | Group 6 | Group 7 |
| Range | Charge capacity (mAh/g) | 1.5 | 1.1 | 1.2 | 1.1 | 1.1 | 1.0 | 0.6 |
| Discharge capacity (mAh/g) | 1.3 | 1.2 | 1.0 | 1.0 | 1.3 | 0.9 | 0.6 | |
| Initial efficiency (%) | 0.8 | 0.4 | 0.3 | 0.3 | 1.3 | 0.4 | 0.5 | |
| Average | Charge capacity (mAh/g) | 161.0 | 160.7 | 160.7 | 160.8 | 161.3 | 161.1 | 161.1 |
| Discharge capacity (mAh/g) | 156.9 | 156.7 | 156.6 | 156.7 | 157.0 | 156.9 | 156.9 | |
| Initial efficiency (%) | 97.4 | 97.5 | 97.5 | 97.5 | 97.4 | 97.4 | 97.4 | |
| σ | Charge capacity (mAh/g) | 0.37 | 0.32 | 0.33 | 0.38 | 0.32 | 0.24 | 0.20 |
| Discharge capacity (mAh/g) | 0.31 | 0.36 | 0.29 | 0.30 | 0.30 | 0.25 | 0.16 | |
| Initial efficiency (%) | 0.18 | 0.12 | 0.09 | 0.09 | 0.30 | 0.11 | 0.12 | |
| COV | Charge capacity (mAh/g) | 0.23% | 0.20% | 0.21% | 0.24% | 0.20% | 0.15% | 0.12% |
| Discharge capacity (mAh/g) | 0.20% | 0.23% | 0.18% | 0.19% | 0.19% | 0.16% | 0.10% | |
| Initial efficiency (%) | 0.18% | 0.12% | 0.09% | 0.10% | 0.31% | 0.11% | 0.12% | |

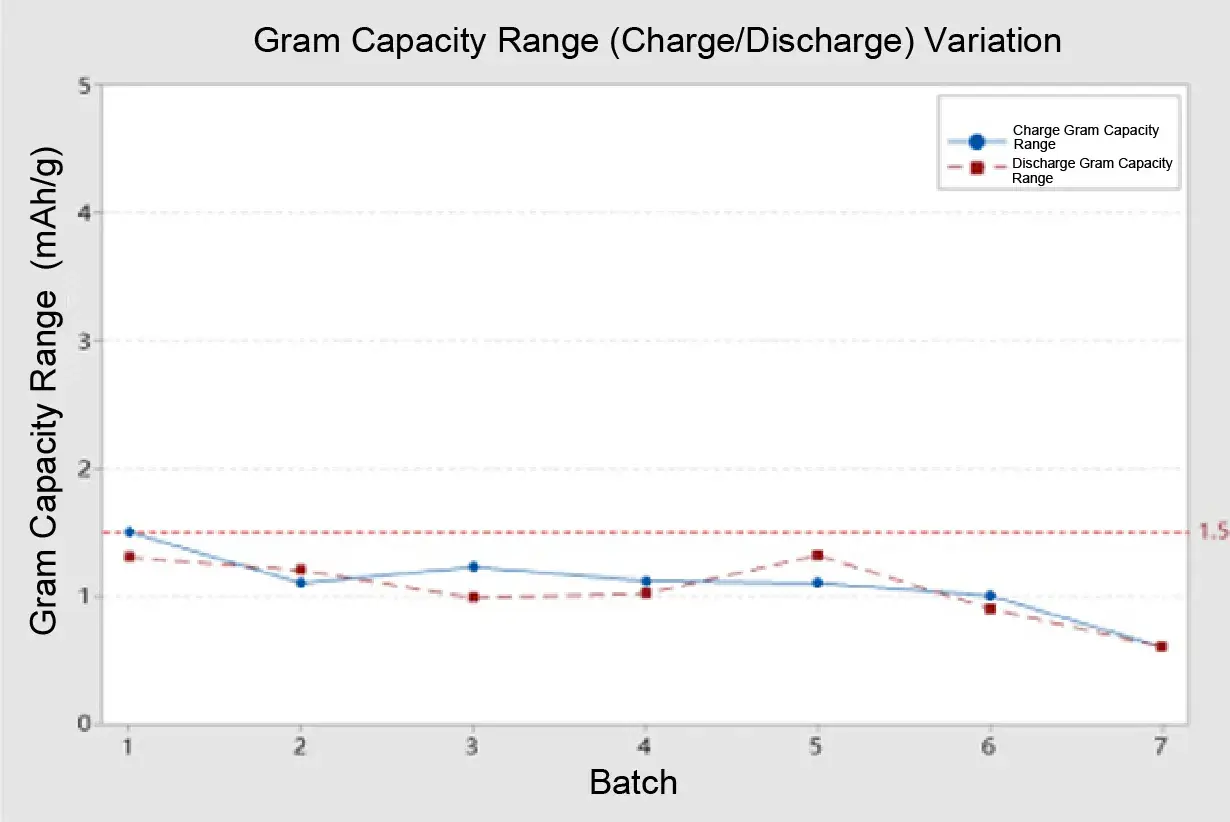


Conclusion:
- The standard deviation (σ) for the charge/discharge specific capacity of each group is less than 0.4.
- The range for the charge/discharge specific capacity of each group is less than 1.5 mAh/g.
- The coefficient of variation (COV) for the charge/discharge specific capacity of each group is less than 0.3%.
3. Automatic Coin Cell Assembly of NCM Cathodes
| NCM-1 Cathode | ||||||||
|---|---|---|---|---|---|---|---|---|
| Category | Item | Group 1 | Group 2 | Group 3 | Group 4 | Group 5 | Group 6 | Group 7 |
| Range | Charge capacity (mAh/g) | 0.9 | 1.2 | 1.5 | 1.1 | 1.3 | 1.4 | 1.1 |
| Discharge capacity (mAh/g) | 1.2 | 1.1 | 1.2 | 1.2 | 1.4 | 1.1 | 1.3 | |
| Initial efficiency (%) | 0.5 | 0.3 | 0.7 | 0.8 | 0.5 | 0.4 | 0.4 | |
| Average | Charge capacity (mAh/g) | 225.5 | 224.8 | 224.9 | 224.6 | 224.6 | 225.3 | 224.7 |
| Discharge capacity (mAh/g) | 211.1 | 210.3 | 210.6 | 210.4 | 209.9 | 211.7 | 210.9 | |
| Initial efficiency (%) | 93.6 | 93.5 | 93.6 | 93.6 | 93.5 | 94.0 | 93.9 | |
| σ | Charge capacity (mAh/g) | 0.27 | 0.33 | 0.37 | 0.34 | 0.39 | 0.32 | 0.33 |
| Discharge capacity (mAh/g) | 0.39 | 0.29 | 0.38 | 0.32 | 0.38 | 0.29 | 0.30 | |
| Initial efficiency (%) | 0.14 | 0.08 | 0.23 | 0.17 | 0.17 | 0.12 | 0.09 | |
| COV | Charge capacity (mAh/g) | 0.12% | 0.15% | 0.16% | 0.15% | 0.18% | 0.14% | 0.15% |
| Discharge capacity (mAh/g) | 0.18% | 0.14% | 0.18% | 0.15% | 0.18% | 0.14% | 0.14% | |
| Initial efficiency (%) | 0.15% | 0.09% | 0.25% | 0.18% | 0.18% | 0.12% | 0.10% | |


Conclusion:
- The standard deviation (σ) for the charge/discharge specific capacity of each group is less than 0.4.
- The range for the charge/discharge specific capacity of each group is less than 1.5 mAh/g.
- The coefficient of variation (COV) for the charge/discharge specific capacity of each group is less than 0.3%.
4. Automatic Coin Cell Assembly of Graphite Anodes
| Graphite Anode | ||||||||
|---|---|---|---|---|---|---|---|---|
| Category | Item | Group 1 | Group 2 | Group 3 | Group 4 | Group 5 | Group 6 | Group 7 |
| Range | Charge capacity (mAh/g) | 1.1 | 1.2 | 1.1 | 1.2 | 1.3 | 1.2 | 1.5 |
| Discharge capacity (mAh/g) | 1.8 | 1.8 | 1.8 | 1.9 | 2.1 | 2.1 | 2.1 | |
| Initial efficiency (%) | 0.4 | 0.5 | 0.5 | 0.4 | 0.5 | 0.7 | 0.6 | |
| Average | Charge capacity (mAh/g) | 347.9 | 347.8 | 347.7 | 347.3 | 345.4 | 346.2 | 346.1 |
| Discharge capacity (mAh/g) | 367.8 | 368.4 | 368.2 | 368.2 | 367.7 | 368.2 | 368.8 | |
| Initial efficiency (%) | 94.6 | 94.4 | 94.4 | 94.3 | 93.9 | 94.0 | 93.8 | |
| σ | Charge capacity (mAh/g) | 0.28 | 0.38 | 0.31 | 0.34 | 0.45 | 0.35 | 0.44 |
| Discharge capacity (mAh/g) | 0.57 | 0.62 | 0.60 | 0.53 | 0.51 | 0.65 | 0.69 | |
| Initial efficiency (%) | 0.13 | 0.15 | 0.14 | 0.13 | 0.13 | 0.17 | 0.15 | |
| COV | Charge capacity (mAh/g) | 0.08% | 0.11% | 0.09% | 0.10% | 0.13% | 0.10% | 0.13% |
| Discharge capacity (mAh/g) | 0.16% | 0.17% | 0.16% | 0.14% | 0.14% | 0.18% | 0.19% | |
| Initial efficiency (%) | 0.14% | 0.16% | 0.15% | 0.13% | 0.14% | 0.18% | 0.16% | |

Conclusion:
- The standard deviation (σ) for the discharge specific capacity in each group is less than 0.8, and for the chargespecific capacity, it is less than 0.5.
- The range for the discharge specific capacity in each group is less than 2.1 mAh/g, and for the charge specificcapacity, it is less than 1.5mAh/g.
- The coefficient of variation (COV) for both charge and discharge specific capacity in each group is less than 0.2%.
5. Automatic Coin Cell Assembly of Silicon-Based Anode
| Silicon based Anode | ||||||||
|---|---|---|---|---|---|---|---|---|
| Category | Item | Group 1 | Group 2 | Group 3 | Group 4 | Group 5 | Group 6 | Group 7 |
| Range | Charge capacity (mAh/g) | 14.0 | 19.2 | 16.2 | 13.8 | 20.1 | 16.8 | 14.2 |
| Discharge capacity (mAh/g) | 21.7 | 15.8 | 18.2 | 11.0 | 12.5 | 21.1 | 16.5 | |
| Initial efficiency (%) | 0.5 | 0.4 | 0.5 | 0.5 | 0.6 | 0.4 | 0.2 | |
| Average | Charge capacity (mAh/g) | 1649.3 | 1661.4 | 1647.6 | 1656.3 | 1641.4 | 1658.4 | 1659.9 |
| Discharge capacity (mAh/g) | 1823.6 | 1837.1 | 1821.4 | 1831.9 | 1823.4 | 1834.8 | 1836.3 | |
| Initial efficiency (%) | 90.4 | 90.4 | 90.5 | 90.4 | 90.0 | 90.4 | 90.4 | |
| σ | Charge capacity (mAh/g) | 4.39 | 5.12 | 3.88 | 4.45 | 5.16 | 4.95 | 4.40 |
| Discharge capacity (mAh/g) | 5.71 | 5.16 | 5.01 | 3.42 | 3.42 | 5.83 | 5.19 | |
| Initial efficiency (%) | 0.13 | 0.12 | 0.12 | 0.17 | 0.14 | 0.11 | 0.07 | |
| COV | Charge capacity (mAh/g) | 0.27% | 0.31% | 0.24% | 0.27% | 0.31% | 0.30% | 0.27% |
| Discharge capacity (mAh/g) | 0.31% | 0.28% | 0.28% | 0.19% | 0.19% | 0.32% | 0.28% | |
| Initial efficiency (%) | 0.15% | 0.14% | 0.13% | 0.19% | 0.16% | 0.12% | 0.07% | |


Conclusion:
- The standard deviation (σ) for the charge/discharge specific capacity of each group is less than 6.
- The range for the charge/discharge specific capacity of each group is less than 20 mAh/g.
- The coefficient of variation (COV) for the charge/discharge specific capacity of each group is less than 0.4%.
6. Curling Issue of Single-Sided Electrodes after Calendering and Punching

Conclusion:
- Our specially designed suction cup can ensure that the curled electrodes are sucked evenly and flatly.
- Our visual positioning system can avoid the placement position deviation caused by the curling of the electrodes.
- The cathode electrode shell is pressed down horizontally to flatten the curled electrode that contacts the electrolyte.
