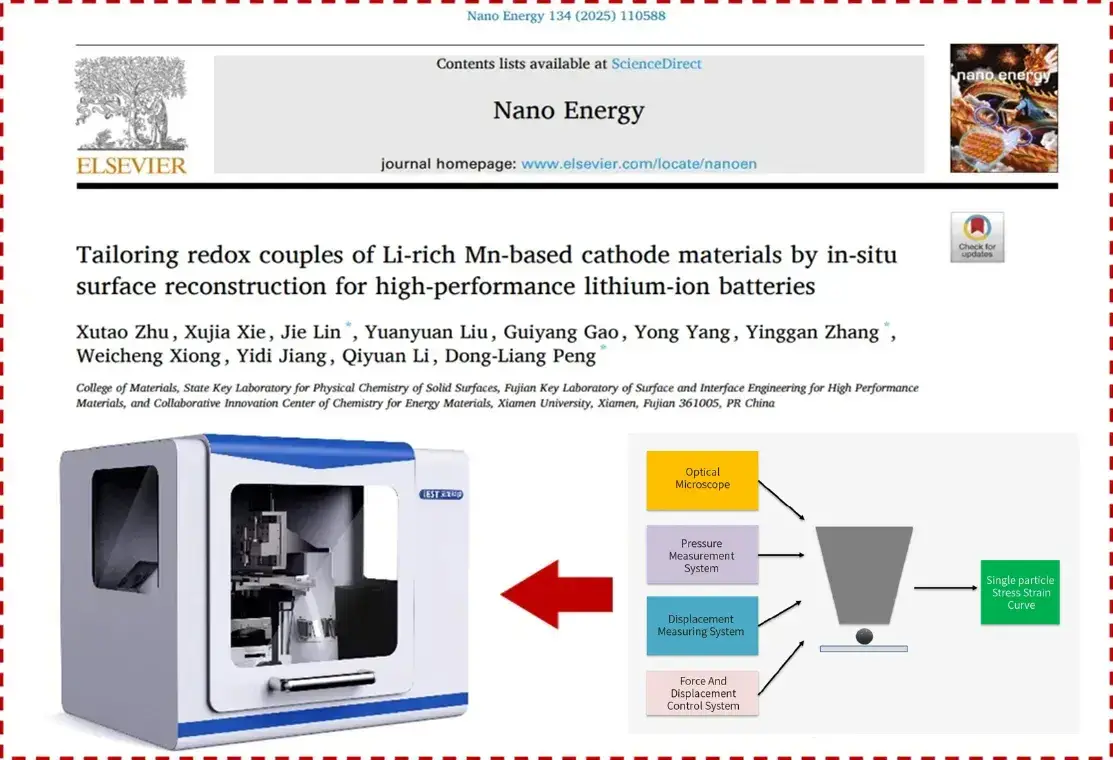
-
iestinstrument
Tailoring Redox Couples of Li-rich Mn-based Cathode Materials by In-Situ Surface Reconstruction for High-Performance Lithium-Ion Batteries
Journal: Nano Energy
Affiliation: School of Materials, Xiamen University
Authors: Xutao Zhu, Xujia Xie, Jie Lin*, Yuanyuan Liu, Guiyang Gao, Yong Yang, Yinggan Zhang*, Weicheng Xiong, Yidi Jiang, Qiyuan Li, Dongliang Peng*.
Correspondence author: LIN Jie, ZHANG Ying-Gan, PENG Dong-Liang.
Instruments used: IEST SPFT-2000 Single Particle Mechanical Properties Test System
1. Research Background
Li-rich Mn-based layered oxides(LLOs) have high capacity characteristics due to their unique cation and anion co-redox, and are a promising next-generation high-energy lithium-ion battery cathode material. However, the participation of lattice oxygen in the reaction at high voltage leads to the generation of unstable electron holes and active free radicals O2-. Subsequently, O-O (<1.5Å) dimers aggregate to form oxygen, which escapes irreversibly from the surface of LLOs. Further lithium ion extraction and lattice oxygen loss lead to the concentration of cation vacancies, which accelerates the structural degradation of LLOs and the rapid decay of capacity and voltage. At the same time, the unstable interface between the electrode and the electrolyte triggers various side reactions, and the accumulation of lattice stress and particle structure collapse also hinder their practical application. Although scientists have proposed the “covalency theory” to understand the redox activity mechanism of LLOs, the academic community still lacks a unified understanding of the design guidelines for redox couples of Li-rich Mn-based cathode materials.
2. Work Introduction
Recently, inspired by high-voltage polyanion cathode materials, the team of Professor Peng Dongliang and Assistant Professor Lin Jie from Xiamen University developed high-performance LLOs through the “in-situ surface reconstruction” strategy of near-surface doping combined with surface coating. Density functional theory (DFT) calculations show that by introducing Ni2+ and PO43- into the LLOs lattice, the energy bands of transition metal (TM) 3d-O 2p and non-bonded O-2p move toward the low-energy direction, which increases its working voltage, reduces the activity of lattice oxygen under high pressure, and enhances the redox reversibility of oxygen. At the same time, the in-situ generated amorphous Li3PO4 coating can prevent electrolyte erosion and reduce the structural degradation of LLOs during the cycle process. The results show that the capacity retention rate of the modified LLOs increased from 35.9% to 77%, and the voltage retention rate increased from 68.6% to 75.1% after 700 cycles at 1C. In addition, at 55°C, the capacity retention of the modified LLOs also increased from 32.1% to 85.9%, and after 120 cycles at 1C, the voltage retention increased from 67.9% to 82.3%. The proposed design strategy can promote the development and application of high-performance LLOs and high-energy-density lithium-ion batteries. The research results were published in the international academic journal Nano Energy under the title “Tailoring Redox Couples of Li-Rich Mn-Based Cathode Materials by In-Situ Surface Reconstruction for High-Performance Lithium-Ion Batteries“.
3. Graphic Introduction
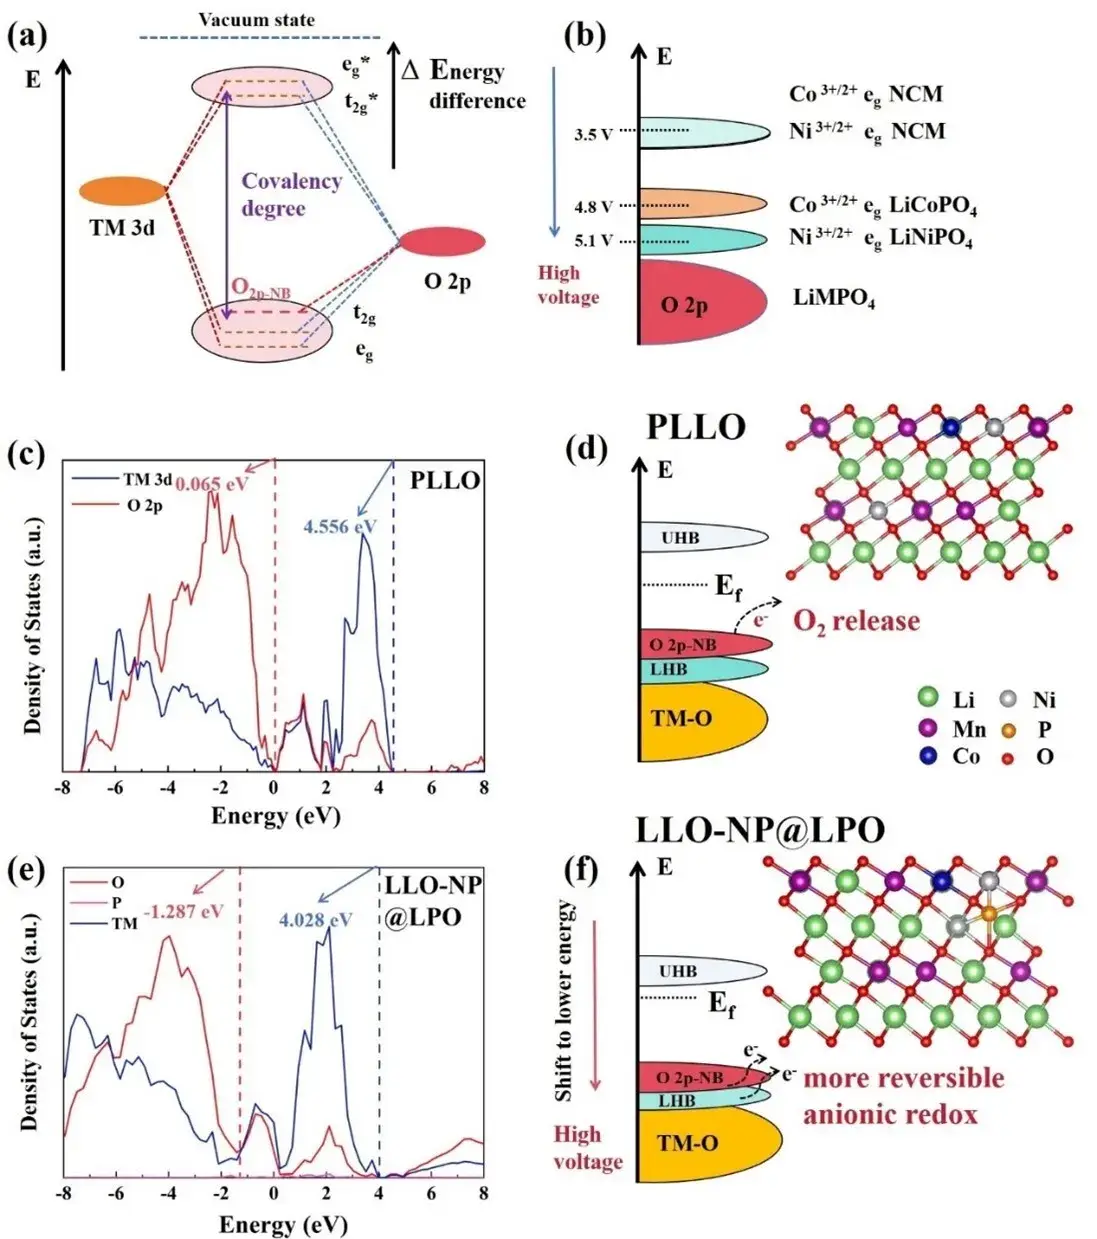
Figure 1. (a) Schematic diagram of molecular orbital energy levels for transition metal 3d orbitals and oxygen 2p orbitals. (b) Energy level diagrams of Ni3+/2+/Co3+/2+ redox pairs in olivine LiMPO4 anode and ternary NCM anode. (c, e) State density maps of O 2p states and TM 3d orbitals in PLLO and LLO-NP@LPO obtained by DFT calculations. (d, f) Electronic structure maps based on the state density maps and schematic diagrams of the two crystal structures used for the calculations.
Changes in the local environment affect the electronic energy levels and redox potentials of materials, which play a crucial role in the electrochemical properties of LLOs. In molecular orbital theory, the energy difference between the vacuum energy level and the highest occupied molecular orbital (HOMO) usually reflects the potential of the redox pair. When a higher electronegative atom (X) is introduced to form an M-O-X bond, the covalency between the transition metal and oxygen is affected, resulting in a larger energy difference (Δ) and a higher oxygen reduction potential (Fig. 1a). For example, in olivine-type LiNiPO4 polyanionic cathode materials, the strong P-O hybridization not only causes the transition metal redox pair to display a higher oxygen reduction voltage (5.1 V vs. Li/Li+) than that of the laminated cathode (Fig. 1b), but also improves its electrochemical stability at high voltages and elevated temperatures by lowering the electronic energy levels of the O 2p orbitals. The energy levels and density of states (DOS) maps of PLLO and LLO-NP@LPO are compared as shown in Figs. 1c-f. DFT calculations show that the introduction of Ni2+ and PO43- is able to move the energy bands of the lattice of the LLOs to lower energy positions, and the energy level of the TM 3d-O 2p of the LLO-NP@LPO is shifted from 4.556 to 4.028 eV, while the energy level of the O 2p non-bonding orbital’s energy level moves from 0.065 eV to -1.287 eV, resulting in an increase in its operating voltage and stabilization of the reactivity of the non-bonding oxygen. In addition, the displacement value of the O 2p non-bonding orbital of LLO-NP@LPO, 1.352 eV, is larger than that of the TM 3d-O 2p energy level, 0.528 eV, indicating that the overlap of the O 2p non-bonding orbitals and transition metal orbitals is more, which enhances the reversibility of the oxygen reduction reaction of oxygen. In addition, the intensity of the nonbonding O 2p orbitals in LLO-NP@LPO is weakened (Fig. 1c and e), suggesting that the electronic structure of lattice oxygen is stabilized, which is also confirmed by the differential charge density map.
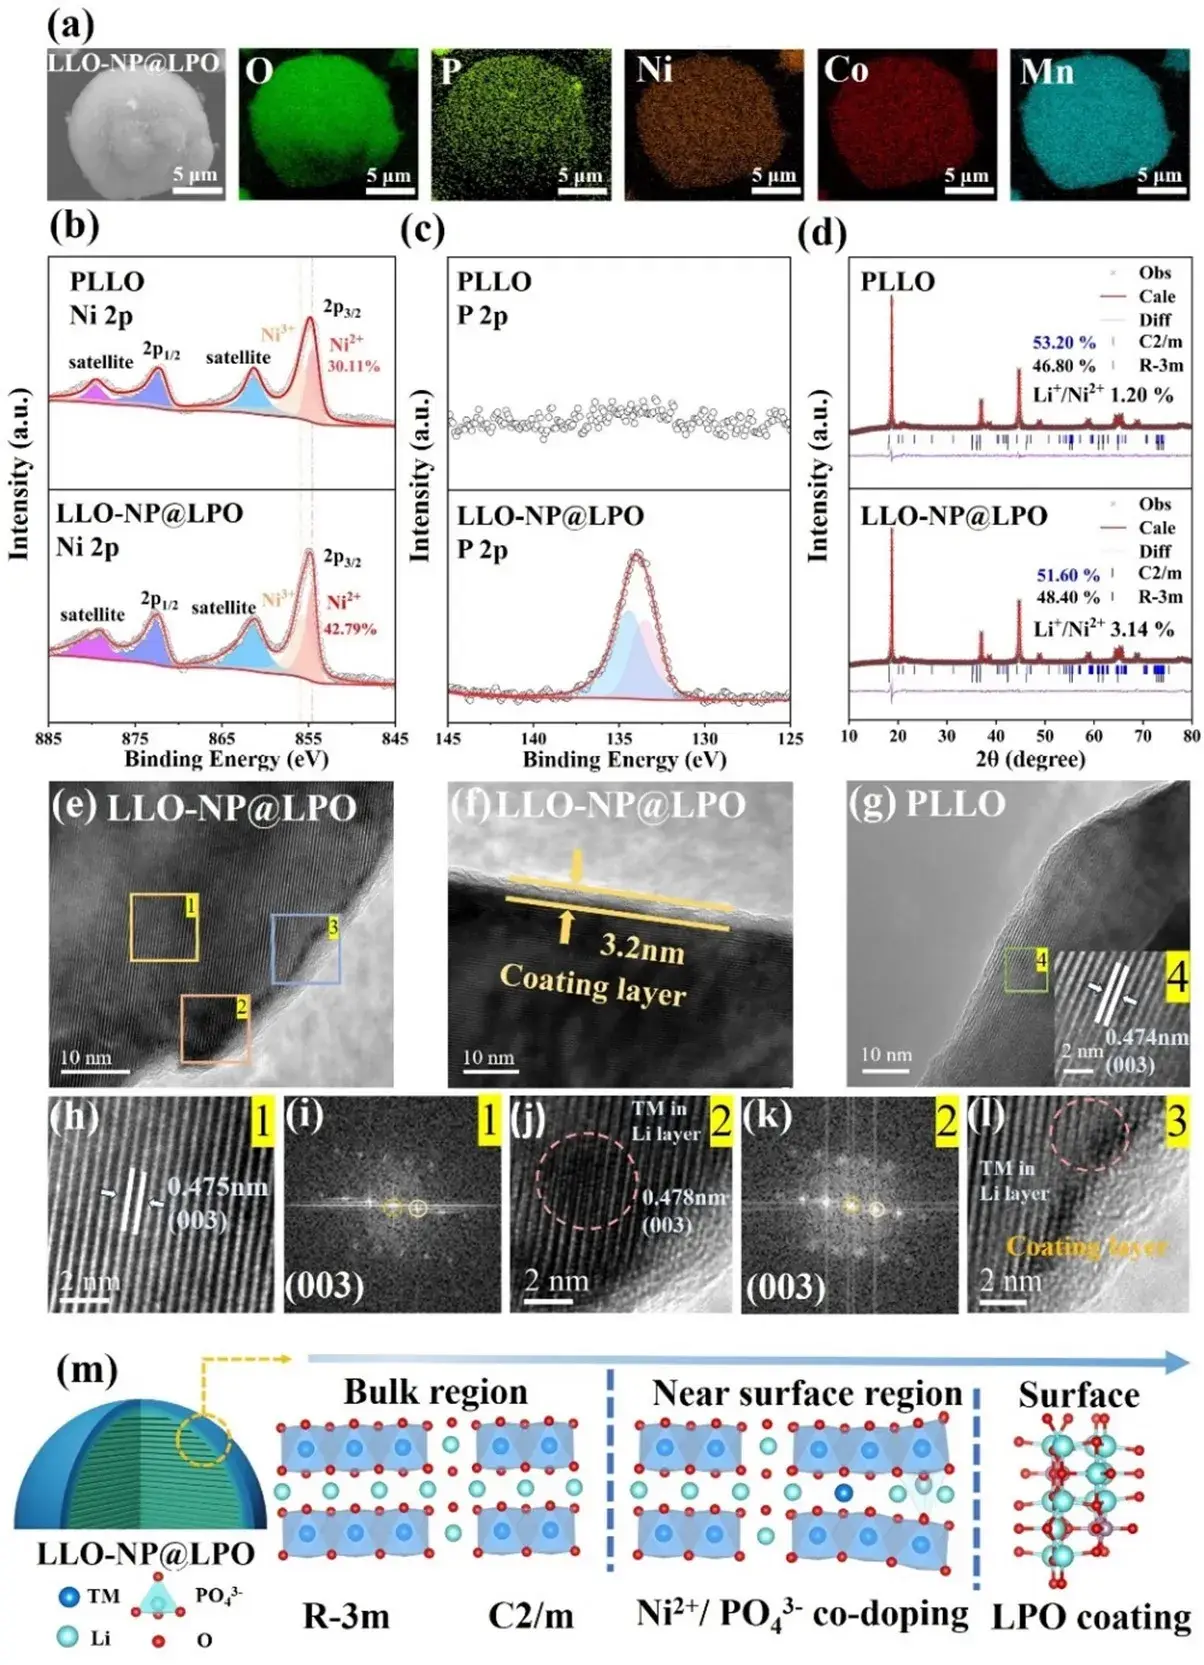
Figure 2. (a) SEM and EDS maps of LLO-NP@LPO. (b, c) XPS maps of Ni 2p and P 2p. (d) XRD Rietveld refinement results of PLLO and LLO-NP@LPO. (e, f) HR-TEM images of LLO-NP@LPO and (g) HR-TEM images of PLLO. (h, j) Enlarged HR-TEM images of regions 1-2 in Fig. (e) and the corresponding Fourier transform (FFT) images in Figs. (i, k). (l) Magnified HR-TEM image of region 3 in Fig. (e). (m) Schematic representation of the near-surface crystal structure of LLO-NP@LPO after in situ surface reconstruction.
Based on the above theoretical calculations, it is proposed to design and develop corresponding high-performance LLOs through the in situ surface reconstruction strategy of near-surface doping combined with surface cladding layer.The two samples have similar spherical morphology, and the EDS surface scanning maps show a uniform distribution of Ni, Co, Mn, and O elements present in the LLOs, as well as the P and O elements of the Li3PO4 cladding layer in the modified samples (Fig. 2a), and XPS analysis also detected Mn, Ni, Co, Li, O, and P. As shown in Fig. 2b, the percentage of Ni2+ on the surface of the LLO-NP@LPO sample was 42.79%, which was higher than that of the PLLO sample (30.11%), and after etching for 200 s, the Ni2+ content decreased to 32.65 %, which was very close to that of the PLLO sample at the same depth (31.35%). close to that of the PLLO sample at the same depth (31.35%). This suggests that the increased surface Ni content in the modified samples is due to near-surface Ni doping.The P 2p peaks associated with P-O bonding at 133.5 and 134.4 eV by XPS (Fig. 2c) belong to the phosphate group, indicating the successful construction of the Li3PO4 capping layer, which is also confirmed by the ICP-OES test results. The XPS peak of PO43- was still detectable after 100 s of etching on the LLO-NP@LPO surface, but disappeared after 200 s of etching. In addition, the EDS line scan results also showed a linear decrease in Ni and P content, indicating a gradient distribution of the dopant element content from the surface to the bulk material.
The XRD results (Fig. 2d) show the presence of characteristic peaks of R-3m LiTMO2 and C2/m Li2MnO3 phases in both samples, and the splitting of the (006)/(102) and (108)/(110) peaks proves that both have a good layer structure. In addition, the (003) peak of LLO-NP@LPO is shifted to a lower angle, indicating that the c-axis lattice parameter is slightly increased after the introduction of the doping element, and the peak intensity ratio of (003)/(104) of LLO-NP@LPO is 2.04, which is slightly lower than that of 2.14 for PLLO, suggesting that the degree of cationic mixing and exclusion increases due to the nickel doping.Rietveld refinement The results show that the mass share of the Li2MnO3 phase decreases from 53.2% (PLLO) to 51.6% (LLO-NP@LPO), and the lesser Li-O-Li conformation reduces the irreversible oxygen loss. In addition, the c-axis and unit cell volume of LLO-NP@LPO were slightly increased, indicating that the introduced phosphate occupies the tetrahedral position of the transition metal layer. The Li+/Ni2+ mixing degree of the two samples was 1.20% and 3.14%, respectively, and proper Li+/Ni2+ mixing (<5 %) could improve the thermal and structural stability of the LLOs.
Raman spectroscopy results show that both samples exhibit strong peaks at 493 and 608 cm−1, corresponding to the Eg and A1g peaks, which represent the bending vibrations of O-TM-O and TM-O bonds in the R-3m phase. Compared with PLLO, the positions of the Eg and A1g peaks of LLO-NP@LPO were red-shifted, indicating that PO43- was introduced around the TM-O and O-TM-O bonds, which lengthened the TM-O bonds and shifted the peak positions toward lower wavelengths, which is in agreement with the reported results of the introduction of PO43-. The results of the HRTEM (Fig. 2e-l) showed that the LLO-NP@LPO that some sites in the near-surface lithium layer are occupied by transition metals, and the particle surface is uniformly coated with a layer of amorphous Li3PO4 of about 3.2 nm.In summary, the modulation of the surface structure of the LLOs has been successfully achieved by the introduction of the Li3PO4 capping layer, as well as the near-surface co-doping of Ni2+ and PO43- (Fig. 2m).
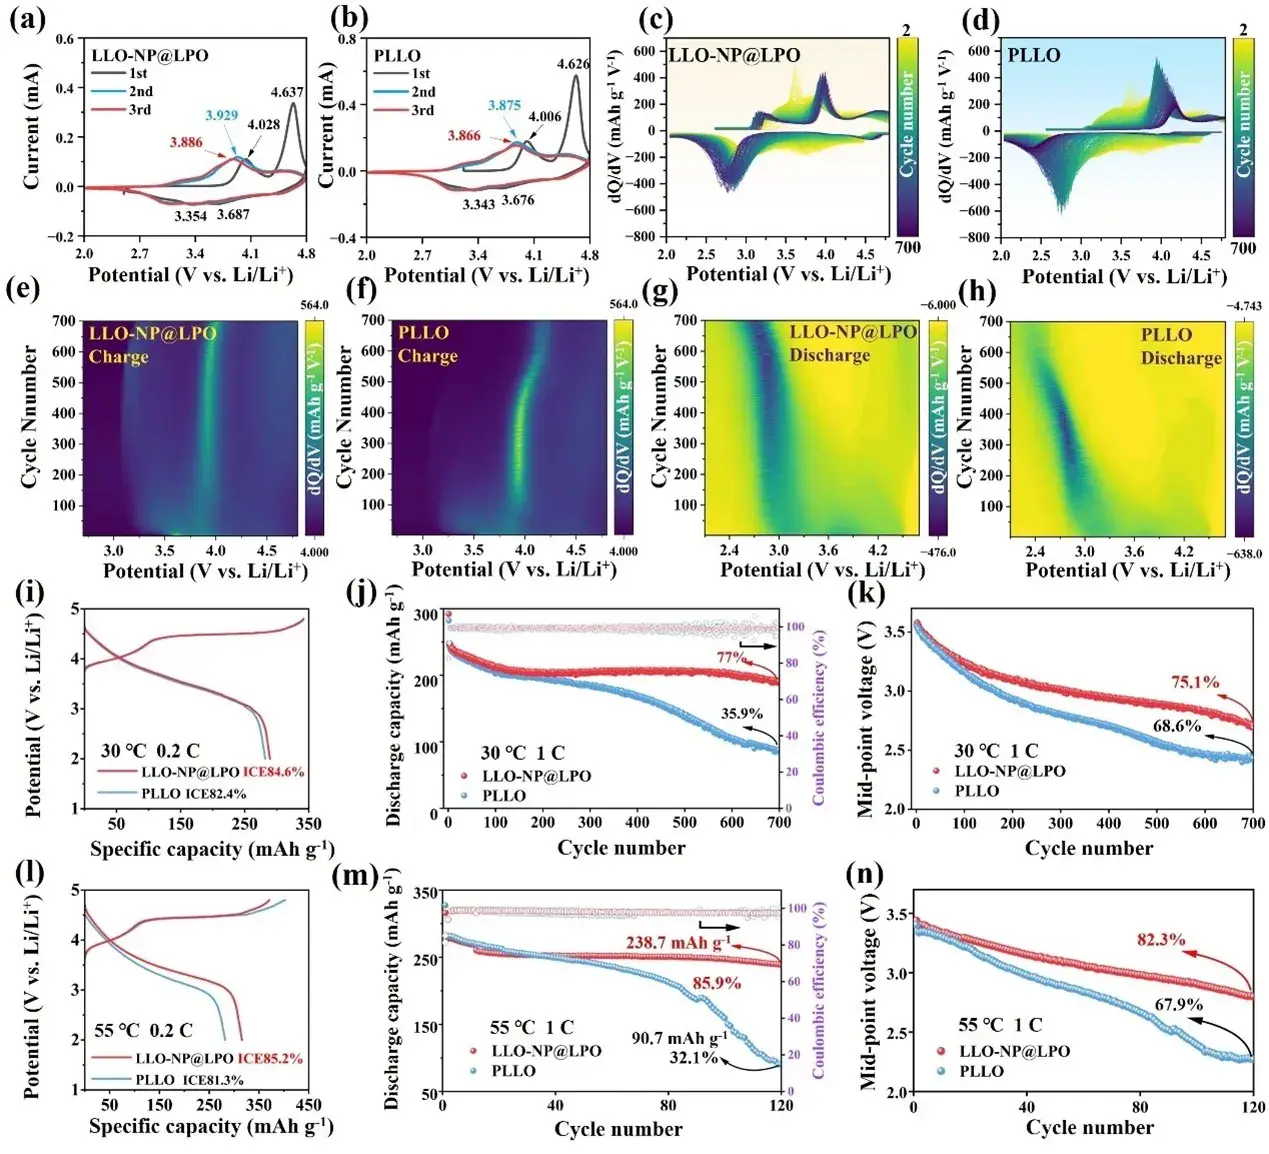
Figure 3. (a-b) Cyclic voltammograms of LLO-NP@LPO and PLLO. (c-d) Cyclic dQ/dV curves and (e-h) corresponding 2D contour plots. initial charge/discharge curves at (i) 0.2C at 30 °C, (j) cyclic performance, and (k) average discharge voltage at 1C. initial charge/discharge curves at (l) 0.2C at 55 °C, (m) cyclic performance, and (n) average discharge voltage at 1C.
To verify the effect of surface reconstruction, the CV curves of the two samples were measured at a scan rate of 0.1 mV-1. In the initial cycle (Figure 3a-b), the peak at about 4.030 V is attributed to the oxidation of Co3+/4+ and Ni2+/4+, while the peak at 4.620 V corresponds to the oxidation of lattice oxygen. The first oxidation peaks of LLO-NP@LPO are located at 4.028 and 4.637 V, respectively, which are higher than 4.006 and 4.626 V of PLLO. The two reduction peaks are related to the reduction of Ni4+/2+ and Co4+/3+, and the peaks corresponding to LLO-NP@LPO are 3.687 and 3.354 V, which are also higher than 3.676 and 3.343 V of PLLO, indicating that the surface reconstruction strategy can improve the working voltage of the redox couple in LLOs, which is consistent with the results of DFT calculations in Figure 1.
The decay of the redox reaction pathway of LLOs during cycling is the main factor causing voltage hysteresis and capacity decay, ultimately leading to the loss of electrochemical activity of the electrode material. Therefore, it is crucial to analyze the changes of the redox pair during the entire cycling process. Figure 3c-d shows the capacity differential (dQ/dV) curves of the two samples during 700 cycles at 1C. In the initial stage of the cycle, oxygen (O2-/On- oxidation potential of about 4.5 V) and nickel (Ni 3+/Ni4+ of about 4.0 V) play the main capacity contributions. However, after further cycling, irreversible oxygen reactions and the migration of nickel ions cause the continuous decay of capacity, and the activation of low-potential manganese (Mn3+/Mn4+ of about 3.0 V) and cobalt (Co3+/Co3+of about 4.0 V) redox pairs compensates for the capacity loss of oxygen and nickel. As shown in Figures 3f and h, the redox pair of the PLLO sample begins to change sharply at 400 cycles and the intensity continues to decrease, which may be due to the continuous phase change that suppresses the redox activity and increases the voltage polarization. At the same time, the accumulation of stress after 400 cycles also led to the formation of PLLO microcracks and the rupture of secondary particles (Figure 7e). In contrast, the LLO-NP@LPO sample still showed stable redox pair reaction intensity (Figure 3e and g) and complete secondary particle morphology (Figure 7f) after 600 cycles, indicating that the surface reconstruction strategy can effectively enhance the reversibility of LLOs redox pairs and alleviate the structural damage and voltage decay of the material in long-term cycles.
To further clarify the advantages of the surface reconstruction strategy, the cycling performance and rate performance of PLLO and LLO-NP@LPO were tested. As shown in Figure 3i, the initial coulombic efficiency of LLO-NP@LPO increased from 82.4% to 84.6%. As shown in Figure 3j, after 700 cycles at 1C, the capacity retention of LLO-NP@LPO increased from 35.9% to 77.0%, and the capacity decay decreased from 0.224 mAh g−1 per cycle for PLLO to 0.081 mAh g−1per cycle for LLO-NP@LPO. In addition, the voltage retention increased from 68.6% to 75.1%, which is equivalent to a decrease in voltage decay from 1.58 mV to 1.27 mV per cycle (Figure 3k). The charge-discharge voltage curves show that the PLLO sample exhibited a rapid voltage decay after 300 cycles, while the voltage decay of the LLO-NP@LPO sample was significantly suppressed, indicating that the lattice structure of the modified sample remained stable. The electrochemical performance of LLO-NP@LPO at different rates was also better than that of PLLO, indicating that the reaction kinetics of LLO-NP@LPO was also enhanced by the in-situ surface reconstruction strategy.
Under high temperature conditions, the problem of structural instability during cycling becomes more serious. High temperature will cause the cathode potential to shift negatively, and the lattice oxygen will be more easily excited to the peroxidized state in the electrochemical reaction, further leading to the degradation of CEI. This problem emphasizes the importance of reducing the position of TM 3d-O 2p and O 2p non-bonding energy levels and reducing the strength of O 2p non-bonding energy levels. This is because this can stabilize the lattice oxygen at high temperature and high pressure by increasing the oxidation potential, while obtaining a higher working voltage. At high temperatures, the HOMO energy level of the electrolyte will also be excited by thermal energy and increase. This change makes the electrolyte tend to lose electrons, thereby increasing its oxidation reactivity. Therefore, the electrolyte is more susceptible to oxidation reactions under high pressure conditions, which further reduces the stability of CEI. Therefore, a stable Li3PO4 coating is crucial to mitigate interfacial side reactions, transition metal leaching, and structural phase changes, thereby ensuring the superior performance of LLOs at high temperatures. Figure 3l shows the initial charge and discharge curves of PLLO and LLO-NP@LPO at 0.2C and 55°C. Due to the enhanced anion redox reaction, the first coulombic efficiency of PLLO decreased from 82.4% at 25 °C to 81.32% at 55 °C. However, LLO-NP@LPO reached 85.19%, exceeding its performance at 25 °C. At 1C, the discharge capacity of LLO-NP@LPO increased significantly after 120 cycles compared with the original sample, reaching 238.7 mAh g−1, and the capacity retention rate reached 85.9%. However, the PLLO sample was only 90.7 mAh g−1, with a capacity retention rate of 32.1% (Figure 3m). After 120 cycles, the voltage retention rate also increased from 67.9% (PLLO) to 82.3% (LLO-NP@LPO) (Figure 3n). Due to the regulation of the energy band and the construction of a stable Li3PO4 coating layer, LLO-NP@LPO can obtain a more reversible specific capacity and a more stable working voltage even at high temperatures.
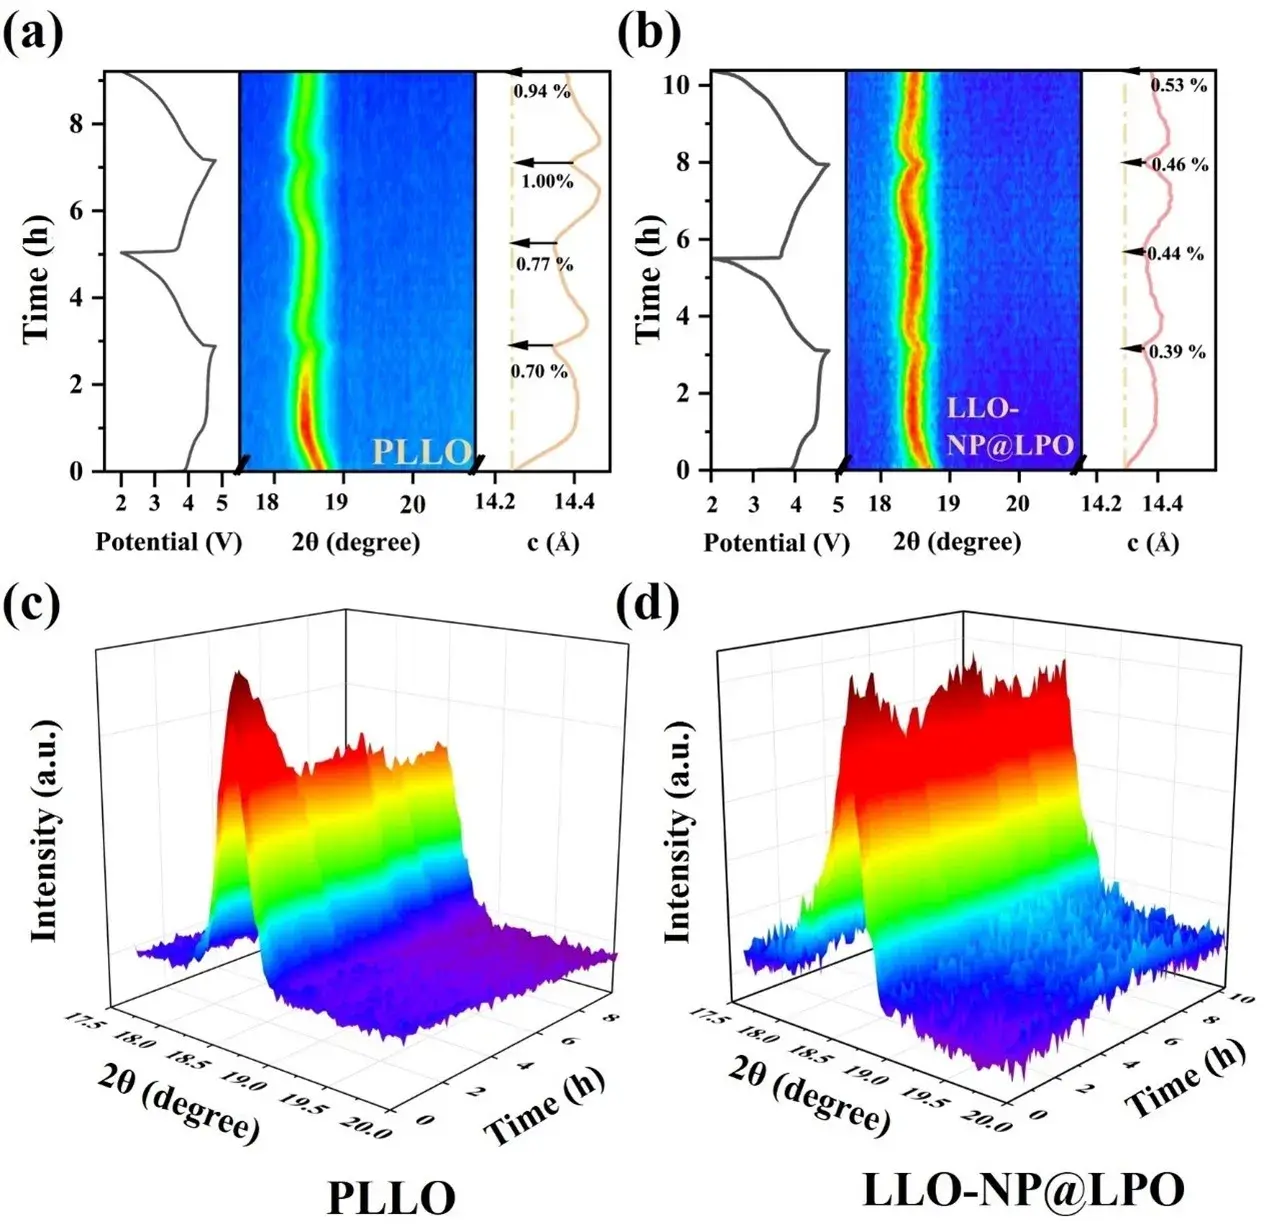
Figure 4. (a) In situ XRD curves of the first two cycles of (a) PLLO and (b) LLO-NP@LPO and the corresponding numerical c-axis curves of charging and discharging. (c) 3D contour plots of the evolution of the (003) peak for the first two cycles of PLLO and (d) LLO-NP@LPO.
In order to investigate the structural evolution of PLLO and LLO-NP@LPO during cycling, we performed in situ XRD tests to follow the peak changes of (003). As shown in Fig. 4a-b, the c-axis values of LLO-NP@LPO are slightly larger due to the co-doping of Ni2+ and PO43- in the initial stage. During the initial charging process, the detachment of lithium ions increases the repulsive forces between the lattice layers, leading to c-axis elongation and low-angle displacement of the (003) peak. Subsequent oxidation of O2- leads to c-axis contraction and (003) peak shifting to a high angle until 4.8 V. The c-axis change rate of LLO-NP@LPO is significantly lower (0.39%) than that of PLLO (0.70%) at 4.8 V, which implies more reversible anionic redox reactions and less oxygen release in LLO-NP@LPO. During the discharge process, the insertion of lithium ions widened the (003) planar spacing and led to a shift of the (003) peak position to a lower angle. Further lithium ion insertion reduced the repulsive force between neighboring oxygen layers and lowered the c-axis value. The c-axis change rates of LLO-NP@LPO were 0.44%, 0.46%, and 0.53%, respectively (Figure 4a), which were significantly lower than those of PLLO (0.77%, 1.00%, and 0.94%) (Figure 4b). In addition, the irreversible oxygen loss destroyed the lattice structure, preventing the (003) peak from returning to its original position, accompanied by a decrease in the (003) peak intensity. Both the in situ XRD two-dimensional and three-dimensional evolution diagrams (Figures 4c-d) showed that the (003) peak intensity of PLLO continued to decay during the cycle. In contrast, the (003) peak of LLO-NP@LPO remained consistent, indicating that its structural stability was significantly enhanced. These results indicate that the surface reconstruction strategy can effectively regulate the surface lithium ion transport behavior and oxygen redox reversibility, improve structural stability, reduce uneven stress accumulation, and prevent particle collapse.
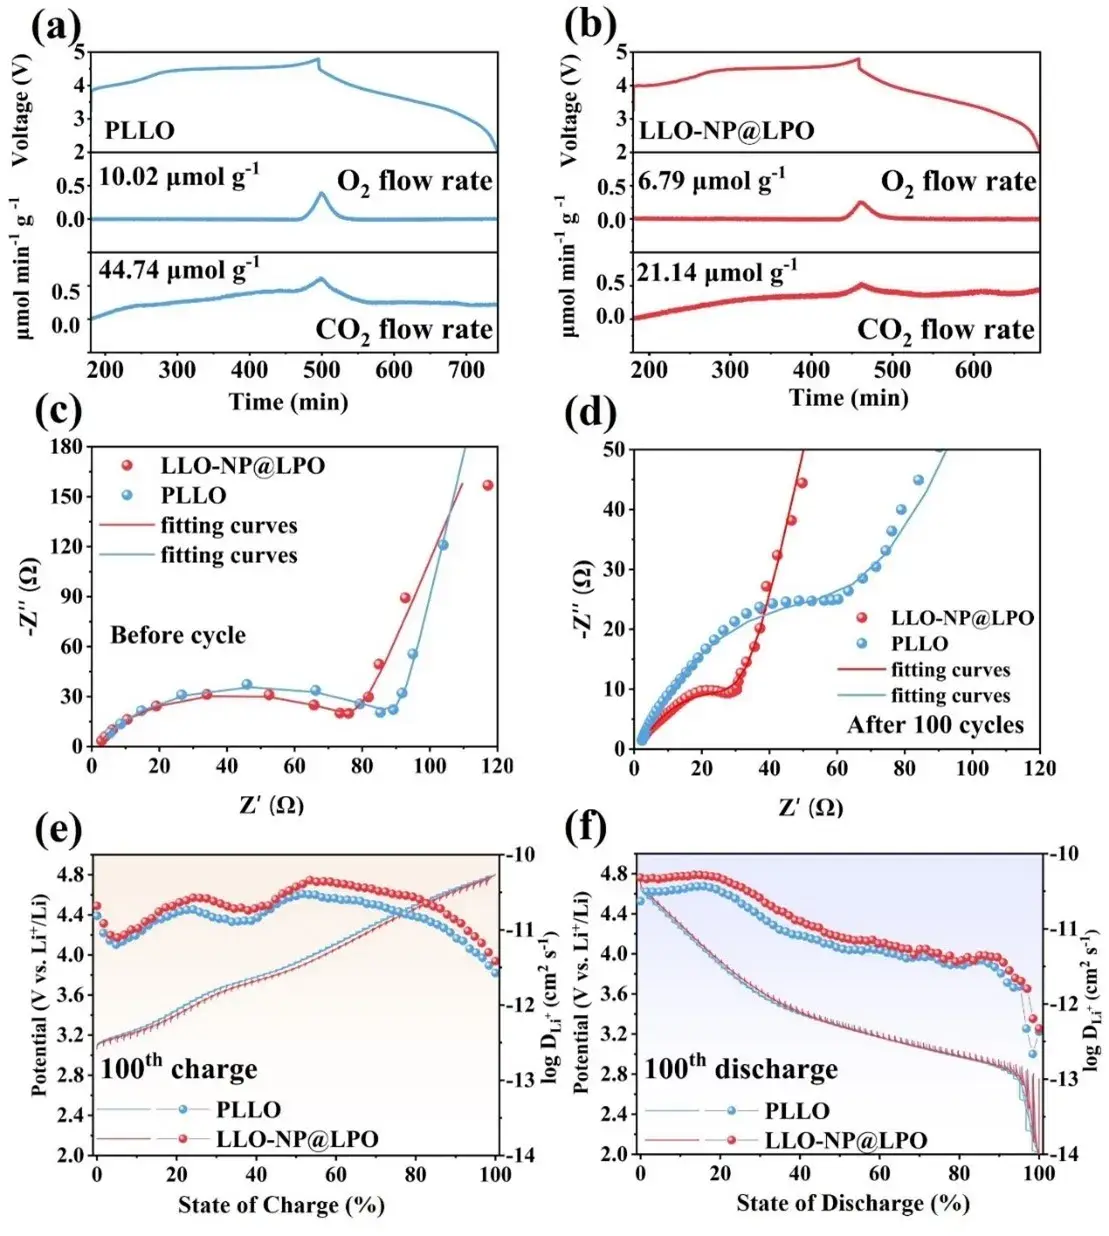
Figure 5. DEMS test during charging and discharging of (a) PLLO and (b) LLO-NP@LPO. Electrochemical impedance spectra of PLLO and LLO-NP@LPO before cycling (c) and after 100 cycling cycles (d). (e, f) GITT curves and corresponding calculated Li-ion diffusion coefficients at 0.2C after 100 cycling cycles.
To investigate the interfacial stability and quantify the gas production of the materials, differential electrochemical mass spectrometry (DEMS) tests were performed on LLO-NP@LPO and PLLO at 0.2 C, and the results showed that the release of O2 and CO2 in the LLO-NP@LPO sample was significantly reduced. As shown in Figure 5a-b, the O2 released by PLLO and LLO-NP@LPO in the first cycle was 10.02 and 6.79 µmol g−1, respectively. The CO2 gas production gradually increased before charging to 4.8 V due to the oxidation of organic carbonates and the decomposition of residual Li2CO3 on the electrode surface. After LLOs produced oxygen at high pressure, organic carbonates were reoxidized, resulting in more carbon dioxide gas release. The carbon dioxide released by PLLO and LLO-NP@LPO was 44.74 and 21.14 µmol g−1, respectively. The above results indicate that the surface reconstruction strategy can effectively alleviate the release of oxygen and the decomposition of the electrolyte.
The electrochemical impedance spectra (EIS) of PLLO and LLO-NP@LPO are shown in Figure 5c-d. The charge transfer resistance (Rct) of PLLO and LLO-NP@LPO before cycling was 90.27 and 77.87 Ω, respectively, and the Rct values after 100 cycles were 64.05 and 26.09 Ω, respectively, indicating that a more stable electrode/electrolyte interface was obtained through the surface reconstruction strategy. By calculating the lithium ion diffusion coefficients of the two samples after cycling, the slope of the PLLO sample after cycling was greater than that of the LLO-NP@LPO sample, indicating that the LLO-NP@LPO sample has enhanced lithium ion diffusion kinetics due to the enlarged lattice spacing and the construction of the fast ion conductor coating layer. These characteristics can protect the positive electrode from electrolyte corrosion, inhibit the formation of electrochemically inert phases, and provide a fast lithium ion transmission channel.
The constant current intermittent titration technique (GITT) test was used to compare the lithium ion diffusion coefficients (DLi+) of PLLO and LLO-NP@LPO after 100 cycles. As shown in Figure 5e-f, when the state of charge (SoC) is lower than 20%, the DLi+ values of the two samples are similar. In the subsequent charging stage, although the redox process of oxygen under high pressure will cause DLi+ to decrease significantly, the DLi+ of LLO-NP@LPO under high pressure is still higher than that of PLLO. During discharge, the LLO-NP@LPO sample also exhibits higher DLi+ than PLLO. In summary, the surface reconstruction strategy reduces the release of LLOs oxygen and enhances the stability of the structure, so the LLO-NP@LPO sample exhibits low interfacial impedance and strong lithium ion diffusion dynamics.
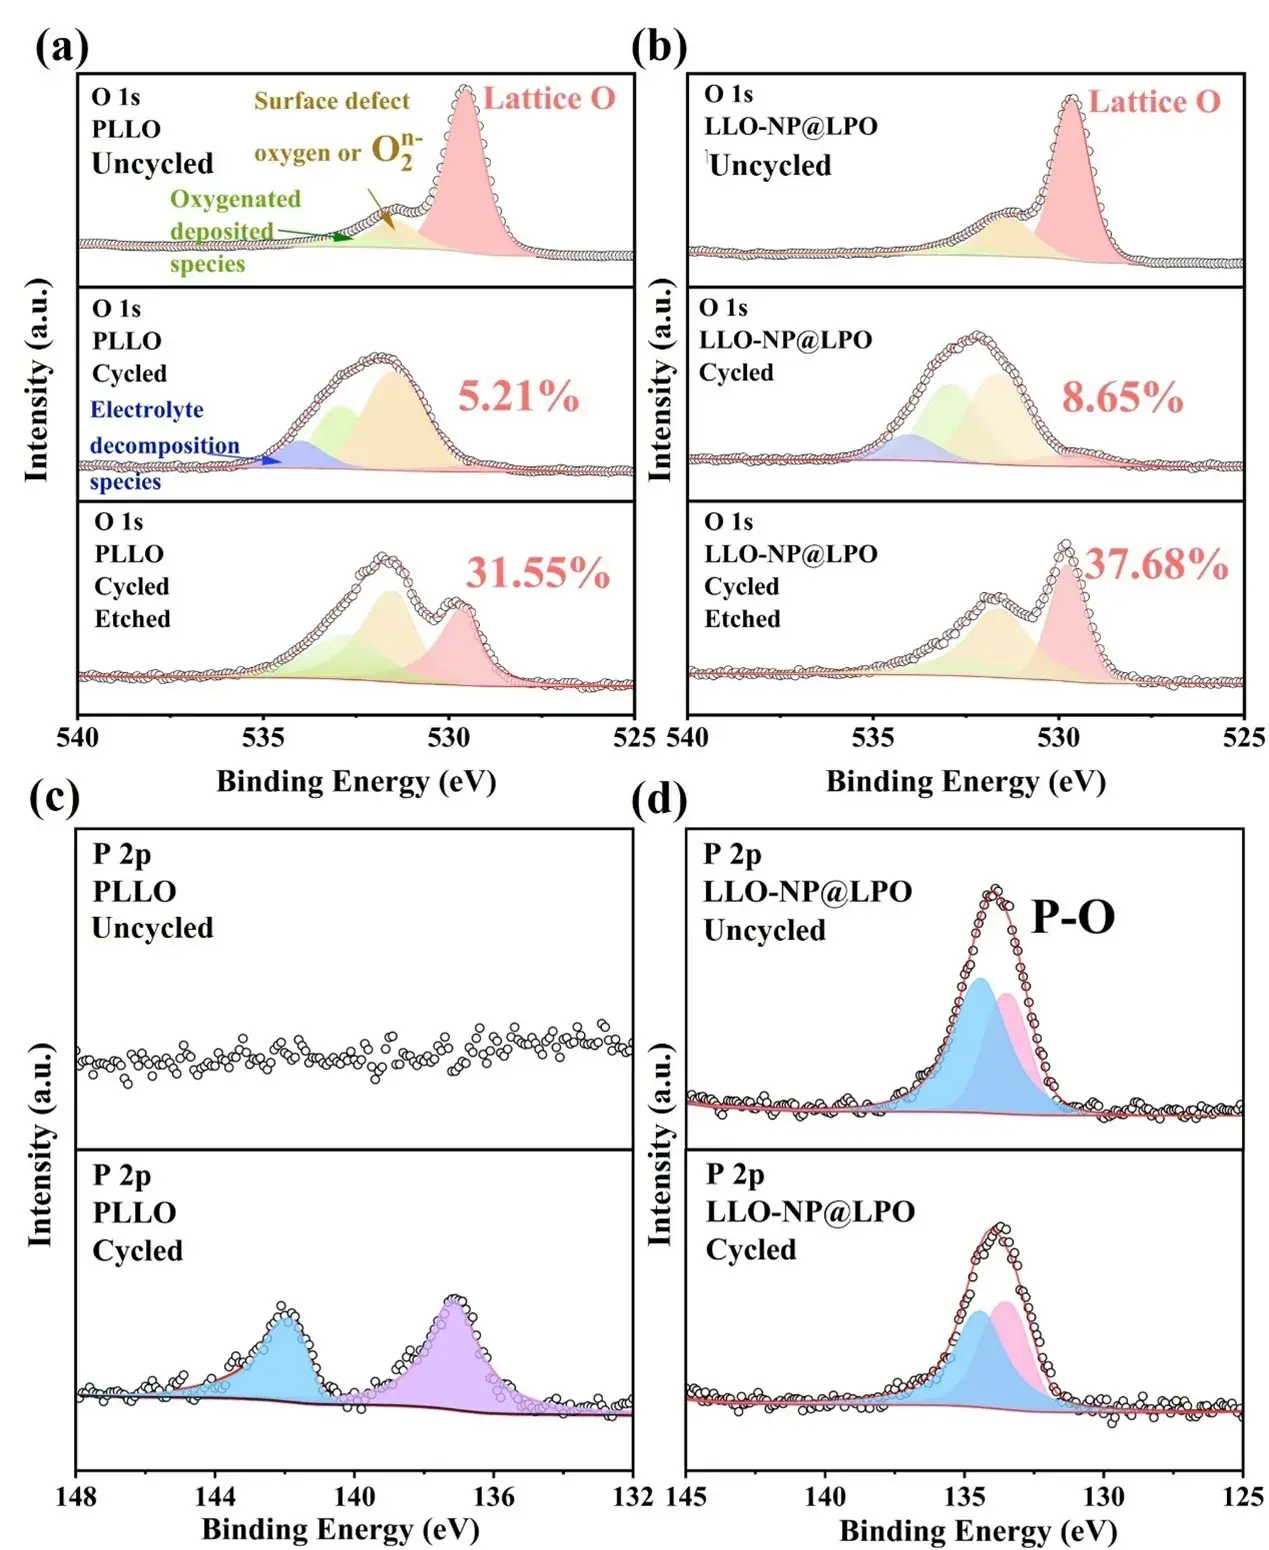
Figure 6. XPS maps of (a, b) O 1s (c, d) P 2p in PLLO and LLO-NP@LPO samples.
In order to analyze the changes in surface composition during long-term cycling, the changes in O and P elements before and after cycling were analyzed by XPS. In the O 1s peak shown in Figure 6a-b, the energy level peaks at 529.60, 531.53, and 532.80 eV correspond to lattice oxygen (red), defect oxygen O2n- (yellow), and oxygen-containing deposition species (green). After 700 cycles, a new peak appeared at 534 eV for O 1s, which is related to oxygen-containing organic substances produced by electrolyte degradation. After cycling, the lattice oxygen ratio of LLO-NP@LPO is 8.65%, which is higher than 5.21% of PLLO, while the defect oxygen O2n- ratio of LLO-NP@LPO is 44.28%, which is lower than 53.72% of PLLO. After etching to a certain depth, the proportion of lattice oxygen in LLO-NP@LPO is 37.68%, which is still higher than 31.55% of PLLO, indicating that the redox behavior of oxygen in LLO-NP@LPO is more reversible after long cycles. By comparing the P 2p peaks of the two samples before and after cycling (Figure 6c-d), no relevant P peaks were detected in PLLO before cycling, but after cycling, the peaks at 137.1 and 141.6 eV belong to two phosphorus species produced by the decomposition of the electrolyte after cycling. For the LLO-NP@LPO sample, the peaks related to PO43- at 133.2 and 134.1 eV did not change significantly before and after cycling, indicating that the coating effectively prevented LiPF6 from decomposing in the electrolyte and reacting with the surface of the positive electrode particles. Raman spectroscopy shows that a new peak related to the Mn-O vibration of the spinel phase appears around 650 cm⁻¹ after cycling. By comparing the area ratio of the layered phase to the spinel phase, the degree of phase change after cycling can be clarified. The ratio of the LLO-NP@LPO sample after cycling was calculated by fitting to be 1.62, which is significantly higher than 0.87 of PLLO. This result shows that the layered structure of the LLO-NP@LPO sample is well protected. In contrast, the layered structure of PLLO collapsed significantly, resulting in a decrease in electrochemical performance.
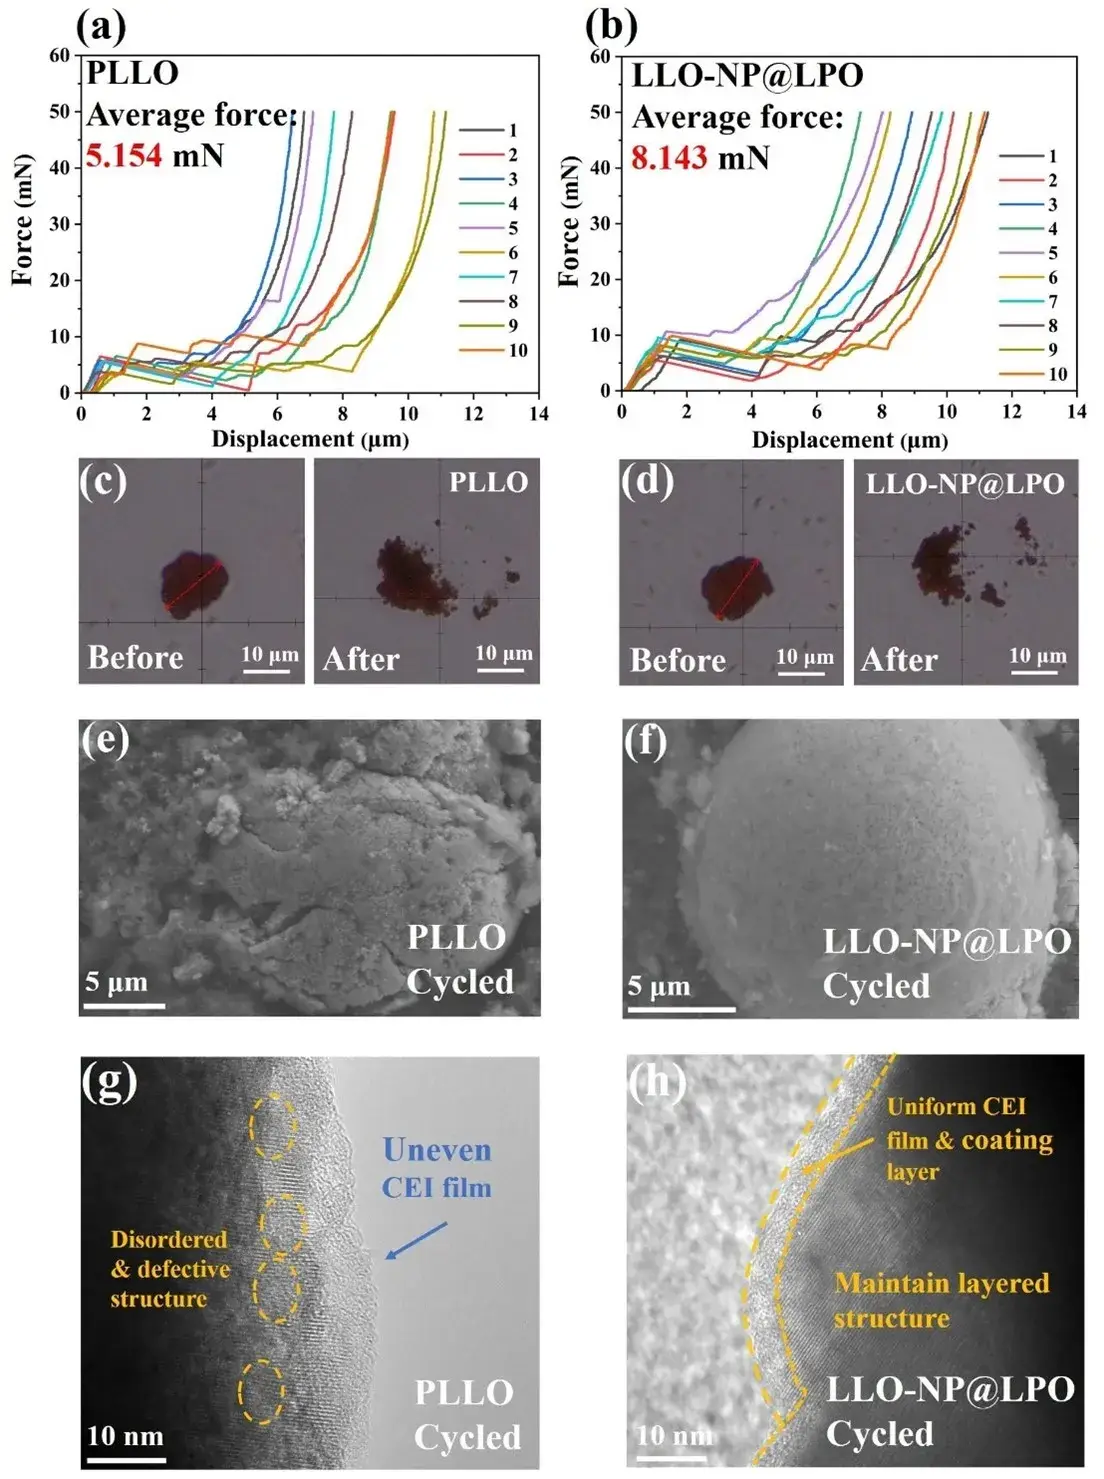
Figure 7. (a) Single particle crushing test curves of PLLO and (b) LLO-NP@LPO. (c, d) Optical photos of PLLO and LLO-NP@LPO before and after single particle crushing test. (e, f) SEM, and (g, h) TEM images of PLLO and LLO-NP@LPO after 400 cycles.
The inherent physical properties of cathode materials are closely related to their electrochemical performance, so single particle crushing tests were carried out on the two samples to explore the effect of surface reconstruction strategies on the structural stability of the materials. As shown in Figure 7a-b, the displacement stress curve of a single particle was obtained by high-precision displacement control and pressure measurement, and the size of the particle crushing value was determined by combining the average value of the inflection points in the 10 curves. During the compression process, the particles first undergo elastic deformation until they reach the breaking point. Figure 7c-d are optical photographs of the two samples before and after the test. The results show that the average crushing force of PLLO is 5.154 mN, while the average crushing force of LLO@NP-LPO is as high as 8.143 mN, proving that the LLO@NP-LPO sample requires a higher pressure before the material collapses, so it can withstand greater stress than the PLLO sample during long cycles. The particle morphology and lattice structure of PLLO and LLO-NP@LPO after 400 cycles were detected by SEM and TEM (Figure 7e-h). The SEM image showed that the secondary particles of PLLO showed a broken and collapsed morphology after cycling (Figure 7e), while the internal lattice structure transformed into a spinel/rock salt phase. Some areas showed lattice distortion and defects and uneven CEI layers (Figure 7g). The formation of these areas was mainly due to the release of oxygen and the leaching of transition metal ions, resulting in irreversible transformation of the layered structure after cycling. In contrast, the overall morphology of LLO-NP@LPO (Figure 7f) still maintained more complete spherical secondary particles after cycling, as well as a better internal layered structure and uniform CEI layer (Figure 7h). The above results show that the high durability of LLO-NP@LPO in long cycles is closely related to fewer interfacial side reactions and stable particle structures.
3. Summary and outlook
In this paper, a new design approach for high-voltage, high-energy LLOs is proposed, i.e., elemental doping near the surface of the LLO material to adjust the energy band positions through an in situ surface reconstruction strategy, combined with surface cladding layer construction to stabilize the cathode/electrolyte interfacial side reactions. The near-surface co-doping of Ni2+ and PO43- reduces the energy level positions of TM 3d-O 2p and non-bonded O 2p, which increases the working voltage of the material and enhances the reversibility of oxygen redox. In addition, the Li3PO4 capping layer on the surface protects the cathode surface from electrolyte erosion while promoting rapid Li+ transport, resulting in excellent battery performance. This paper provides new ideas for designing and improving the comprehensive electrochemical performance of LLOs and other similar high-voltage cathode materials.
4. Original Paper
Tailoring redox couples of Li-rich Mn-based cathode materials by in-situ surface reconstruction for high-performance lithium-ion batteries. Nano Energy 134 (2025)110588
5. Related Test Equipment Recommendation
You may want to learn about our equipment: IEST SPFT-2000 Single Particle Mechanical Properties Test System

Application:
- Testing the crushing strength of battery material particles
- Can be used to evaluate the pressure resistance of the material
- Guide the rolling process
- Materials with high mechanical strength will have better subsequent cycle stability
Subscribe Us
Contact Us
If you are interested in our products and want to know more details, please leave a message here, we will reply you as soon as we can.


