

The rapid expansion of the new energy sector has intensified demand for cost-effective anode materials across both lithium-ion and sodium-ion battery chemistries. Graphite dominates lithium-ion applications due to its well-established intercalation mechanism and predictable processing behavior. In sodium-ion systems, however, graphite performs poorly: the larger ionic radius of Na⁺ renders sodium intercalation into the ordered graphene layers thermodynamically unfavorable, resulting in negligible practical capacity.
Hard carbon has emerged as the preferred anode alternative for sodium-ion batteries, offering high specific capacity (~300 mAh/g) and a low sodiation plateau (~0.1 V vs. Na/Na⁺). Yet electrochemical performance alone does not determine commercial viability. Powder physical properties — electrical conductivity, compaction density, and thickness rebound — directly influence slurry processing, electrode calendering, and final cell energy density. A rigorous hard carbon vs graphite comparison across these parameters is therefore essential for R&D and process engineers selecting or optimizing anode materials.
This article presents systematic test data collected using the IEST PRCD3100 Powder Resistivity & Compaction Density Tester, covering two graphite grades and two hard carbon grades at pressures from 5 to 200 MPa.
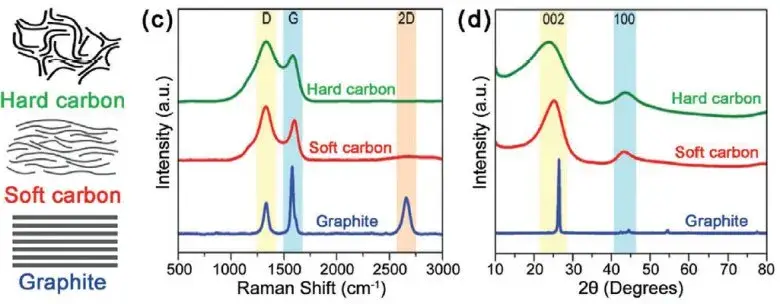
Figure 1. Structural differences between graphite (ordered stacking), hard carbon (turbostratic, non-graphitizable), and soft carbon (graphitizable)2
The terms “hard carbon” and “soft carbon” derive from the pioneering work of Rosalind Franklin (1951), who classified carbonaceous materials by their response to high-temperature graphitization heat treatment:
Understanding whether carbon is “graphitizable” determines its electrochemical behavior: soft carbon shows moderate sodium storage due to partial layer ordering, while hard carbon’s micropores and defect sites provide higher Na⁺ adsorption capacity (~300 mAh/g) at the low-voltage plateau that is critical for energy density in sodium-ion full cells.
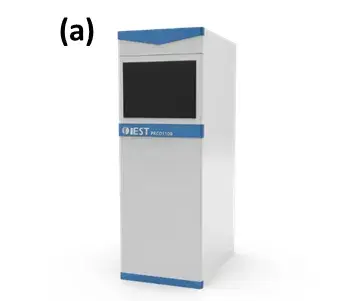
The IEST PRCD3100 Powder Resistivity & Compaction Density Tester was used to characterize all four anode powder grades. The PRCD3100 applies controlled uniaxial pressure while simultaneously recording:
This integrated approach eliminates systematic errors that arise when electrical and mechanical properties are measured separately under non-identical compaction states — a common source of inter-laboratory discrepancy in published anode material data.
 |
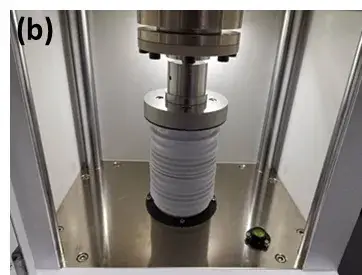 |
Figure 2. IEST PRCD3100 Powder Resistivity & Compaction Density Tester — (a) appearance; (b) internal structure with simultaneous pressure, resistivity, and thickness measurement
Each sample was compressed from 5 MPa to 200 MPa in increments of 20 MPa, with a 10-second dwell at each pressure step. Data were recorded during both pressurization and depressurization, enabling calculation of elastic (reversible) and plastic (irreversible) deformation components. This protocol mirrors the stress conditions encountered during industrial electrode calendering, making the results directly applicable to production process parameter setting.
As shown in Figure 3, graphite substantially outperforms hard carbon in both electrical conductivity and compaction density across the full 5–200 MPa pressure range. The ordered, parallel graphene layers in graphite facilitate electron transport along the basal plane, yielding high graphite conductivity values that increase steadily with applied pressure.
Hard carbon’s disordered turbostratic structure — characterized by randomly oriented graphene fragments, cross-links, and closed micropores — impedes electron mobility, resulting in markedly lower conductivity at equivalent pressures. The graphite density under compression approaches its true density of 2.3 g/cm³ at high pressures. Hard carbon density remains significantly lower even at 200 MPa: the inherent microporosity and structural defects resist full densification, leaving residual voids that limit achievable compaction density. This difference in graphite density vs hard carbon density has direct consequences for electrode coating weight, calendering targets, and volumetric energy density calculations.
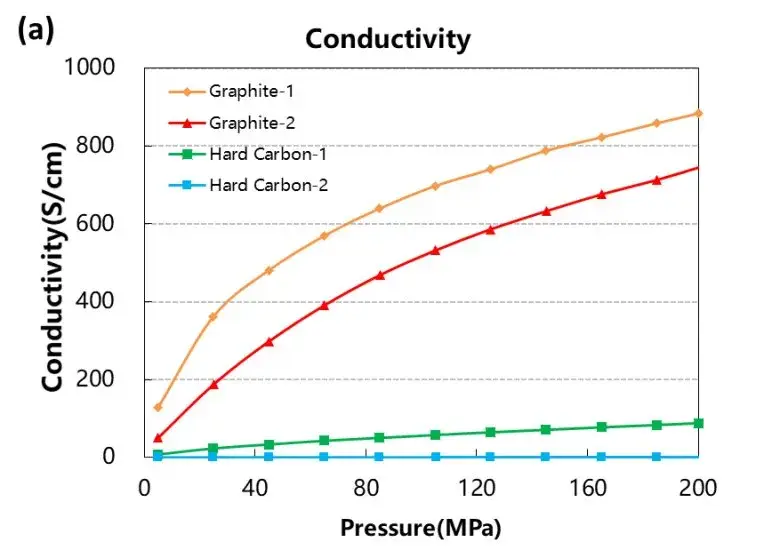
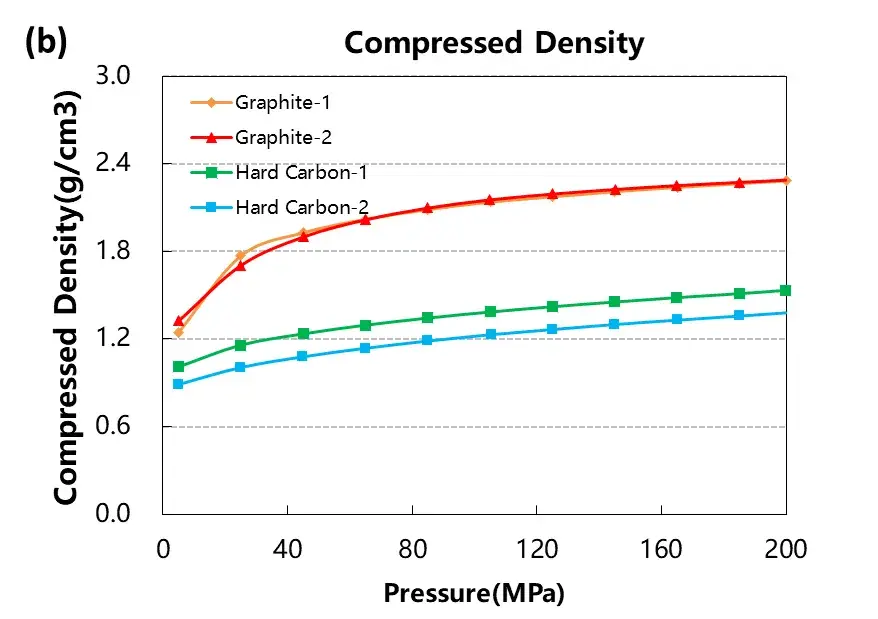
Figure 3. Electrical conductivity and compaction density curves for two graphite grades (top) and two hard carbon grades (bottom) measured by IEST PRCD3100 at 5–200 MPa
Thickness rebound after compression is a critical variable in electrode calendering, where a stable final thickness must be maintained after the calender rolls release pressure. The stress-strain data reveal a pronounced divergence between the two material classes:
The disordered carbon shows greater reversible deformation across the entire pressure range, with elastic rebound persisting even above 100 MPa. Both HC grades also display higher irreversible deformation, suggesting partial structural collapse under high compaction loads.
These results confirm that graphite offers superior dimensional stability during electrode manufacturing. Process engineers working with hard carbon anodes should account for elevated rebound when setting roll gap targets, and may need higher pressure or multi-pass calendering to reach the desired electrode density.
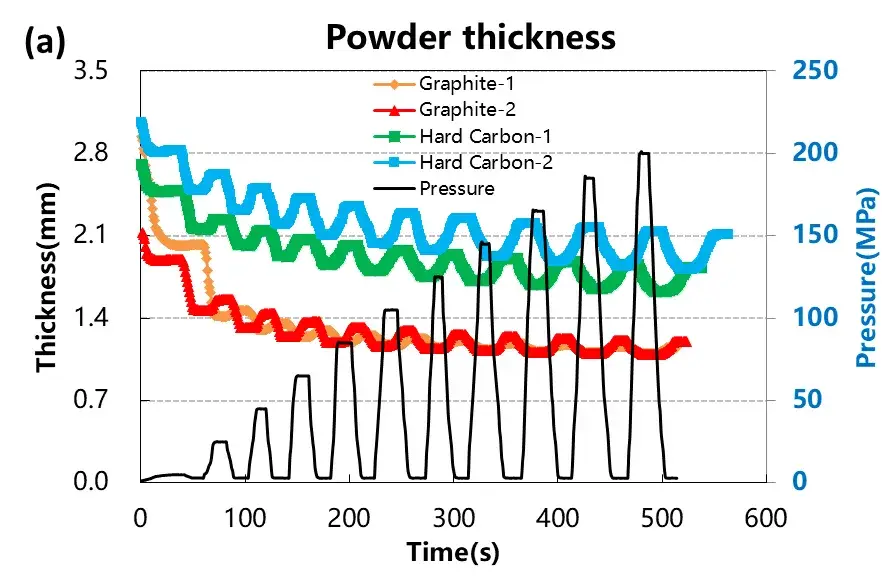
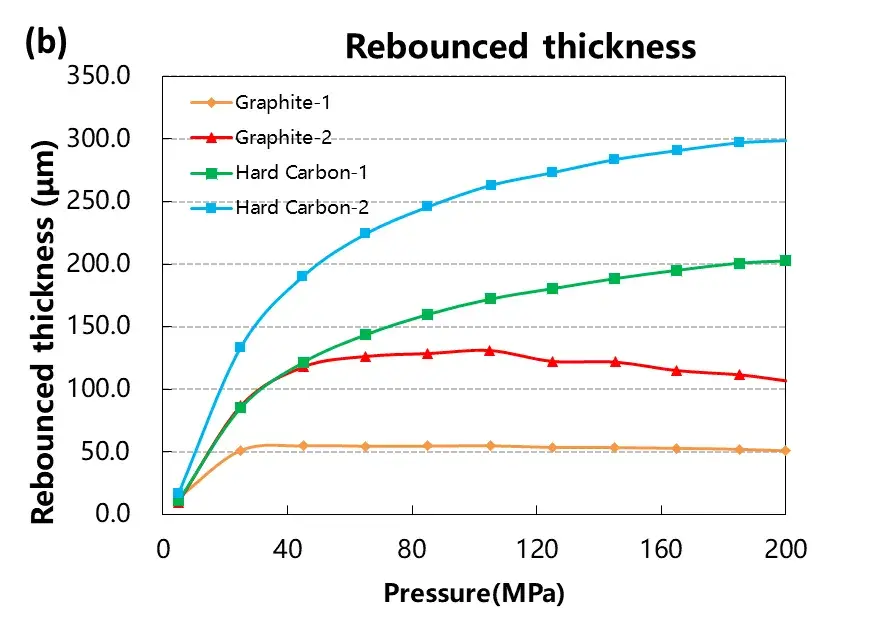
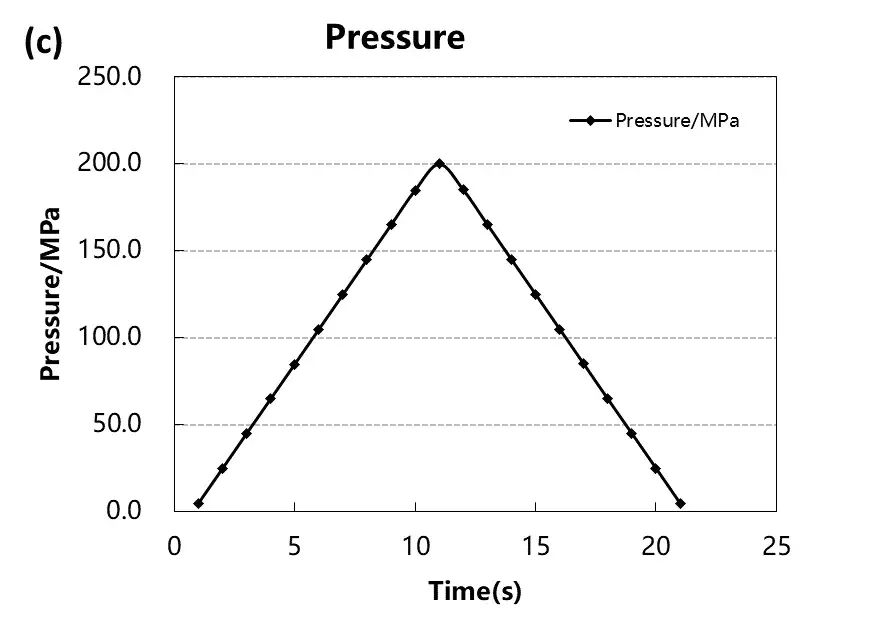
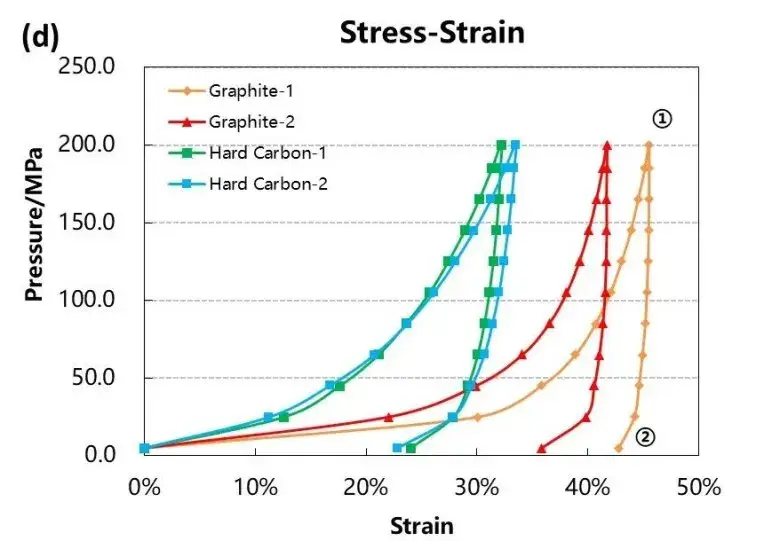
Figure 4. Stress-strain curves during pressurization and depressurization for all four anode materials — IEST PRCD3100, 5–200 MPa, 20 MPa increments, 10 s dwell per step
| Name | Reversible Deformation | Irreversible Deformation | Max Deformation |
|---|---|---|---|
| Graphite-1 | 2% | 43% | 45% |
| Graphite-2 | 6% | 36% | 42% |
| Hard Carbon-1 | 8% | 24% | 32% |
| Hard Carbon-2 | 10% | 23% | 33% |
The following table integrates PRCD3100 test data with published electrochemical and structural parameters to provide a complete material selection reference for anode engineers:
| Parameter | Graphite (2 grades avg) | Graphitic Hard Carbon | Hard Carbon (2 grades avg) | Soft Carbon |
|---|---|---|---|---|
| Crystal structure | Ordered ABAB graphene stacking | Short-range order, cross-links retained | Turbostratic, non-graphitizable | Partially ordered, graphitizable |
| Electrical conductivity (PRCD3100) | High; increases steadily with pressure | Intermediate; lower than graphite | Low; scattered by defects and micropores | Moderate; higher than hard carbon |
| Compaction density at 200 MPa | ~2.3 g/cm3 (approaches true density) | Intermediate | Substantially lower (microporosity limits) | Intermediate |
| Elastic rebound after calendering | Minimal above 50 MPa; stable electrode | Moderate | High; persists above 100 MPa | Low to moderate |
| Na+ storage capacity | ~37 mAh/g (negligible) | Moderate (slope region dominant) | ~300 mAh/g at ~0.1 V vs Na/Na+ | ~100–200 mAh/g |
| Li+ storage capacity | ~372 mAh/g (LiC6 theoretical) | ~250–300 mAh/g | ~200–300 mAh/g | ~200–250 mAh/g |
| Graphitizable above 2500°C? | N/A (already graphite) | Partially | No — non-graphitizable | Yes |
| Primary battery application | LIB anode (standard) | LIB/SIB hybrid | SIB anode (preferred) | LIB/SIB (lower capacity) |
| Calendering process complexity | Low — stable thickness after rolling | Moderate | High — rebound compensation required | Low to moderate |
The observed differences in conductivity, compaction density, and rebound trace directly to each material’s microstructure. Graphite consists of stacked graphene layers held together by van der Waals forces. Electrons travel freely parallel to these layers, producing high graphite conductivity. Under compression, the layers slide and pack efficiently, enabling the high compaction density and low elastic recovery measured in PRCD3100 testing.
Graphitic hard carbon — grades with partially ordered, short-range graphene stacking — occupies a structural intermediate between fully disordered hard carbon and true graphite. Even so, graphitic hard carbon retains the cross-links and closed pores characteristic of the non-graphitizable carbon family, which prevent full ordering and limit both charge transport and packing density relative to standard graphite.
Fully disordered hard carbon contains micropores, oxygen functional groups, and covalent cross-links that scatter electrons and resist structural collapse under pressure. These features explain both the lower conductivity and the elevated elastic rebound recorded across both hard carbon grades in this study.
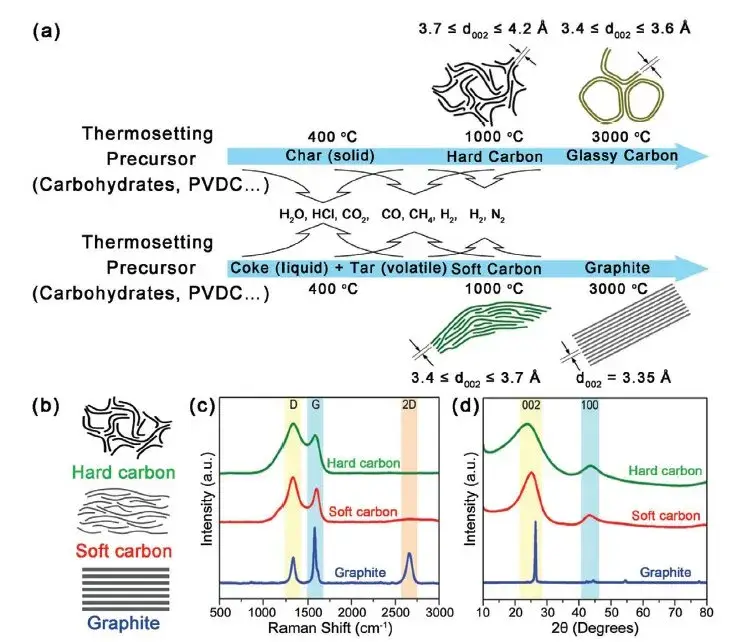
Figure 5. Formation pathways and microstructure of graphite, hard carbon (non-graphitizable), and soft carbon (graphitizable)2
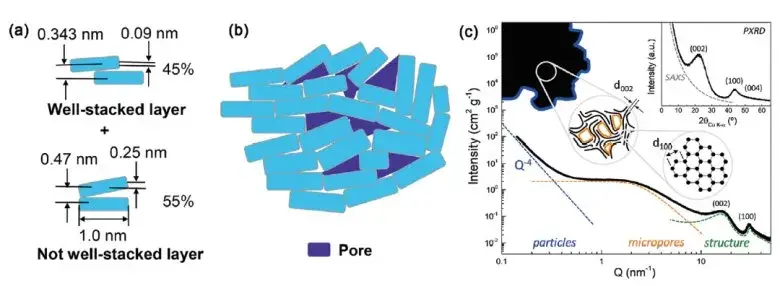
Figure 6. Hard carbon microstructure schematic — turbostratic graphene fragments, closed micropores, and covalent cross-links that scatter electrons and resist structural collapse under compression2
PRCD3100 testing at 5–200 MPa provides the following actionable conclusions for anode material selection and electrode process design:
Graphite delivers significantly higher electrical conductivity and compaction density than hard carbon. Graphite compaction density approaches 2.3 g/cm³ at high pressures; hard carbon density remains substantially lower due to persistent microporosity.
Hard carbon exhibits greater elastic rebound throughout the compression cycle, which must be factored into calendering process parameters — typically requiring higher applied pressure or multi-pass calendering to achieve target electrode thickness and density.
The fundamental driver of these differences is microstructural: ordered graphene stacking in graphite enables efficient electron transport and dense packing, while the disordered, cross-linked turbostratic structure of hard carbon hinders both.
When selecting anode materials for sodium-ion batteries, the high specific capacity (~300 mAh/g) and low sodiation plateau (~0.1 V vs. Na/Na⁺) of hard carbon make it the preferred electrochemical choice over graphite. However, its lower compaction density and higher rebound require adjusted process parameters relative to graphite-based electrode lines. Quantifying these properties with the IEST PRCD3100 before production scale-up reduces the risk of electrode manufacturing failures and supports data-driven anode material selection.
The PRCD3100 is a premier powder characterization platform engineered for the simultaneous, high-precision evaluation of powder resistivity and compaction density, which simultaneously measures electrical resistivity (\(10^{-6}\)–\(10^{5}\) Ω·cm), compaction density (g/cm³), and thickness rebound at 5–200 MPa — in a single test run, eliminating the measurement errors caused by separate electrical and mechanical characterization.
[1] Hu Yongsheng,Lu Jiaxiang,Chen Liquan,etc.,Sodium Ion Battery Science and Technology, Science Press,2020,134-137.
[2] Lijing Xie, Cheng Tang, Zhihong Bi,et al. Hard Carbon Anodes for Next-Generation Li-Ion Batteries: Review and Perspective. Adv.Energy Mater.2021, 2101650.
Graphite conductivity is significantly higher than that of hard carbon across all compaction pressures tested (5–200 MPa). Graphite’s ordered layered structure allows electrons to move freely parallel to the graphene planes. The disordered turbostratic microstructure of hard carbon — containing micropores, covalent cross-links, and oxygen functional groups — scatters electrons and reduces conductivity. This conductivity gap widens at lower pressures and narrows somewhat as pressure increases inter-particle contact.
Graphite compaction density approaches its true density of 2.3 g/cm³ under high pressure, while hard carbon density remains lower due to inherent closed microporosity that resists full compression even at 200 MPa. Higher compaction density directly translates to higher volumetric energy density in finished electrodes. This is why graphite remains preferred in lithium-ion cells where volumetric efficiency is critical, while hard carbon process engineers must use higher calendering pressures to compensate for lower achievable density.
Hard carbon is the preferred sodium-ion battery anode because Na⁺ ions cannot intercalate efficiently into ordered graphite lattice layers — the larger ionic radius of Na⁺ (1.02 Å vs 0.76 Å for Li⁺) makes this thermodynamically unfavorable, yielding negligible capacity (~37 mAh/g). Hard carbon’s disordered turbostratic structure and abundant closed micropores provide accessible sodium storage sites, achieving specific capacities near 300 mAh/g at a low plateau potential of approximately 0.1 V vs. Na/Na⁺.
Hard carbon is a non-graphitizable carbon: its structure, locked by covalent cross-links, cannot be converted to graphite even at temperatures above 2500°C. Soft carbon is graphitizable — heat treatment progressively orders its structure toward graphite. Hard carbon retains higher closed microporosity and greater sodium storage capacity (~300 mAh/g) than soft carbon (~100–200 mAh/g), making hard carbon the stronger sodium-ion battery anode candidate. In electrode manufacturing, hard carbon also shows greater calendering rebound than soft carbon.
Hard carbon exhibits greater elastic recovery after compression compared to graphite, meaning the electrode partially springs back in thickness after calender rolls release pressure. Process engineers must compensate by applying higher calendering pressure or using multi-pass calendering to achieve target electrode density and thickness. Measuring thickness rebound with the IEST PRCD3100 powder compaction tester before production scale-up allows engineers to establish accurate roll gap settings and avoid systematic thickness deviations in finished electrodes.
