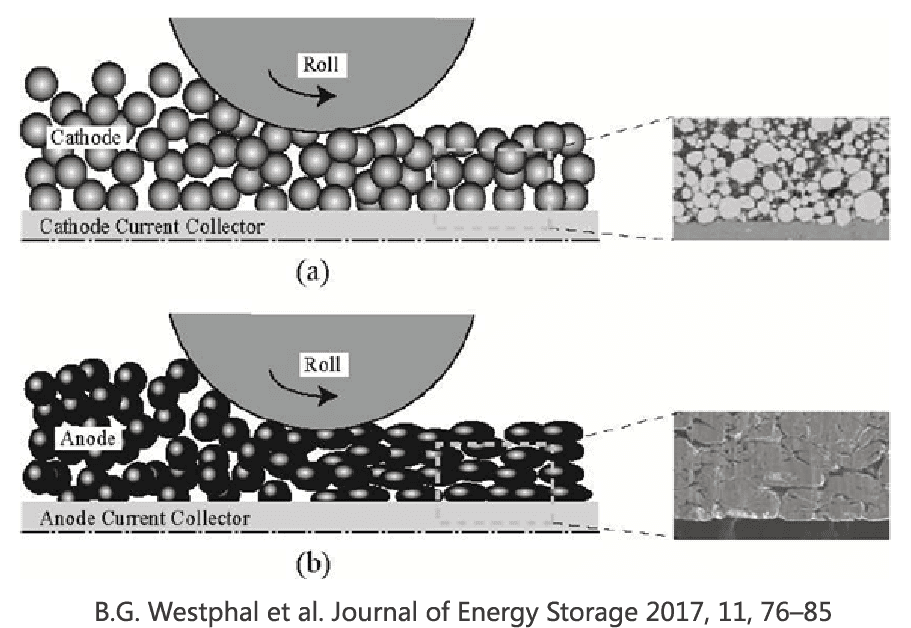
The rate capability of lithium-ion batteries is closely related to their internal resistance, which consists of ionic resistance and electronic resistance. Ionic resistance primarily includes the resistance to lithium-ion transport through the electrolyte within electrode pores, the resistance due to ion migration through the SEI film, the charge transfer resistance at the active material/SEI interface where ions and electrons interact, and the solid-state diffusion resistance of lithium ions within the active material. Electronic resistance, on the other hand, mainly comprises the resistance of the active materials in the cathode and anode, the current collectors, the contact resistance between active material particles, the interfacial resistance between active materials and current collectors, as well as the resistance from tab welding.
In practical battery development and manufacturing processes, ionic resistance must be evaluated at the finished cell level, whereas electronic resistance can be rapidly assessed at the material and electrode sheet stages. Therefore, accurate evaluation of electronic resistance in materials and electrodes—for instance, via a powder resistivity measurement system—is highly significant for predicting the overall resistance of the final battery cell.
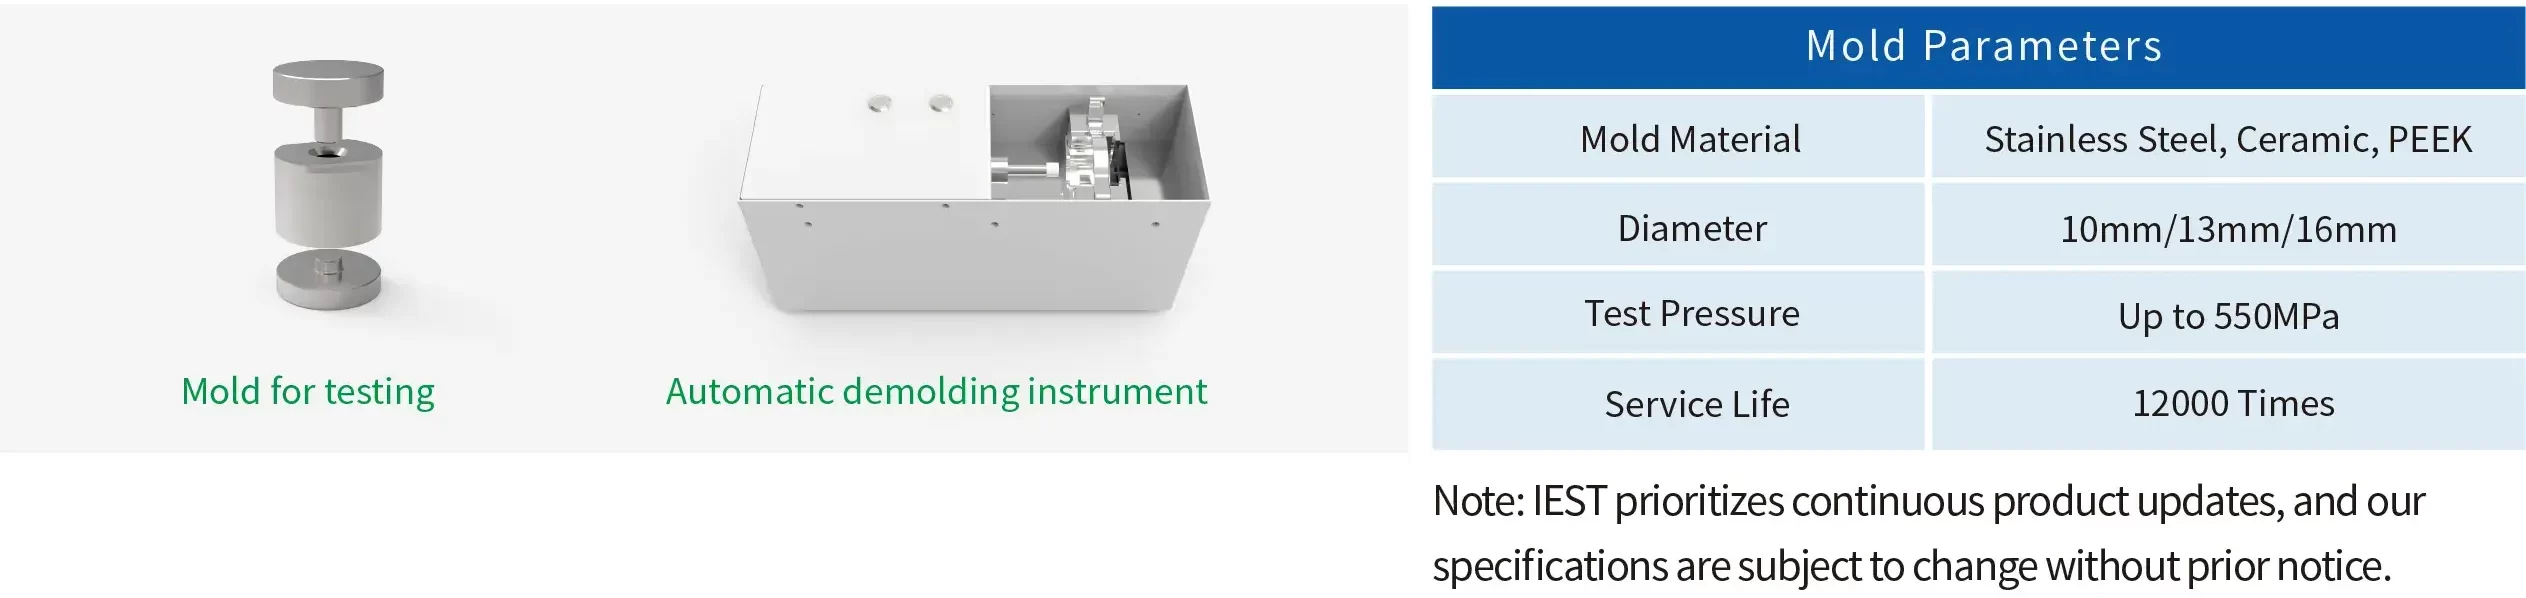
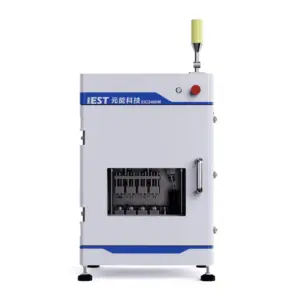
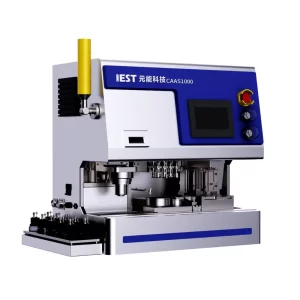
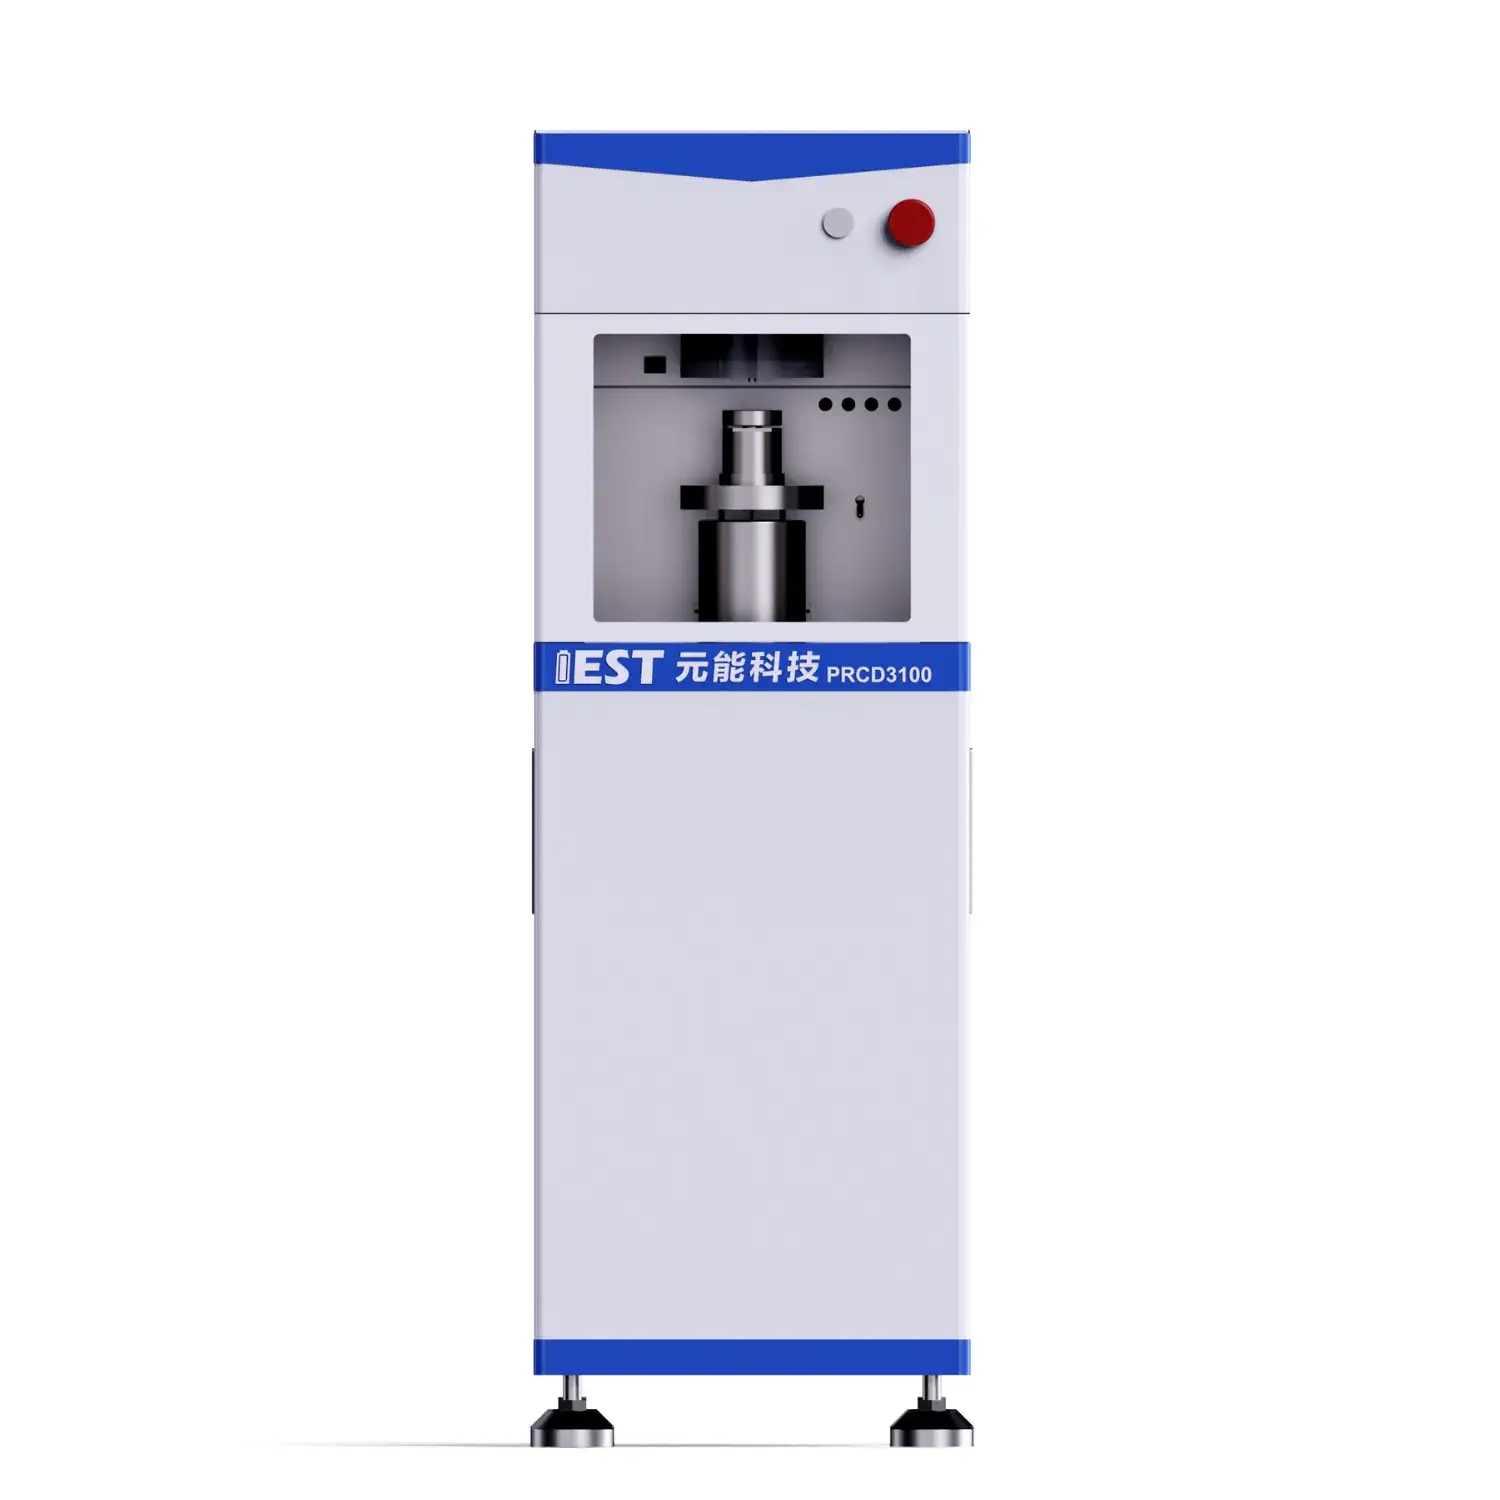
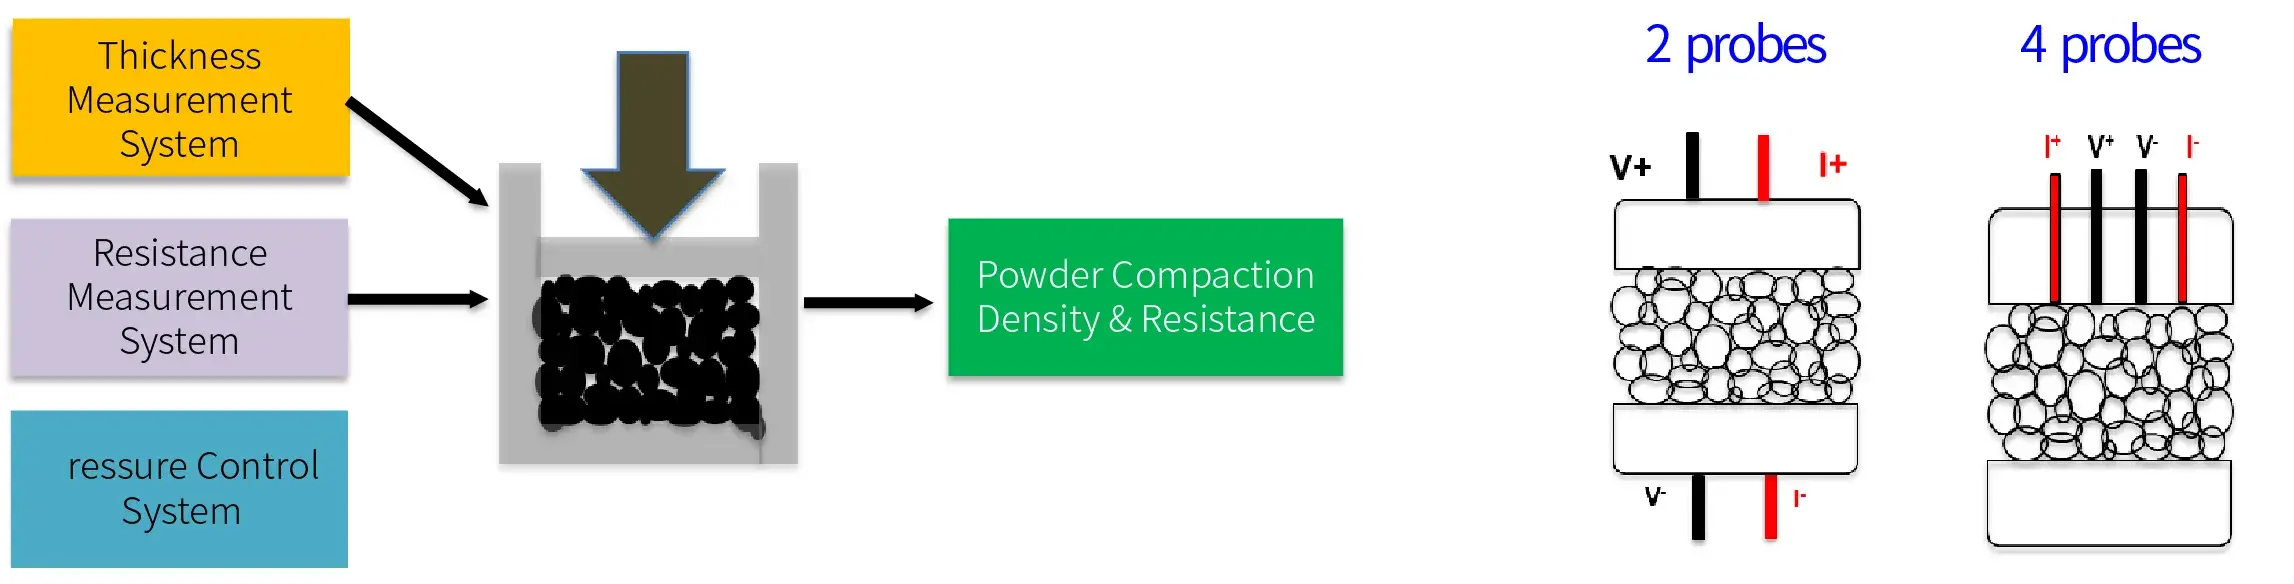
Put a certain amount of powder (1~2g) into the mold and vibrate it, put the mold into the instrument boxset the pressure (<200MPa) and the holding time, and start testing the thickness and resistance changes of the powdeiduring the compression process.
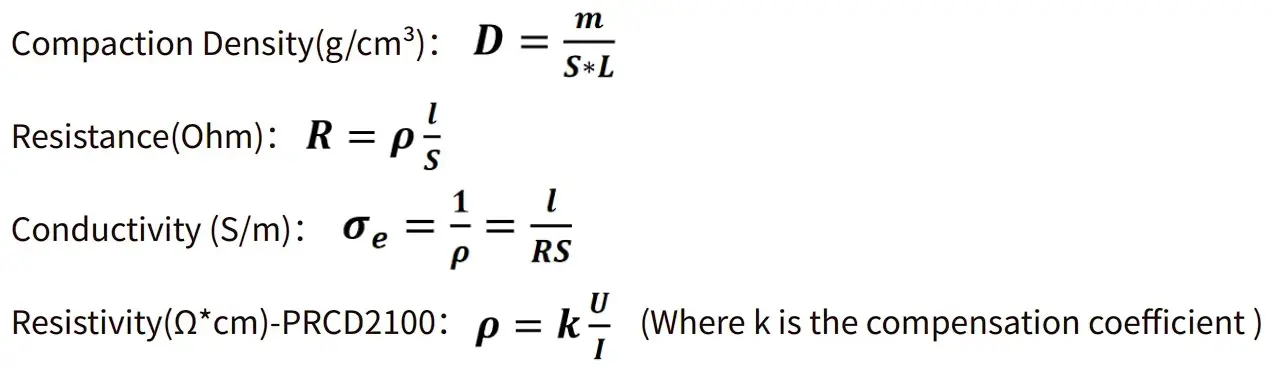
Stress, pressure, thickness, resistance, resistivity, conductivity, & compaction density.
Result Analysis
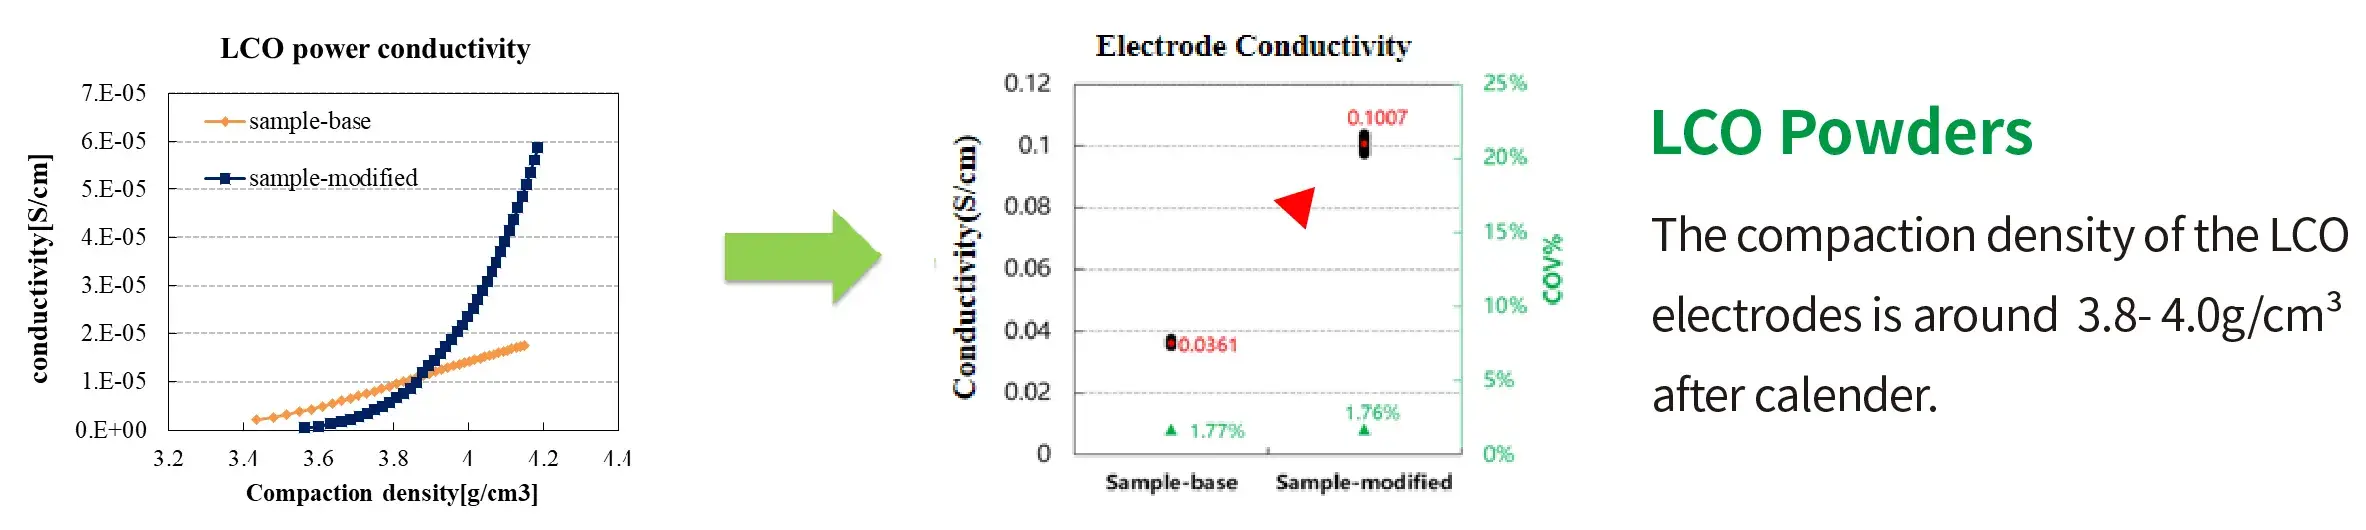
For the modified powder sample, when the compaction density is below ~3.87 g/cm³ (pressure < 75 MPa), its electrical conductivity is lower than before modification. However, when the compaction density exceeds ~3.87 g/cm³ (pressure > 75 MPa), the conductivity of the modified powder surpasses that of the unmodified sample and increases rapidly as compaction density rises, demonstrating significantly enhanced electrical conductivity performance.
When fabricated into an electrode, the compaction density typically exceeds 4.0 g/cm³. At this compaction density, the electrical conductivity trend of the powder before and after modification aligns consistently with the conductivity trend observed in the electrode.
Conclusion: During powder electrical conductivity testing, the compaction density of the powder should closely match that of the actual electrode to effectively evaluate conductivity improvements in real electrode applications. Therefore, high pressure must be applied during the testing process.
At the same pressure:
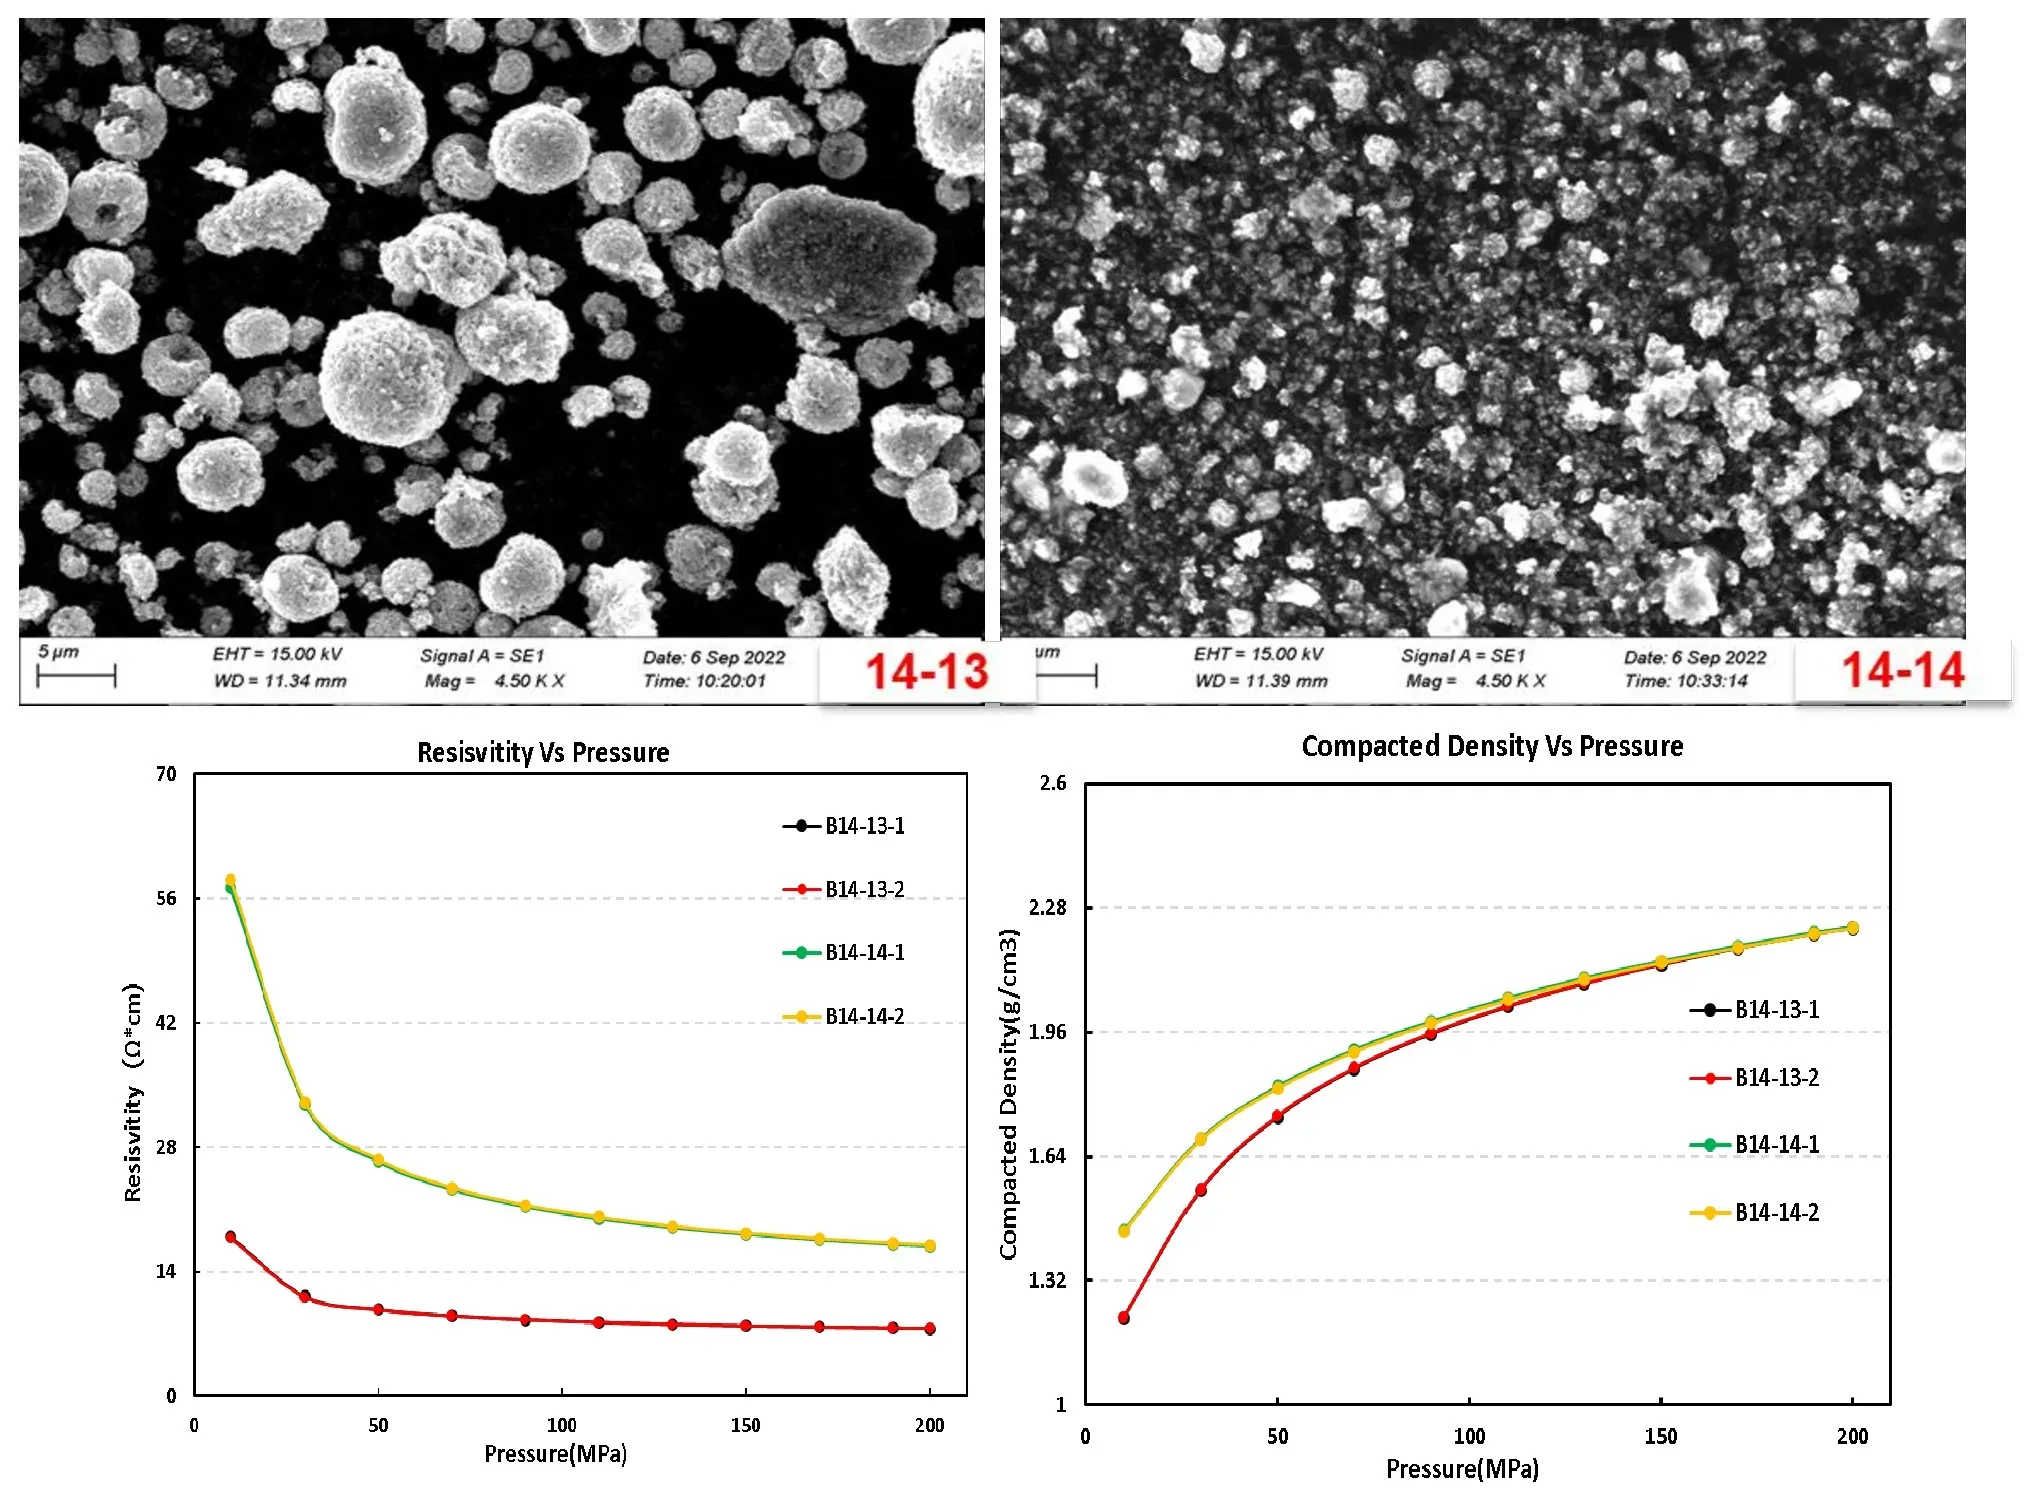
Electrical Conductivity (B14-13 > B14-14): Combined with SEM image analysis, this is primarily attributed to fine particles in B14-13 filling the voids between larger particles more effectively throughout compression. This results in lower overall porosity, superior inter-particle contact, and enhanced electrical conductivity.
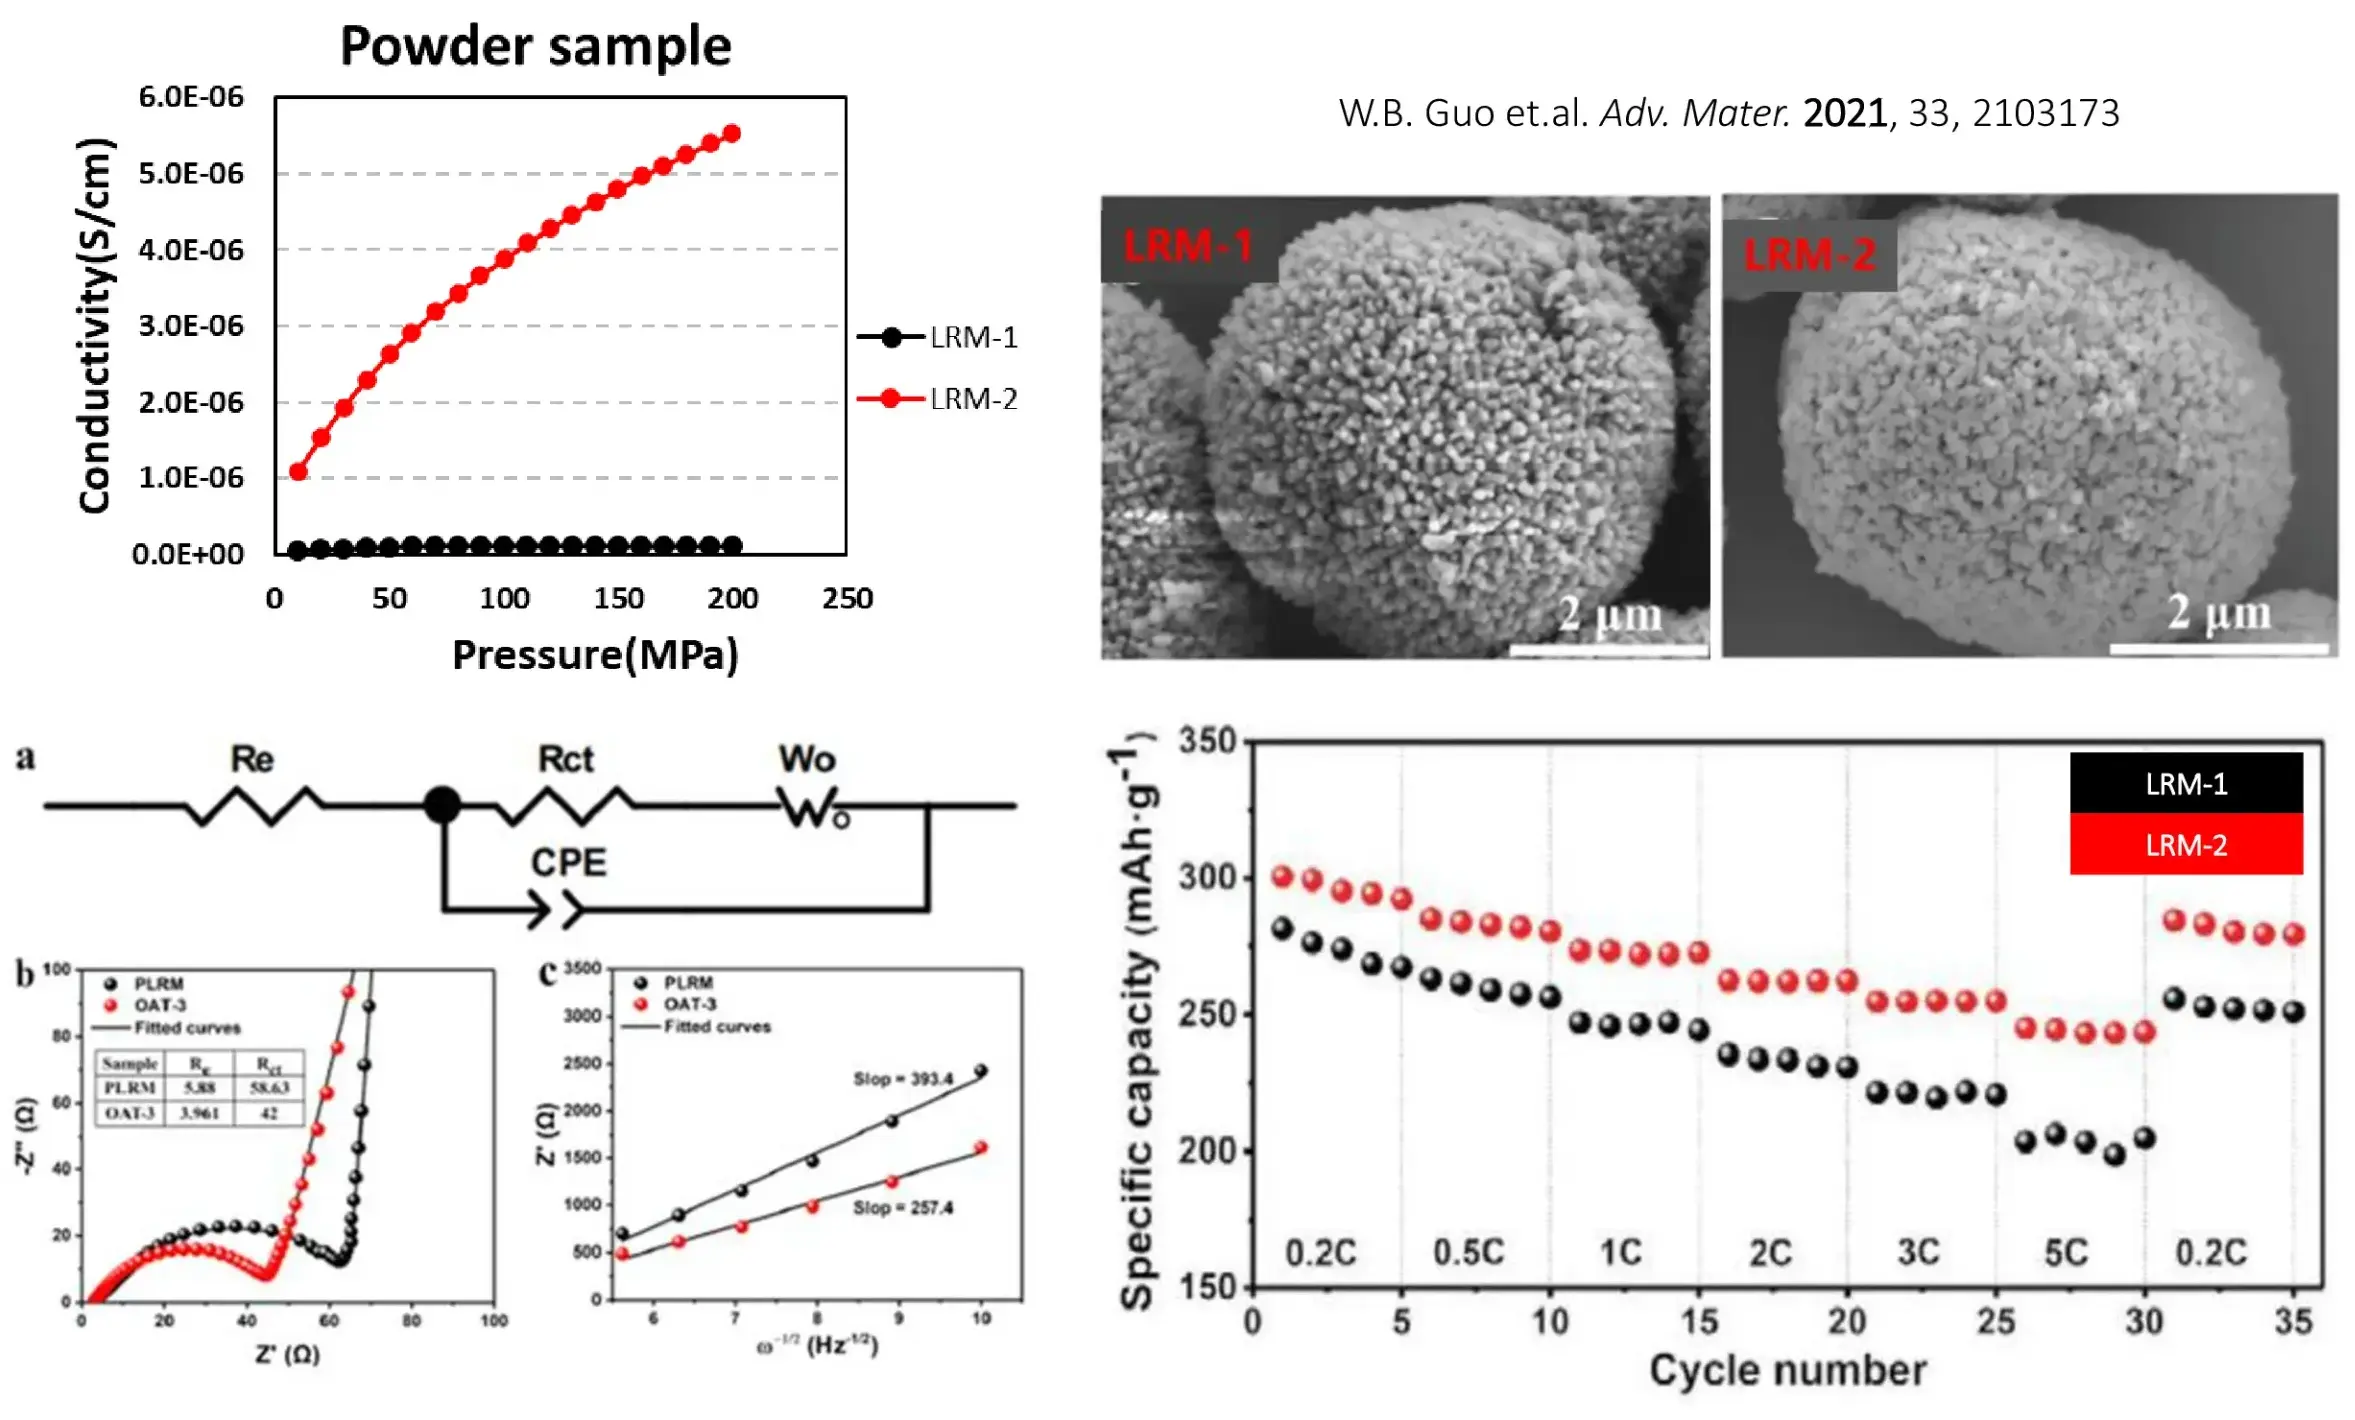
The analysis of differences in materials under different mixing ratios and modification process conditions provides a new approach and direction for material modification and differential analysis evaluation.
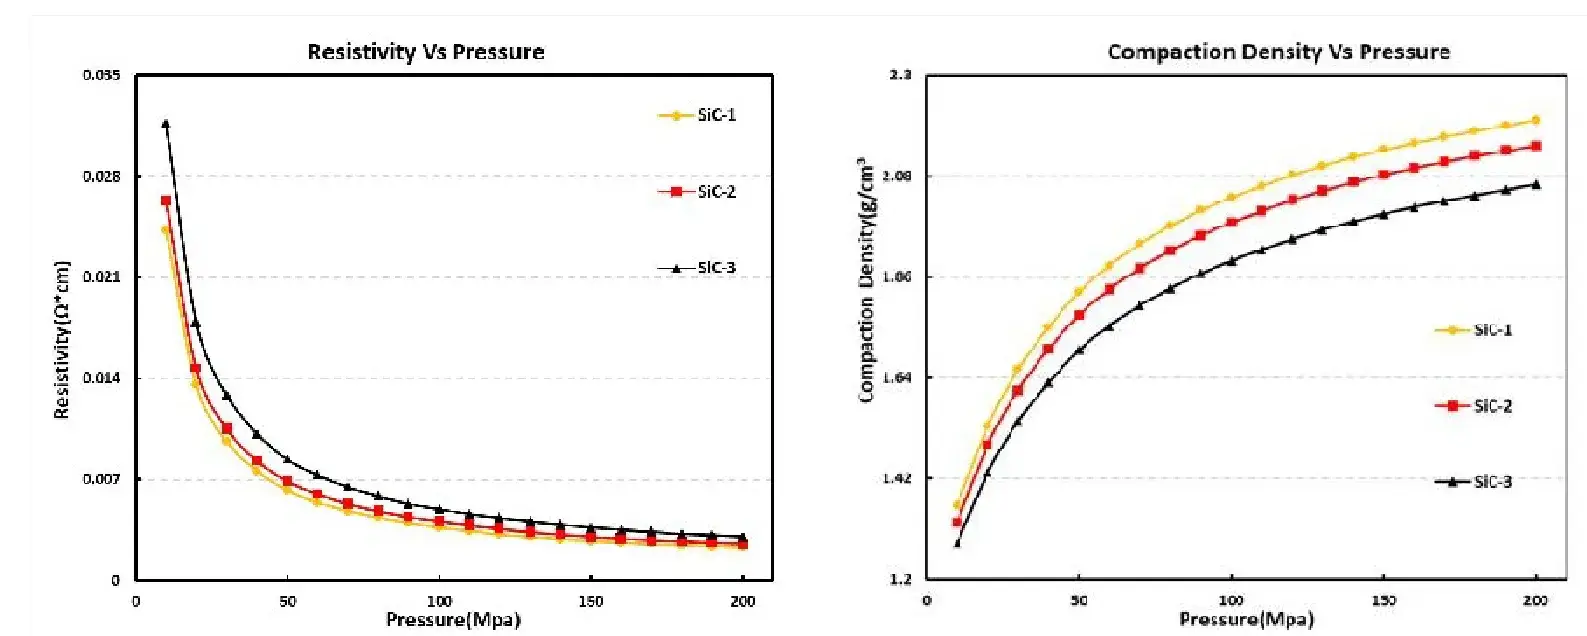
Test Condition: Si content: 3%, 6% and 10%(SiC-1/Sic-2/sic-3)
Materials: Si0-1< Si0-2<Si0-3<Si0-4
Conclusion:
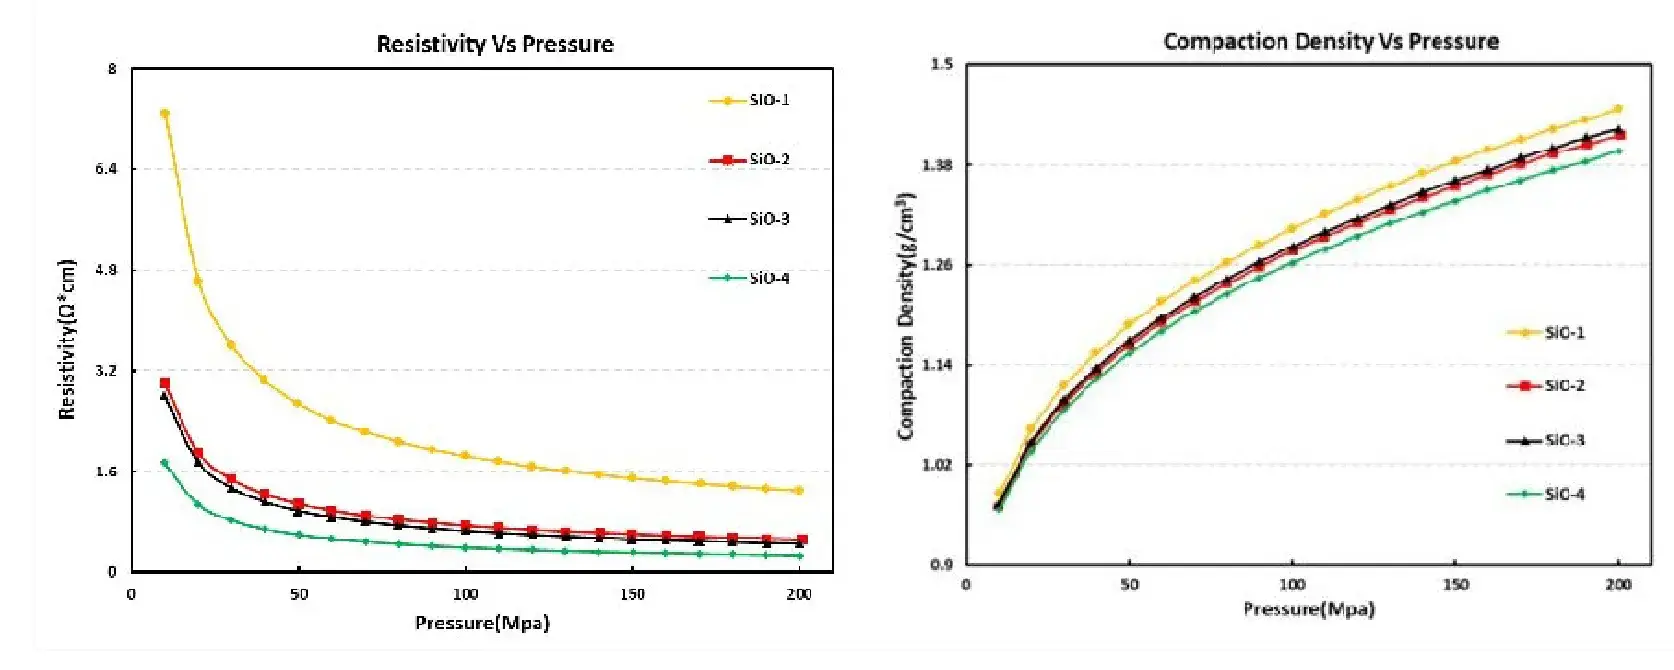
Test condition: Sintering temperature of SiO
Materials: Si0-1< Si0-2<Si0-3<Si0-4
Conclusion:
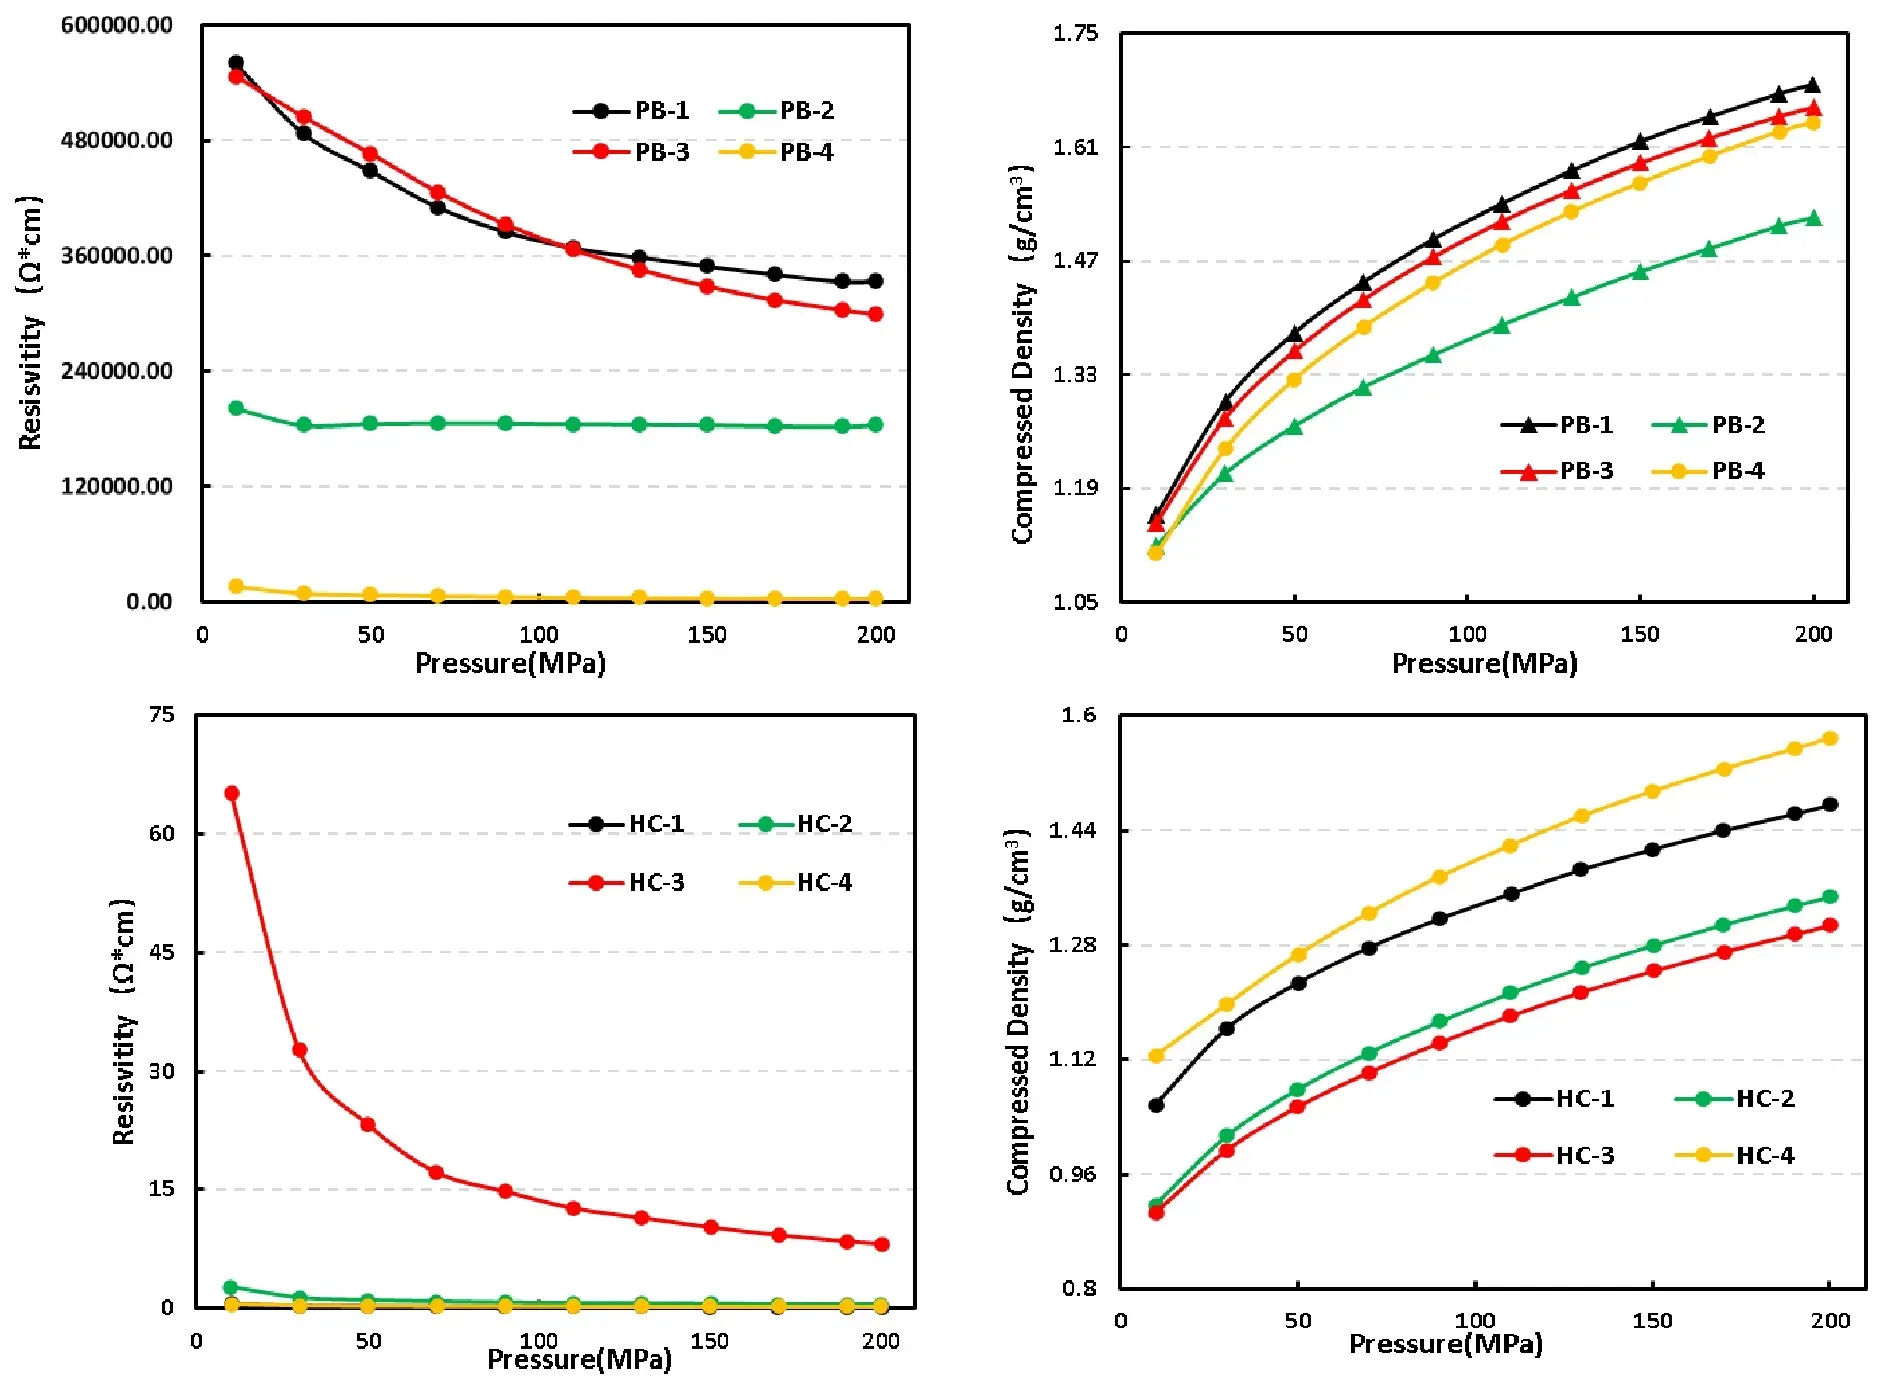
Powder Conductivity Evaluation for Sodium-Ion Cathode & Anode Materials: Effectively evaluating the electrical conductivity and compaction performance of Prussian blue and hard carbon under various modification conditions.
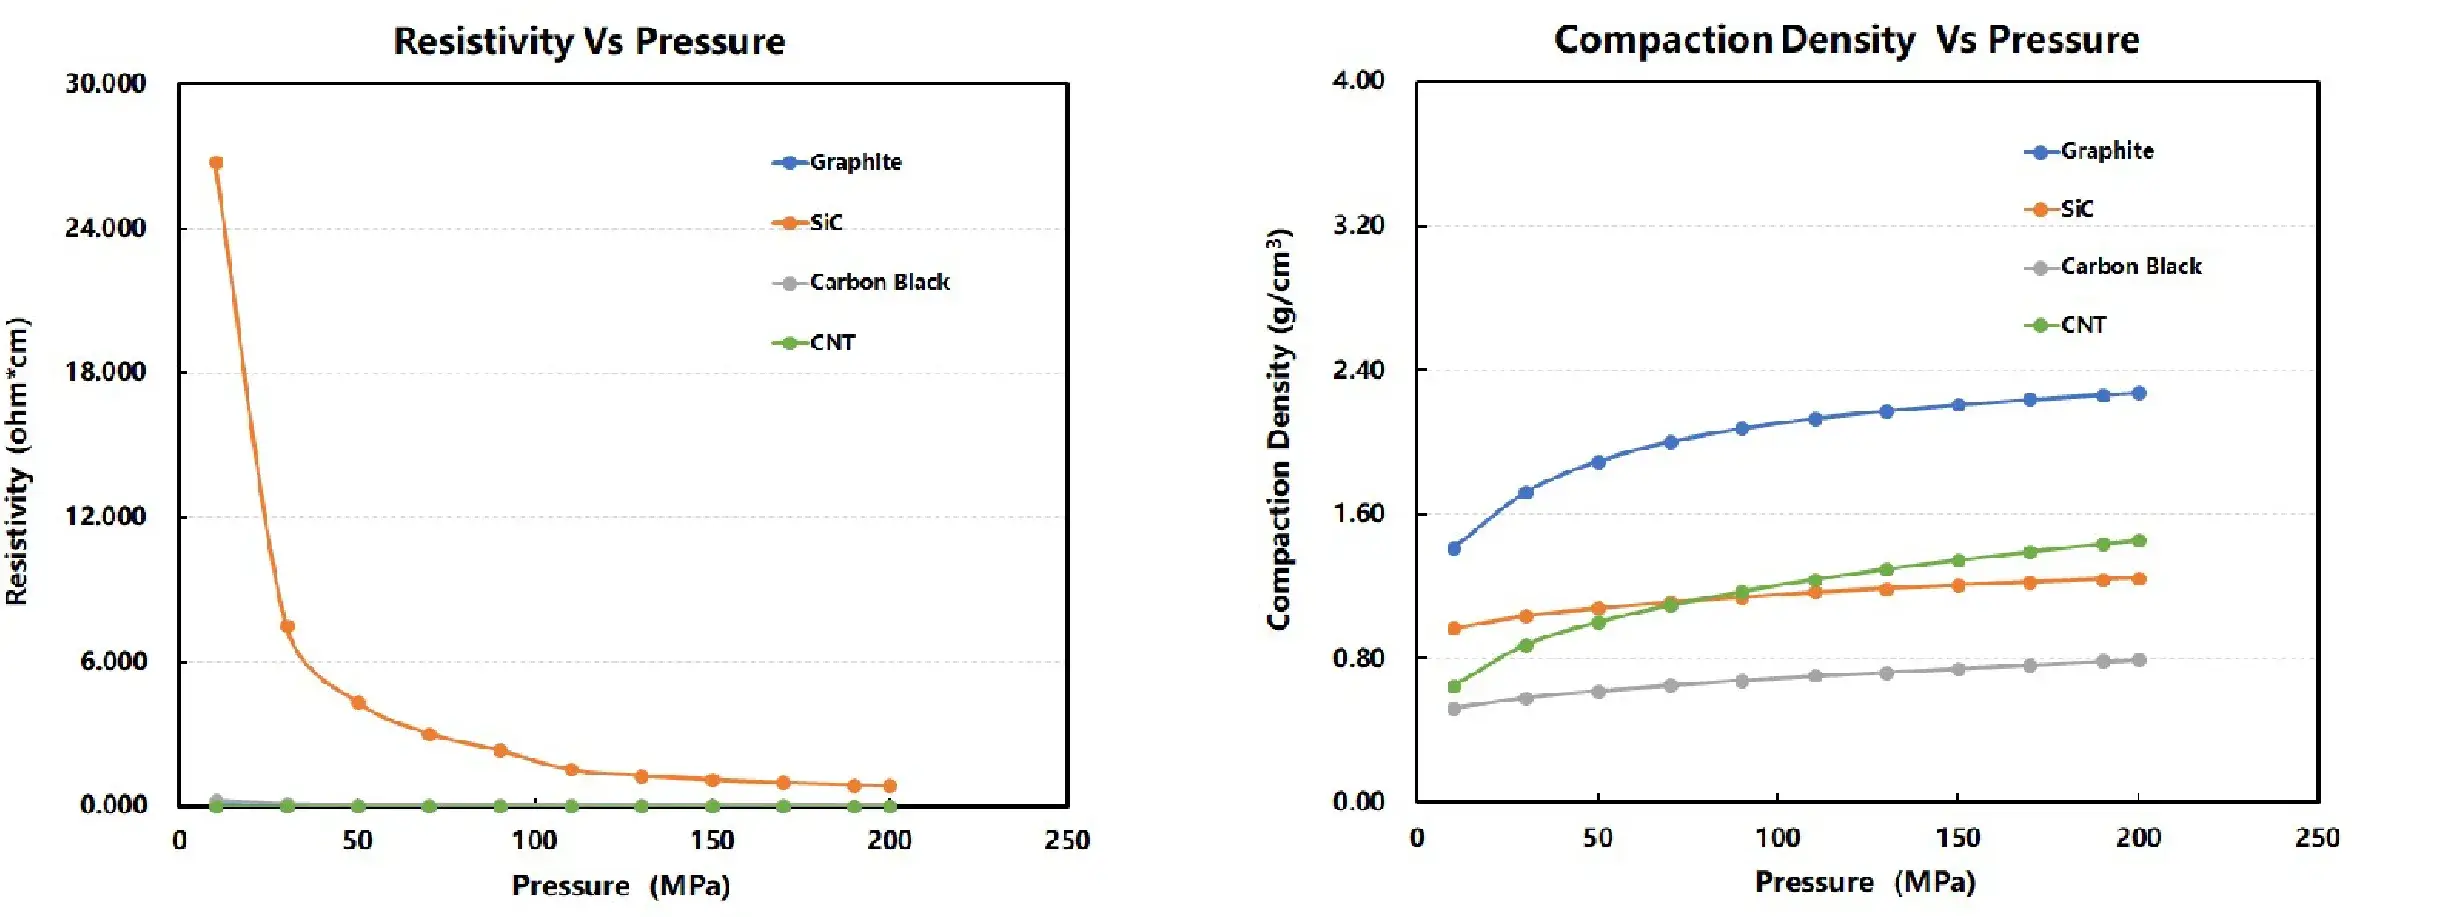
Powder Resistivity & Compaction Density of Common Anode Materials & Conductive Additives: Statistically significant differentiation exists in both powder resistivity and compaction density across various types of anode materials and conductive additives.
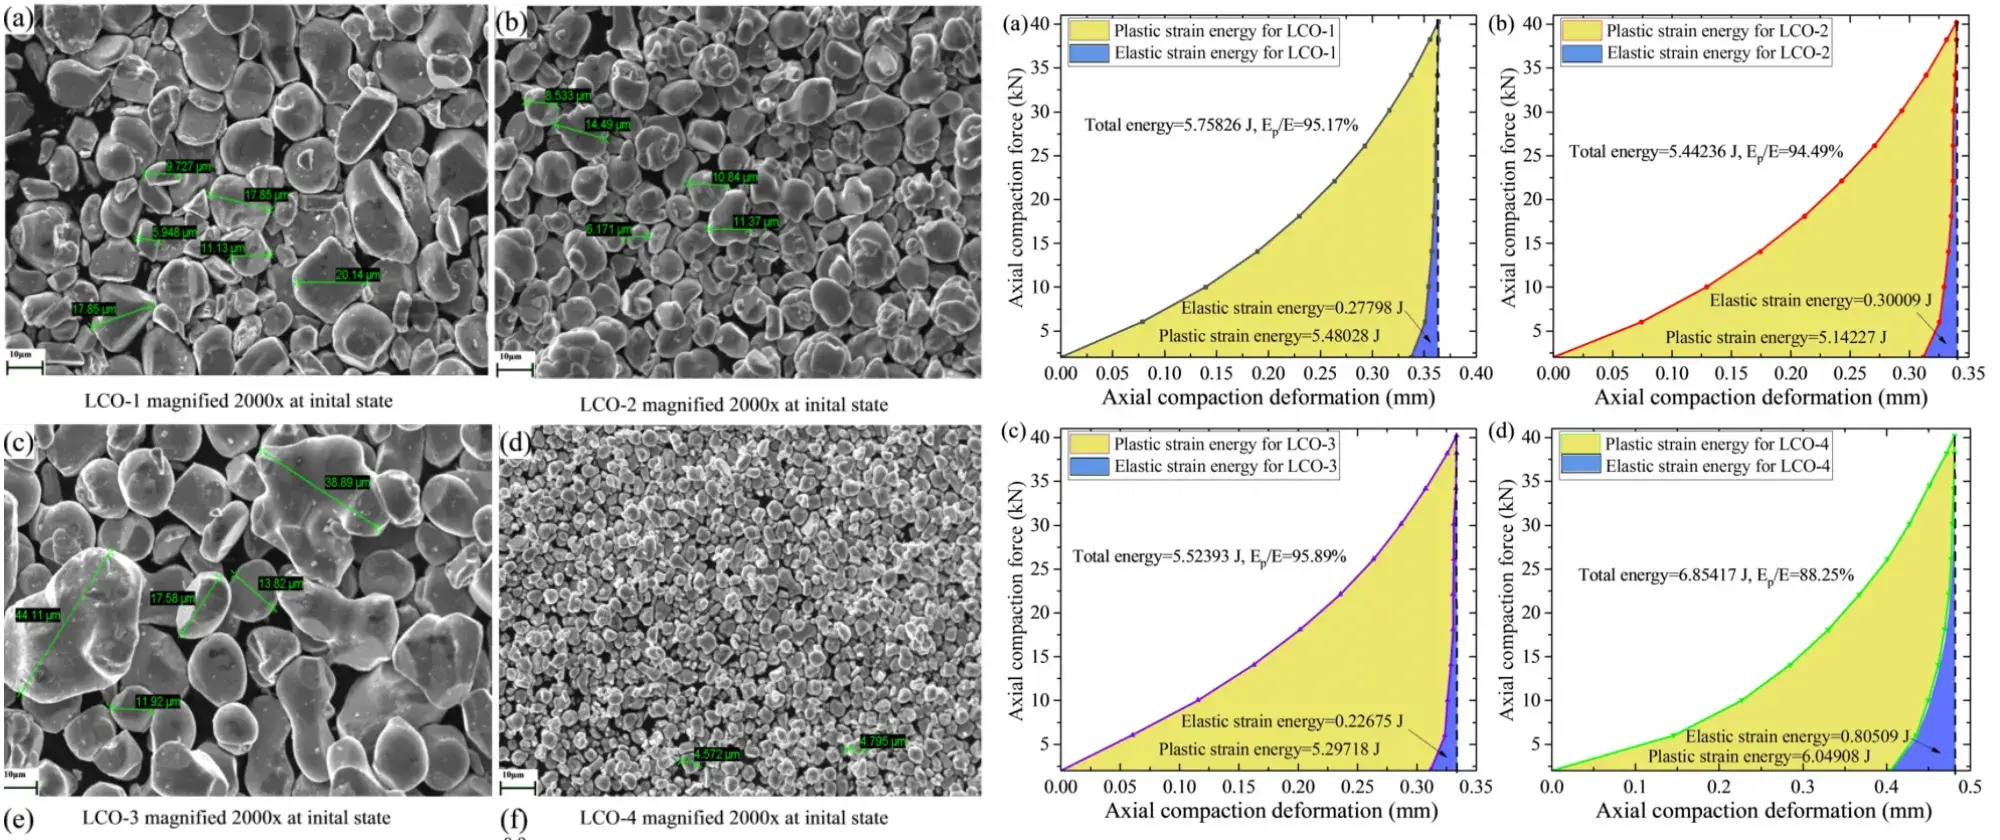
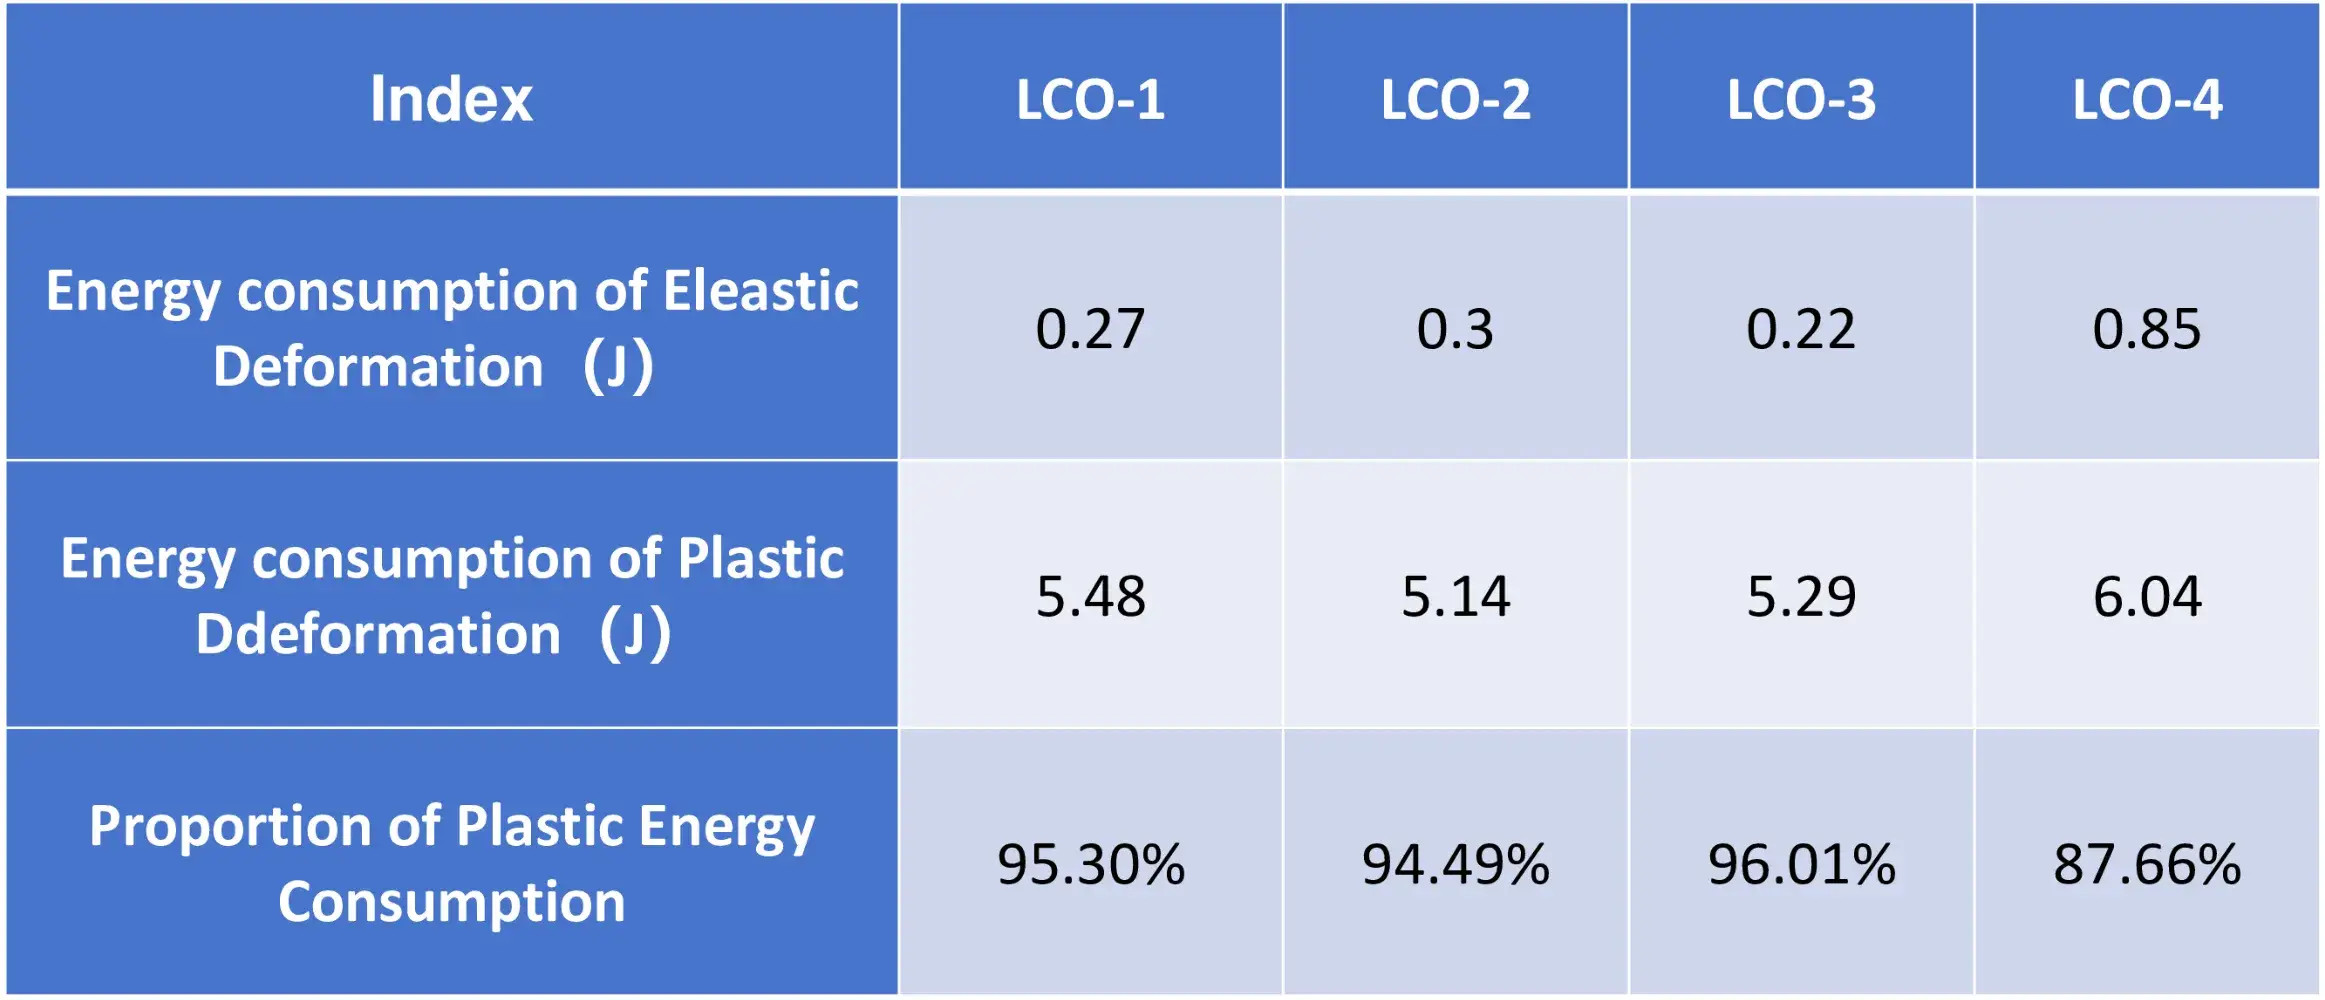
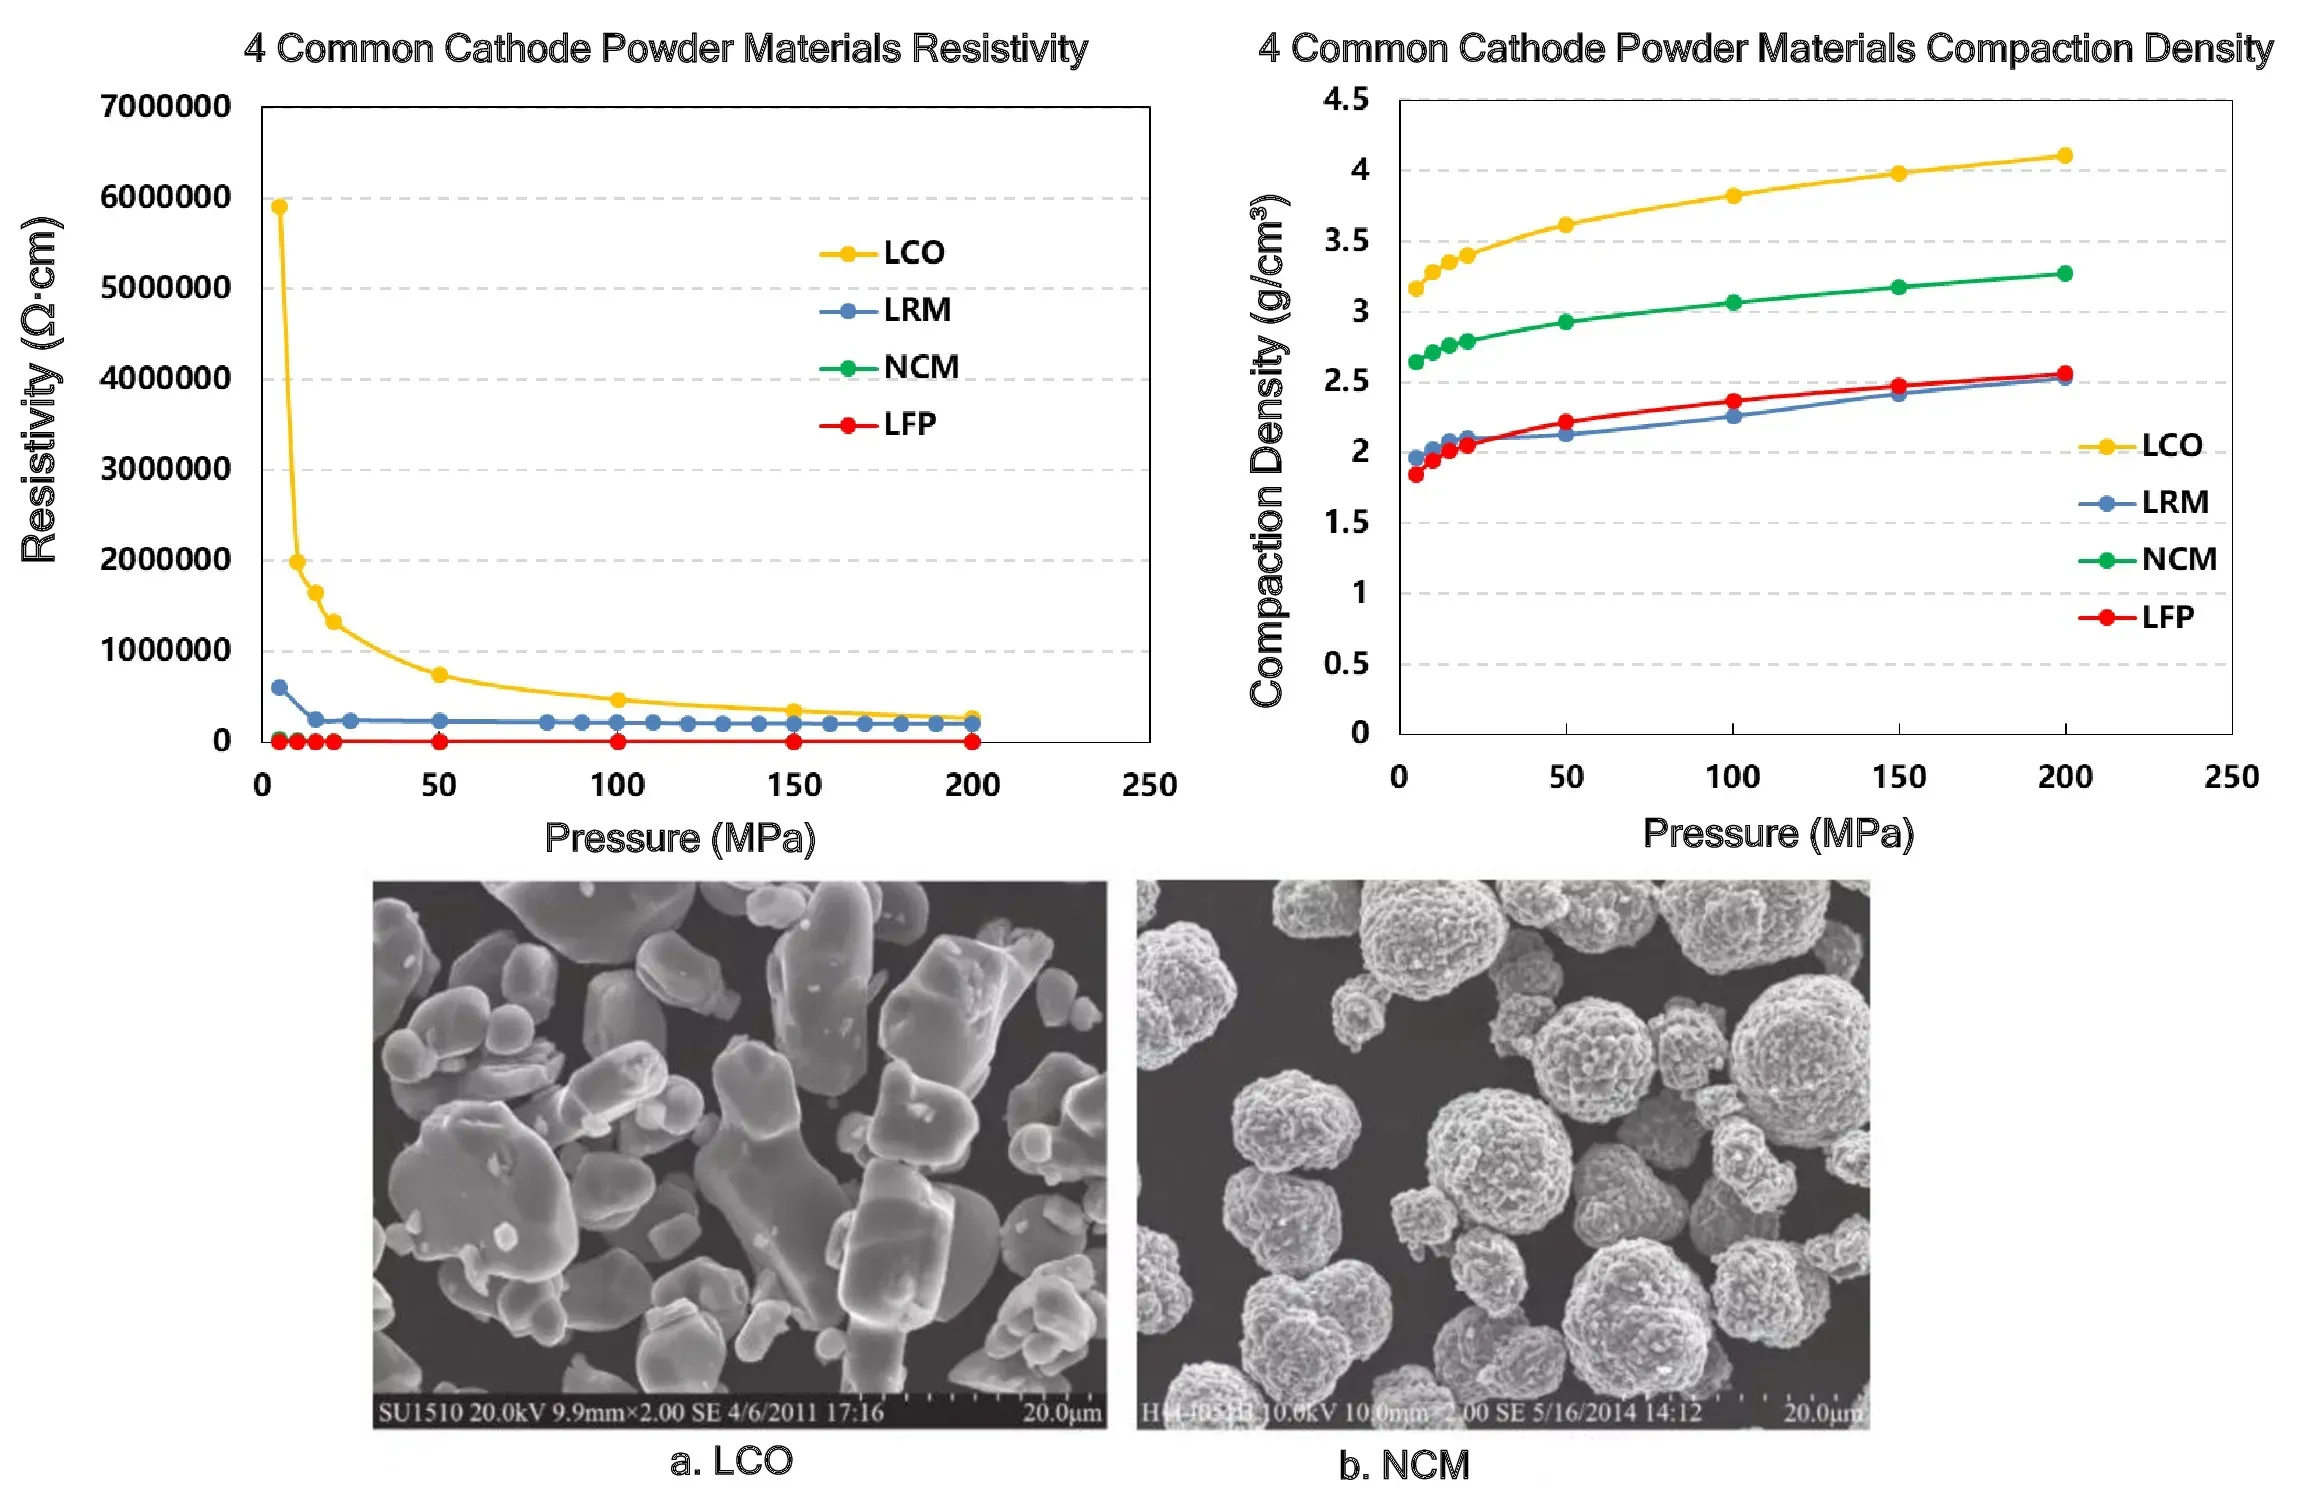
LCO Particle Size:
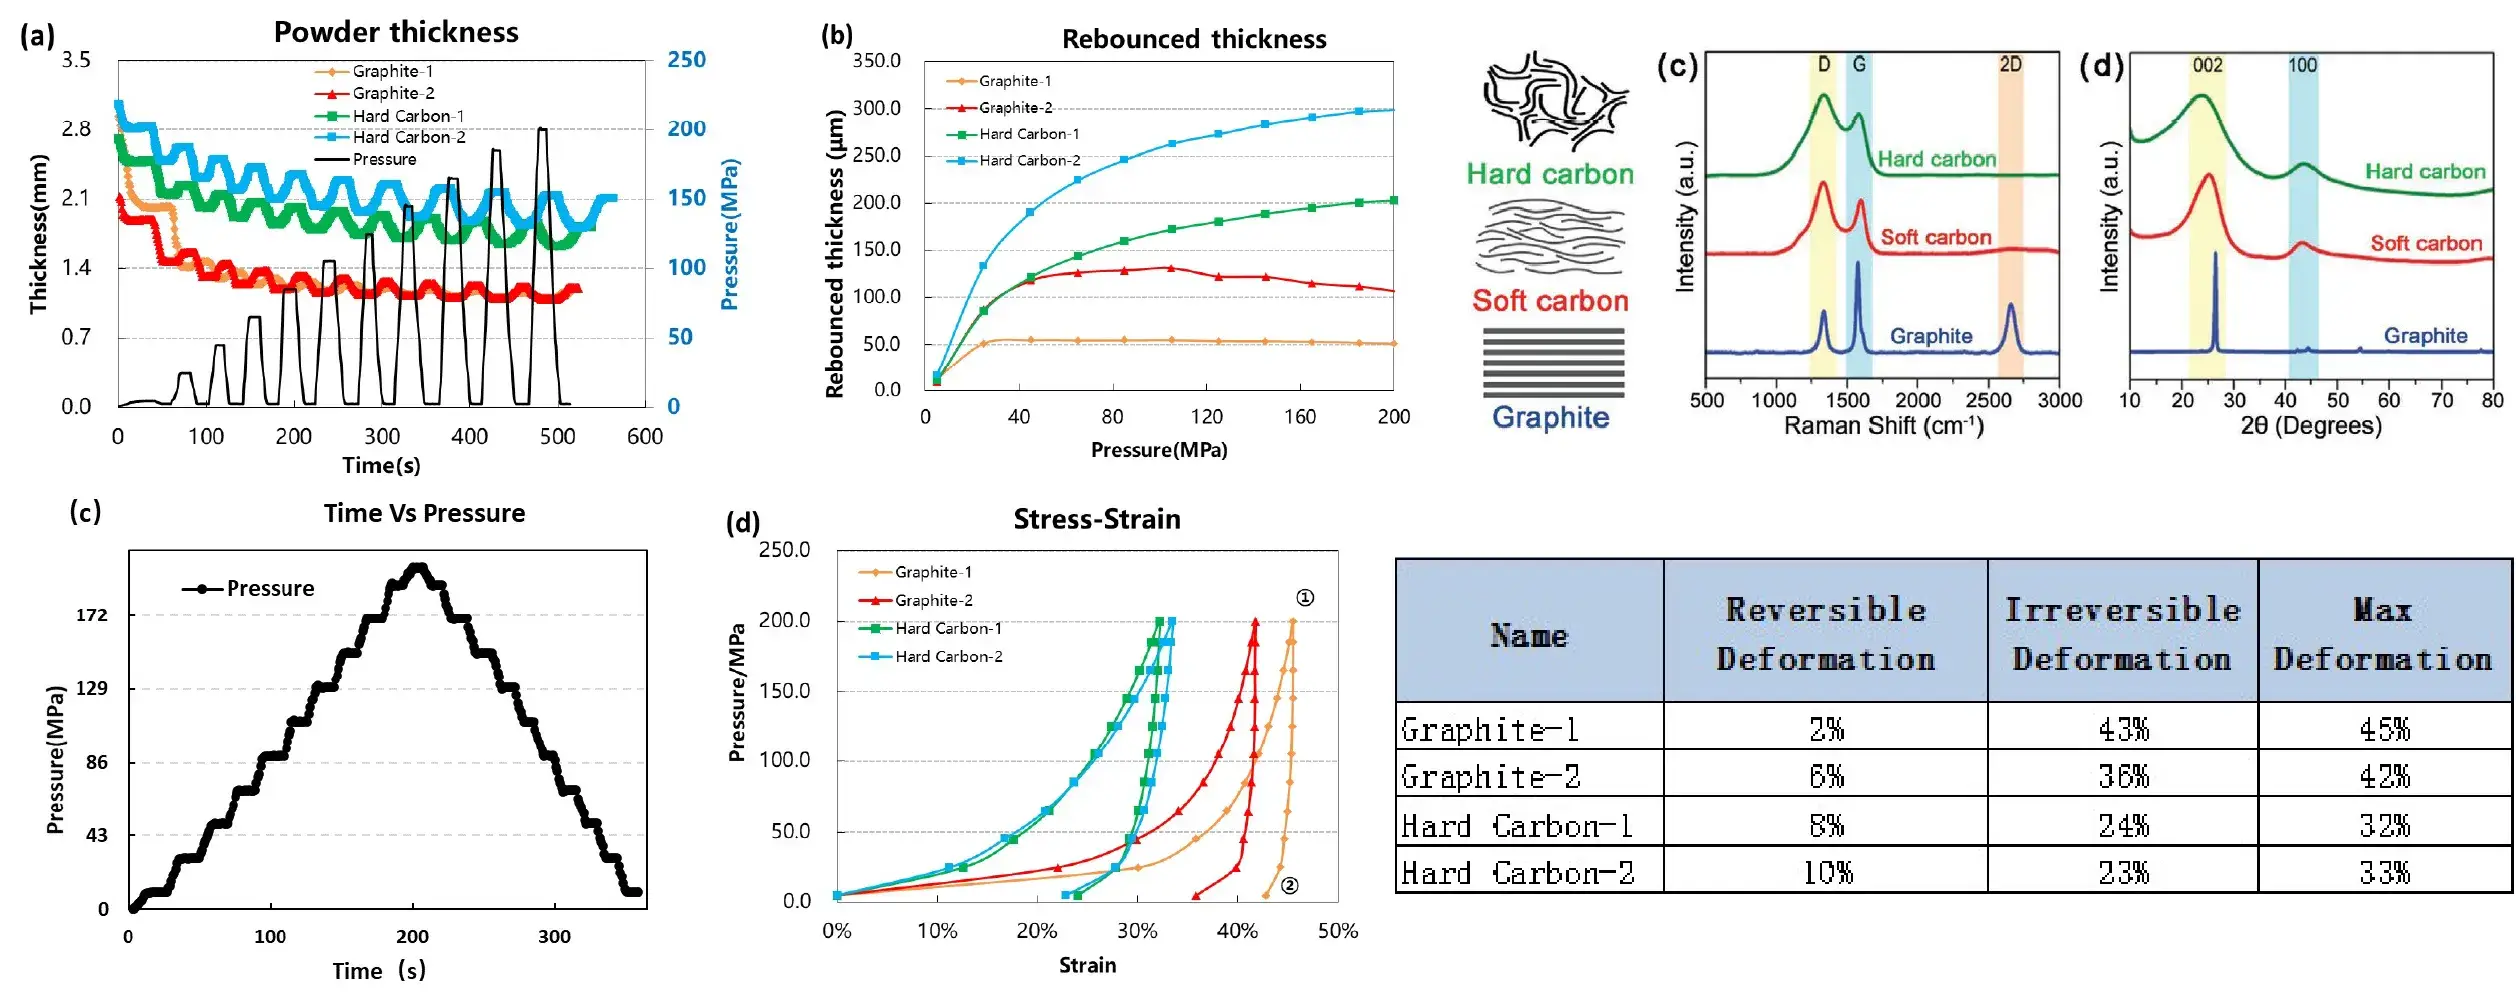
Analysis of Material Springback Intensity: Graphite exhibits greater compression displacement than hard carbon, and its compressibility at the particle level is higher than that of hard carbon, which is primarily attributed to the microstructural differences between the two materials.
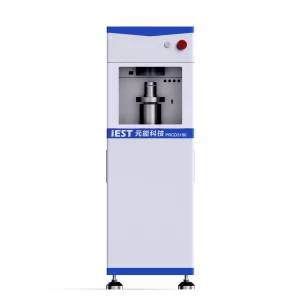
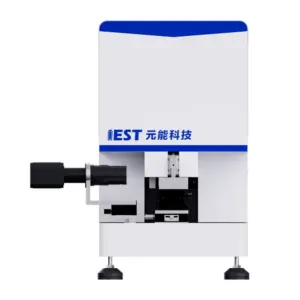
| Model | PRCD1000 | PRCD2000 | PRCD3000 | PRCD1100 | PRCD2100 | PRCD3100 |
|---|---|---|---|---|---|---|
| Stress & Pressure | Stress up to 1T & Pressure 70 MPa | Stress up to 5T & Pressure 350 MPa | ||||
| Test Principle | 2-probe | 4-probe | 2probe & 4probe | 2-probe | 4-probe | 2probe & 4probe |
| Applicable Samples | Cathode Samples | Anode Samples | Anode & Cathode Samples | Cathode Samples | Anode Samples | Anode & Cathode Samples |
| Resistance Range | 1 μΩ ~ 20MΩ | 1 μΩ ~ 1200MΩ | 1 μΩ ~ 200MΩ | |||
| Sensor Resolution & Accuracy | • Thickness Sensor: Resolution 0.5 μm, Accuracy ±10 μm • Stress Sensor: Resolution 0.1 KG, Accuracy ±0.3% F.S. • Resistance Sensor: Resolution 0.1 μΩ, Accuracy ±0.1% F.S. |
|||||
| Test Parameters | Thickness, Compaction Density · Resistance, Resistivity, Conductivity · Stress, Pressure · Temperature & Humidity | |||||
| Other Specifications |
|
|
||||
| Test Modes & Functions |
|
|||||