-
iestinstrument
Study On The Correlation Between Battery Compression Performance And SOC & SOH
1. Preface
In this paper, we adopt the in-situ swelling analysis system(SWE Series) of IEST to monitor the pressure and thickness deformation of the battery by correlating the SOC and SOH parameters of a single battery, and evaluate the compression performance of the battery by correlation, so as to provide a feasible method for the study of the mechanical properties of lithium-ion batteries in different states. The compression performance indexes measured by this method can also be used as effective theoretical support data for battery simulation.
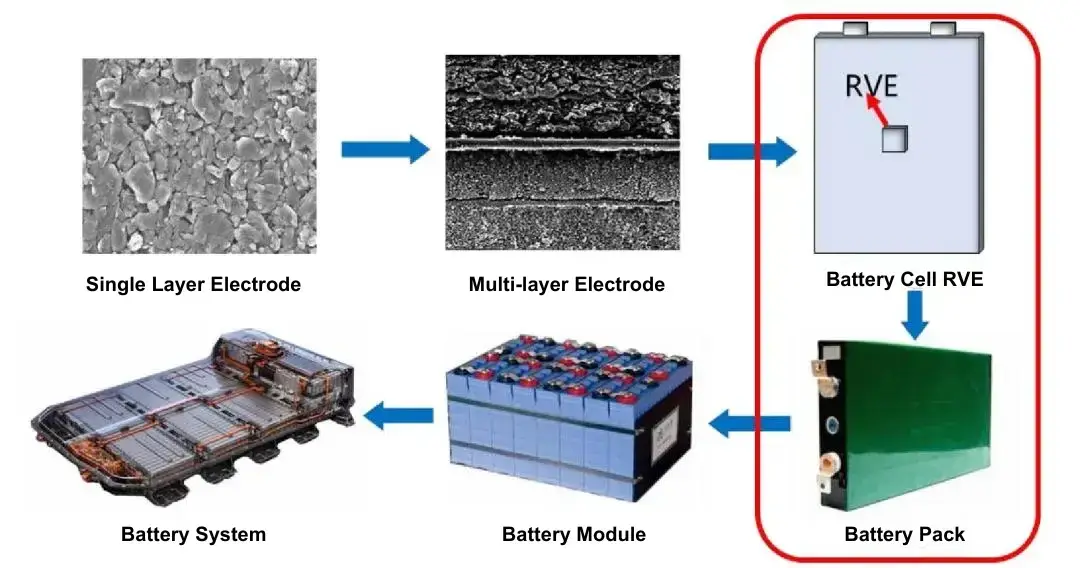
Mechanical properties of lithium-ion battery test is an important means to study its mechanical properties, the research content is also usually around multiple scales to realize, mainly combined with the micro-scale, mesoscopic scale, macroscopic monomer scale and macro-system scale hierarchical route. Figure 1 is a schematic diagram of multiple scales of lithium-ion batteries, and each scale is relatively independent and directly affects each other. From the lithium-ion battery monomer scale, it is mainly composed of cathode and anode plates, diaphragm, electrolyte, and aluminum-plastic film or steel shell, etc. Sealed complex body. Each component has different mechanical and mechanical properties, and the state of its internal components is constantly changing with the charging and discharging cycles and aging.

Figure 1. Multiple research scales of lithium-ion batteries
2. Experimental equipment and test methods
2.1 Experimental equipment
In-situ Swelling Analyzer, Model SWE2110 (IEST), as shown in the following picture:
Figure 2. Appearance of SWE2110 equipment
2.2 Test information and process:
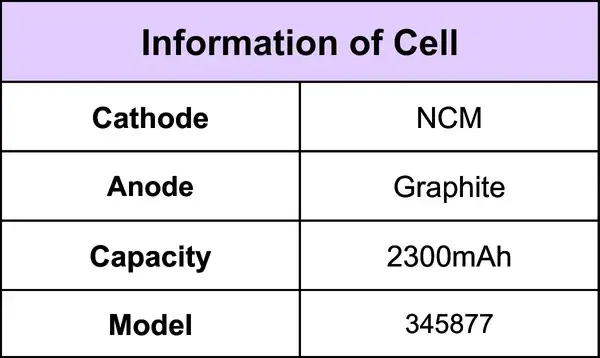
2.2.1 Battery information is shown in Table 1.
Table 1. Test Battery Battery Information

2.2.2 Charging and discharging process

2.2.3 Experimental process
Battery compression modulus test: put the battery to be tested into the corresponding channel of SWE2110, open the MISS software, set the pressure regulation process, sampling frequency, charging and discharging process, etc., and the software automatically reads the battery thickness, the amount of thickness change, the test temperature, the current, the voltage, the capacity and other data.
3. Experimental Results and Analysis
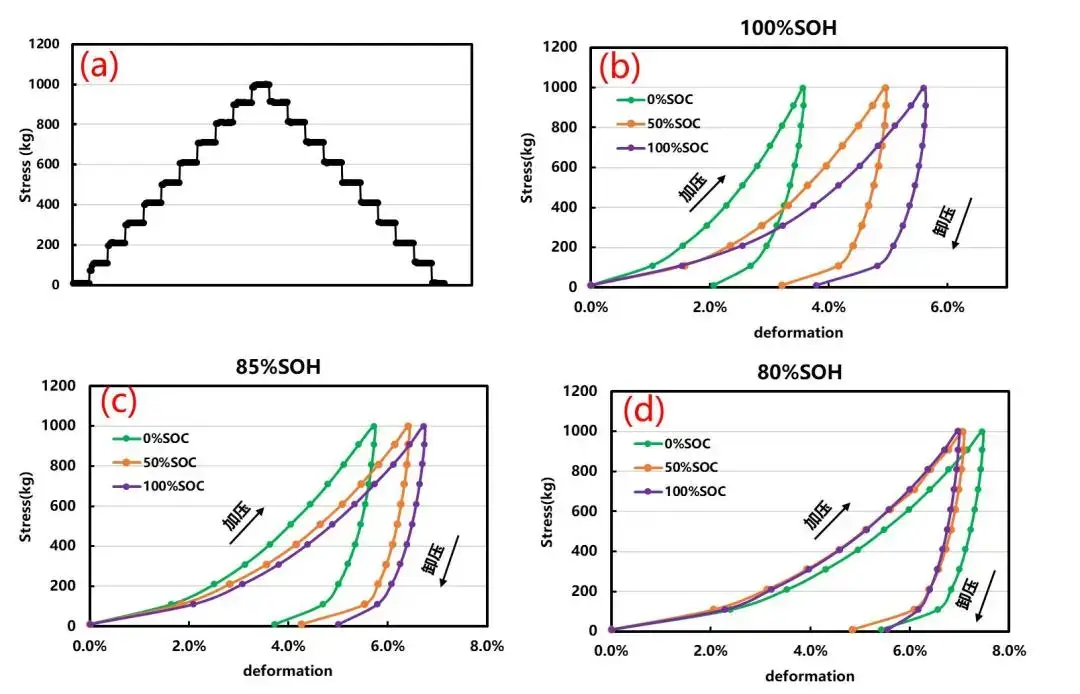
The in-situ swelling analyzer (SWE2110) was turned on in the compression experiment (steady state) mode, and the pressure adjustment was set as shown in Figure 3(a): the initial pressure was 10kg, pressurization step was 100kg, and each pressure was held for 10S until 1000kg, and then unpressurization was performed, and unpressurization step was 100kg, and each pressure was held for 10S until 10kg to complete the experiment.
Three fresh batteries were selected, different SOC states (0%, 50%, 100%) were adjusted, and the steady state compression experiments were performed on the three batteries by adjusting the pressure according to Fig. 3(a), respectively. The results are shown in Fig. 3(b): in the pressurized stage, the thickness of the battery is continuously compressed with increasing pressure; in the unpressurized stage, the thickness of the battery is continuously rebounded with decreasing pressure. It is also found that the degree of compression is not the same in different states of the battery, and the battery is shown to be more easily compressed as the SOC increases, which may be related to the inconsistent performance and inhomogeneity of the positive and negative active materials in different de-embedded lithium states. Changes also occur within the battery electrode under different SOC. For example, for graphite electrodes, the graphite lattice expands by 10% along the c-axis as different amounts of lithium are embedded, while graphite tends to line up parallel to the collector, and thus graphite electrodes expand and contract mainly in the early thickness direction. This volume change in turn causes the microscopic particles and pores to slightly deform and reorder each other during (de)lithiation, which affects the ion and electron transport, resulting in inhomogeneity of SOC and volume change in the thickness direction, and may even result in the contraction of the top electrodes and the expansion of the bottom electrodes on the electrode surface. In addition, the elastic modulus, Poisson’s ratio and density of the materials of graphite and LCO materials change under different conditions of lithium embedded, which leads to different mechanical properties.
Meanwhile, the battery was subjected to a large magnification charge/discharge cycle, and the battery health state was set to 85% SOH when the battery capacity was reduced to 85% of the initial capacity, and the battery health state was set to 80% SOH when the capacity was 80%.Comparison of Fig. 3(b) (c) (d) reveals that there is a difference in compression degree of the different SOC batteries under different SOH conditions. This indicates that the compression modulus of the cell is not only related to the SOC, but also related to the SOH condition of the cell. And with the aging of the battery (this experiment is to increase the charging and discharging rate aging), the influence factor of SOC has a tendency to gradually weaken. During cyclic aging of the battery, the battery performance continues to degrade due to various mechanical and chemical processes, and the battery cell degradation mechanisms include collector corrosion, morphology change of active materials, electrolyte decomposition, solid electrolyte interface (SEI) layer formation, and material dissolution. In addition, chemical degradation can be accelerated by mechanical damage to the cell, such as during this intercalation process, where volume changes induce considerable stresses inside the particles, leading to mechanical failures such as crushing or cracking and fracturing of the active material. These cracks create new surfaces on the particles, which are then exposed to the electrolyte, leading to the formation of additional SEI layers as well as capacity decay. These decay conditions likewise affect the expansion and contraction processes of the electrodes.

Figure 3.(a) Voltage regulation mode (b) (c) (d) Cell compression modulus curves at different SOHs
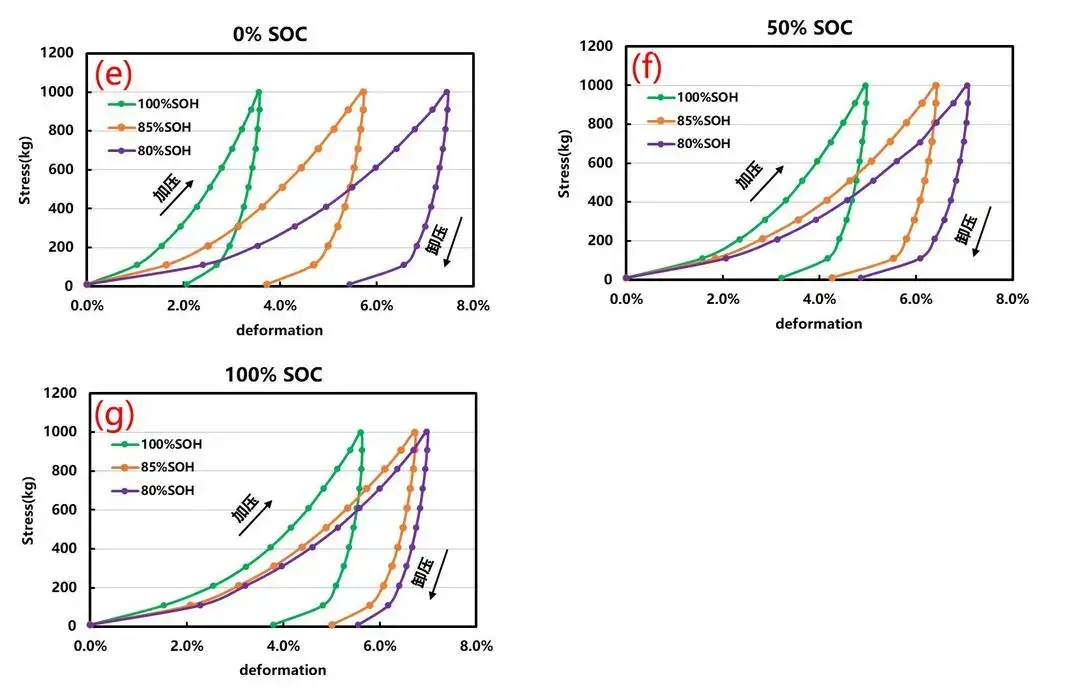
Further, the compression performance of the cells at different SOH was compared at the same SOC state. The correlation between the compression modulus and SOH of the battery is shown in Fig. 4: as the SOH decreases the maximum deformation increases, the compression modulus decreases, and the irreversible deformation also increases, as shown in Table 2. This may be related to the rapid lithiation/de-lithiation of the positive and negative active materials when the battery is aging at a large multiplication rate, which not only causes structural changes, fragmentation, and dissolution of the active materials, but also accompanied by a variety of side reactions, resulting in the growth of the SEI film, lithium precipitation from the negative electrode, and gas production from the battery, and so on. Active material fragmentation, SEI film growth and lithium precipitation increase the irreversible deformation of the battery, and due to the SEI film and lithium dendrites compression modulus is much smaller than that of the cathode and anode sheet, which makes the maximum compression deformation of the battery after aging increased significantly. In addition, the side reaction gas production will also change the contact tightness of the cathode and anode sheet, thus affecting the compression performance of the battery. In conclusion, the compression modulus of the battery is closely related to the SOH of the battery.

Figure 4. Cell irreversible thickness variation curve
Table 2. Summary of battery compression performance

4. Summary
In this paper, the correlation between the compression performance of ternary/graphite system battery and SOC and SOH is analyzed by using the in-situ swelling analyzer (SWE) of IEST, and the experiments show that the compression performance of the battery is not static and unchanging, but varies with the SOC, SOH and other factors. The corresponding correlation can be used for related technicians to design more reliable products, provide more realistic data for simulation technicians, and improve the simulation effect.
5. References
[1] Yang Boda. Research on Mechanical Properties of Lithium-ion Power Battery for Electric Vehicles[D]. Hunan University
[2] Zhang J, Huang H, Sun J. Investigation on mechanical and microstructural evolution of lithium-ion battery electrode during the calendering process[J]. Powder Technology, 2022, 409: 117828.
Subscribe Us
Contact Us
If you are interested in our products and want to know more details, please leave a message here, we will reply you as soon as we can.


