-
iestinstrument
Li Plating and Swelling For Rapid Prediction of Battery Life Decay
1. Background
Due to its advantages such as high energy density, relatively long lifespan, and environmental friendliness, the application of lithium-ion batteries has covered multiple fields including consumer electronics, electric vehicles, and energy storage systems. When the potential of the negative electrode approaches or falls below the deposition potential of metallic lithium, lithium ions may precipitate on the surface of the negative electrode in the form of metallic lithium. The continuous growth of precipitated lithium metal can lead to the formation of lithium dendrites, which in turn may induce internal short circuits, posing safety risks. Additionally, the precipitated lithium metal may react slowly with the electrolyte, significantly reducing the onset temperature of thermal runaway [1,2]. Among the various lithium ion degradation mechanisms, Li Plating is considered one of the most detrimental factors. This is because the occurrence of Li plating not only accelerates battery aging but also poses safety hazards during later stages of usage. The phenomenon of Li plating is primarily related to the materials and design of the battery cell, including the negative electrode material, the ratio of negative to positive electrode capacity, electrolyte formulation, etc.
When the cathode electrode material possesses a higher reversible equilibrium potential (relative to the Li Plating potential), Li plating reactions are less likely to occur. Regarding the ratio of negative to positive electrode capacity, lithium-ion batteries are typically designed with an excess of negative electrode capacity to avoid depleting the lithium-ion-insertable capacity in the negative electrode, thereby reducing negative electrode overpotential. Insufficient negative electrode material would result in insufficient space for lithium ions to deintercalate from the positive electrode, leading to Li plating. However, an excess of negative electrode material would reduce the battery’s energy density and power density, leading to material waste and increased costs. The composition of the electrolyte has a more pronounced effect on Li plating in lithium-ion batteries because it directly influences the kinetic properties of lithium ions, thereby impacting the rate of lithium intercalation in the negative electrode to some extent. Li plating phenomena, in addition to being associated with the materials and design of the battery cell, typically occur more readily in low-temperature environments, high state of charge (SOC), high-rate charging conditions, and aged batteries.
Regardless of whether it is in low-temperature conditions, high state of charge, high-rate charging conditions, or in aged batteries accompanied by the continuous thickening of the passivation film on the negative electrode surface, the fundamental reason is that the rate of lithium-ion accumulation on the negative electrode surface is faster than the rate of lithium-ion diffusion into the graphite interior. This results in high polarization of the negative electrode, known as unfavorable electrode kinetics, forcing the potential of the battery’s negative electrode (usually graphite) to be lower than the equilibrium potential of lithium/lithium ions, leading to Li plating. Conducting Li plating tests on lithium-ion batteries based on actual usage conditions and operational parameters requires a long time and cannot meet the demands of product development. Therefore, research on accelerated Li plating testing for lithium-ion batteries has become extremely important and urgent.
Existing non-destructive online detection technologies for Li plating [3] can be categorized into four types: (1) Detection methods based on lithium-induced cell aging, such as the Arrhenius curve method and Coulombic efficiency method; (2) Detection methods based on impedance changes induced by lithium, (3) Detection methods based on electrochemical reactions induced by lithium, such as low-current discharge method, voltage relaxation method, electrochemical impedance spectroscopy (EIS) method, nonlinear frequency response analysis method, and relaxation time distribution method; (4) Detection methods based on changes in physical properties induced by lithium in the battery. The deposition of lithium metal layer on the negative electrode during Li plating reactions leads to changes in electrode morphology and microstructure. In situ physical methods can not only detect the growth of lithium metal layer but also obtain the distribution of lithium deposition at different locations. Physical property detection methods include thickness measurement, acoustic detection, etc. Regardless of the detection method, increasing the charge/discharge cycle rate of lithium-ion batteries can significantly accelerate capacity degradation and shorten cycle test time, making it an effective method for accelerating aging tests.
In this experiment, small-rate charge-discharge tests with intervals of a certain number of cycles were conducted during the cycling process. Real-time monitoring of the lithium battery’s voltage, capacity, and thickness parameters was performed to obtain curves showing the variation of voltage and thickness of the lithium-ion battery over time. Since lithium batteries tend to undergo Li plating when the charging rate reaches a certain range, and Li plating leads to changes in battery thickness to a certain extent, we attempted to determine the degree of Li plating based on differences in thickness. This was aimed at detecting Li plating and establishing a relationship between changes in battery thickness and the degree of Li plating.
2. Testing Information
2.1 Test Equipment
In-situ Swelling Analyzer, Model SWE2100 (IEST), capable of applying pressure ranging from 50 to 10000N, with temperature control adjustable from -20°C to 80°C.
Figure 1: Schematic Diagram of SWE2100 Swelling Equipment
2.2 Test Parameters
2.2.1 Charge and Discharge Process
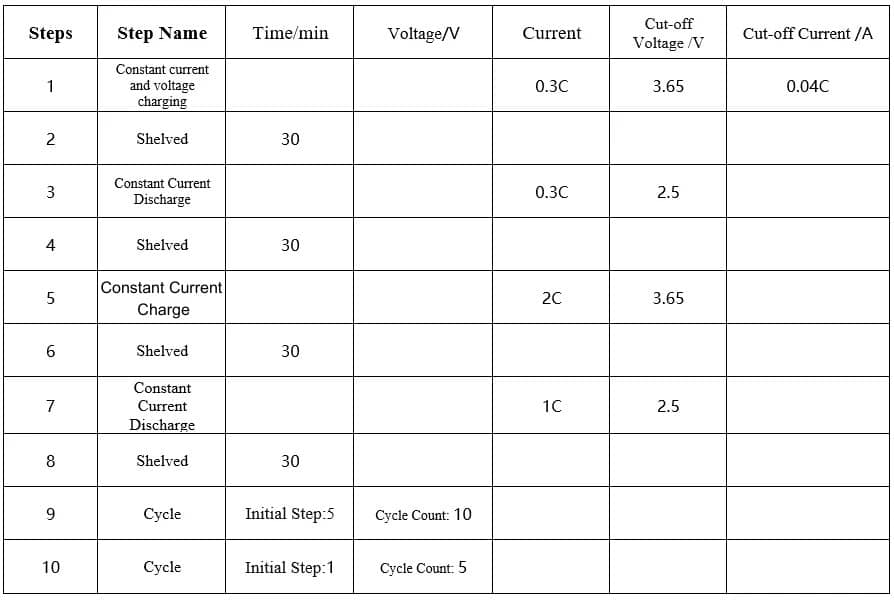
2C/1C charge and discharge cycle, 10cls per cycle, 0.3C/0.3C charge and discharge once, the specific process is as follows:
Table 1. Charging and discharging process

2.2.2 Cell Thickness Swelling Test
Place the test cell into the corresponding channel of the equipment, open the MISS software, set the corresponding cell ID, sampling frequency to 1 second, and parameters such as the applied pressure to 500N. The software automatically reads data including cell thickness, thickness variation, test temperature, current, voltage, capacity, etc.
3. Test Results Analysis

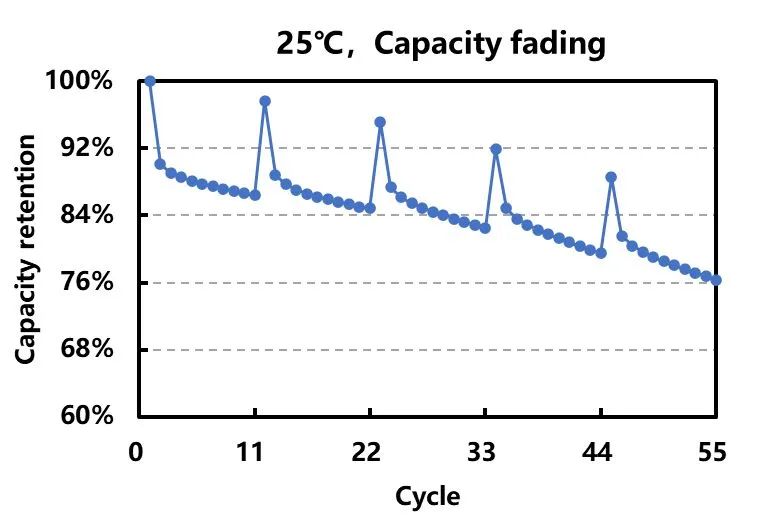
Figure 2. Cycle Capacity Decay Curve
As shown in Figure 2, under ambient temperature conditions, the discharge capacity during 2C/1C charging and discharging is only 90% of that during 0.3C/0.3C charging and discharging. This is primarily due to the phenomenon of concentration polarization in the electrode, where the migration rate of lithium ions within the electrode particles during fast charging is slower than the rate of electrochemical reactions occurring on the surface. This leads to a significant capacity loss in the battery due to polarization effects.

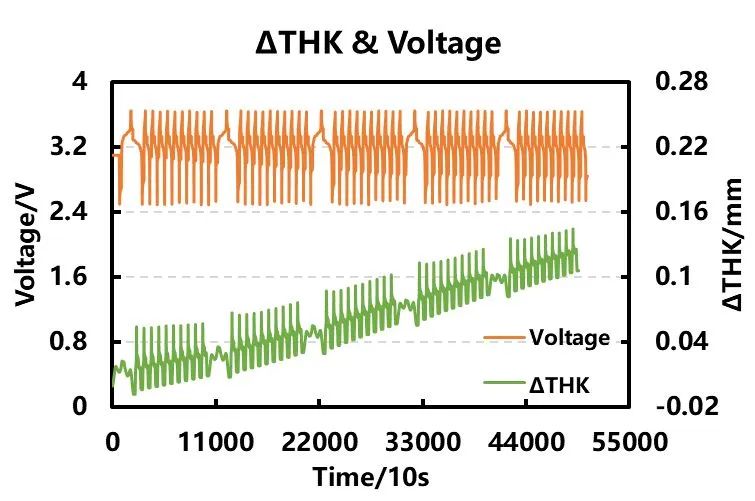
Figure 3. Cycle Charge-Discharge Curve and Swelling Curve
After every 10 cycles of rapid charging, the cell undergoes a 0.3C charge-discharge test, and the curves of voltage and cell thickness variation over time are shown in Figure 3. With the progress of cycling, the thickness of the fully charged cell gradually increases. The increase in thickness during high-rate charging is significantly larger compared to that during low-rate charging. This is primarily due to factors such as uneven distribution of lithium ions in the negative electrode material and precipitation on the surface during high-rate charging of lithium-ion batteries.
Research indicates that significant volume changes in electrodes are related to the insertion and extraction of lithium ions. For pouch cells, the variation in electrode volume can be observed. During cycling under moderate conditions, the changes in cell thickness are reversible and do not permanently increase. For mature battery systems, the effects of gas evolution and thermal expansion on cell thickness can be negligible, and only the deposition of lithium layers will cause thickness variations in a single cycle. Once lithium deposition occurs during charging, the metallic lithium film on the negative electrode and subsequently formed SEI film will cause additional expansion and irreversible changes in cell thickness. Dial indicators or displacement sensors are typically used for point measurements.
However, having only one measurement point on the cell is far from sufficient, as the occurrence of lithium deposition layers is typically random and unevenly distributed. The in-situ expansion analyzer developed by IEST detects the overall average thickness of the cell, avoiding the influence of measurement positions on the detection conclusions. It is capable of comprehensively monitoring the thickness variations across the entire cell surface caused by lithium deposition reactions.

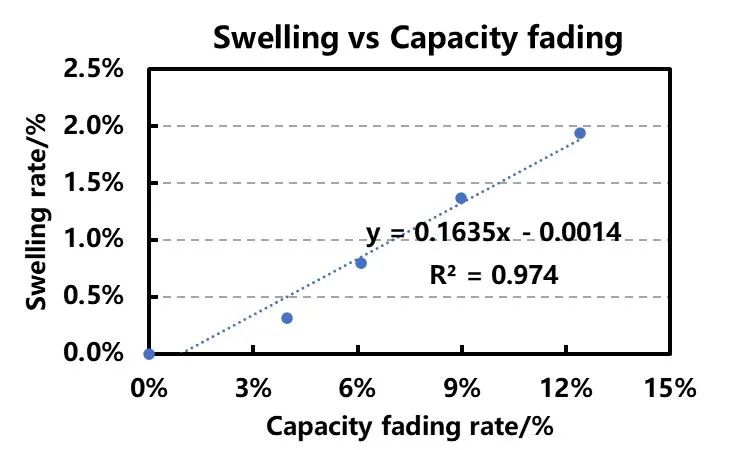
Figure 4. Correspondence between Low-Rate Capacity Decay Rate and Expansion Rate
In Figure 4, the horizontal axis represents the 0.3C discharge capacity decay rate, and the vertical axis represents the cell thickness expansion rate during 0.3C charging. From the fitted relationship in the graph, it can be inferred that there is a positive correlation between the 0.3C discharge capacity decay rate and the cell thickness expansion rate. This indicates that during high-rate cycling processes, significant polarization occurs in the battery, leading to lithium deposition on the negative electrode surface.
As a result, there is a decay in capacity and an increase in cell thickness during the intermediate stages of the 0.3C/0.3C charge-discharge cycles. Due to kinetic hindrances (such as low-temperature charging/discharging, high-rate charging/discharging, high coating density, etc.), the capacity changes during low-rate charging processes are largely unaffected by polarization effects. Therefore, without considering material losses, the correspondence between the low-rate capacity decay rate and expansion rate can be approximately regarded as the correspondence between lithium deposition and expansion. This allows for the fitting of the correspondence between lithium deposition and expansion throughout the entire lifecycle of the cell, enabling rapid assessment of Li plating levels in similar designed cells at different stages.
4. Summary
This paper utilizes an in-situ swelling analyzer (SWE) to analyze the capacity and expansion thickness of cells during cycling. It is found that conducting depolarized low-rate charge-discharge tests at certain intervals can straightforwardly quantify the correspondence between lithium deposition and expansion rate in cells, providing a new approach for studying accelerated aging tests of lithium-ion batteries.
5. References
[1] Waldmann T, Hogg B I, Wohlfahrt-Mehrens M. Li plating as unwanted side reaction in commercial Li-ion cells-A review. Journal of Power Sources, 2018, 384: 107-124.
[2] Smith A J, Burns J C, Zhao X, et al. A High Precision Coulometry Study of the SEI Growth in Li/Graphite Cells. Journal of The Electrochemical Society, 2011, 158(5): A447.
[3] Deng Linwang, Feng Tianyu, Shu Shiwei, Guo Bin, Zhang Zifeng. Research Progress on Non-Destructive Detection of Lithium Plating in Lithium-Ion Batteries. Energy Storage Science and Technology. 2023, 12(1): 263-27
Subscribe Us
Contact Us
If you are interested in our products and want to know more details, please leave a message here, we will reply you as soon as we can.


