-
iestinstrument
The Effect of Charging Rate on Overcharge Gas of Cell
In this paper, an IEST in-situ volume monitor (GVM) is used to carry out in-situ overcharge volume test under different charging rate conditions (0.5C/1.0C/2.0C/3.0C) on lithium cobalt oxide/graphite batteries (theoretical capacity 1000mAh), and compare and analyze the cell gas production behavior.
Electrolyte is one of the four main materials of lithium-ion batteries. It has an important impact on the gas production during the overcharge of lithium-ion batteries. Choosing a suitable electrolyte formulation can continuously repair the SEI damage of the battery during the cycle and maintain the electrodes. The structural stability of the material maintains the cell capacity and dynamic performance. From the perspective of solvents, lithium salts, and additives, improving the safety of electrolytes during use is an important direction of electrolyte research. Since each electrolyte component has its own electrochemical reaction potential, if it reaches this potential, an electrochemical reaction will occur, and a certain amount of gas will be generated at the same time, causing the volume of the cell to expand, and even an explosion 1-3. The voltage of the battery is higher when overcharged, which is more likely to cause the decomposition of solvents and additives in the electrolyte, resulting in gas production, but different charging rate will affect the starting potential of gas production and the gas production volume.

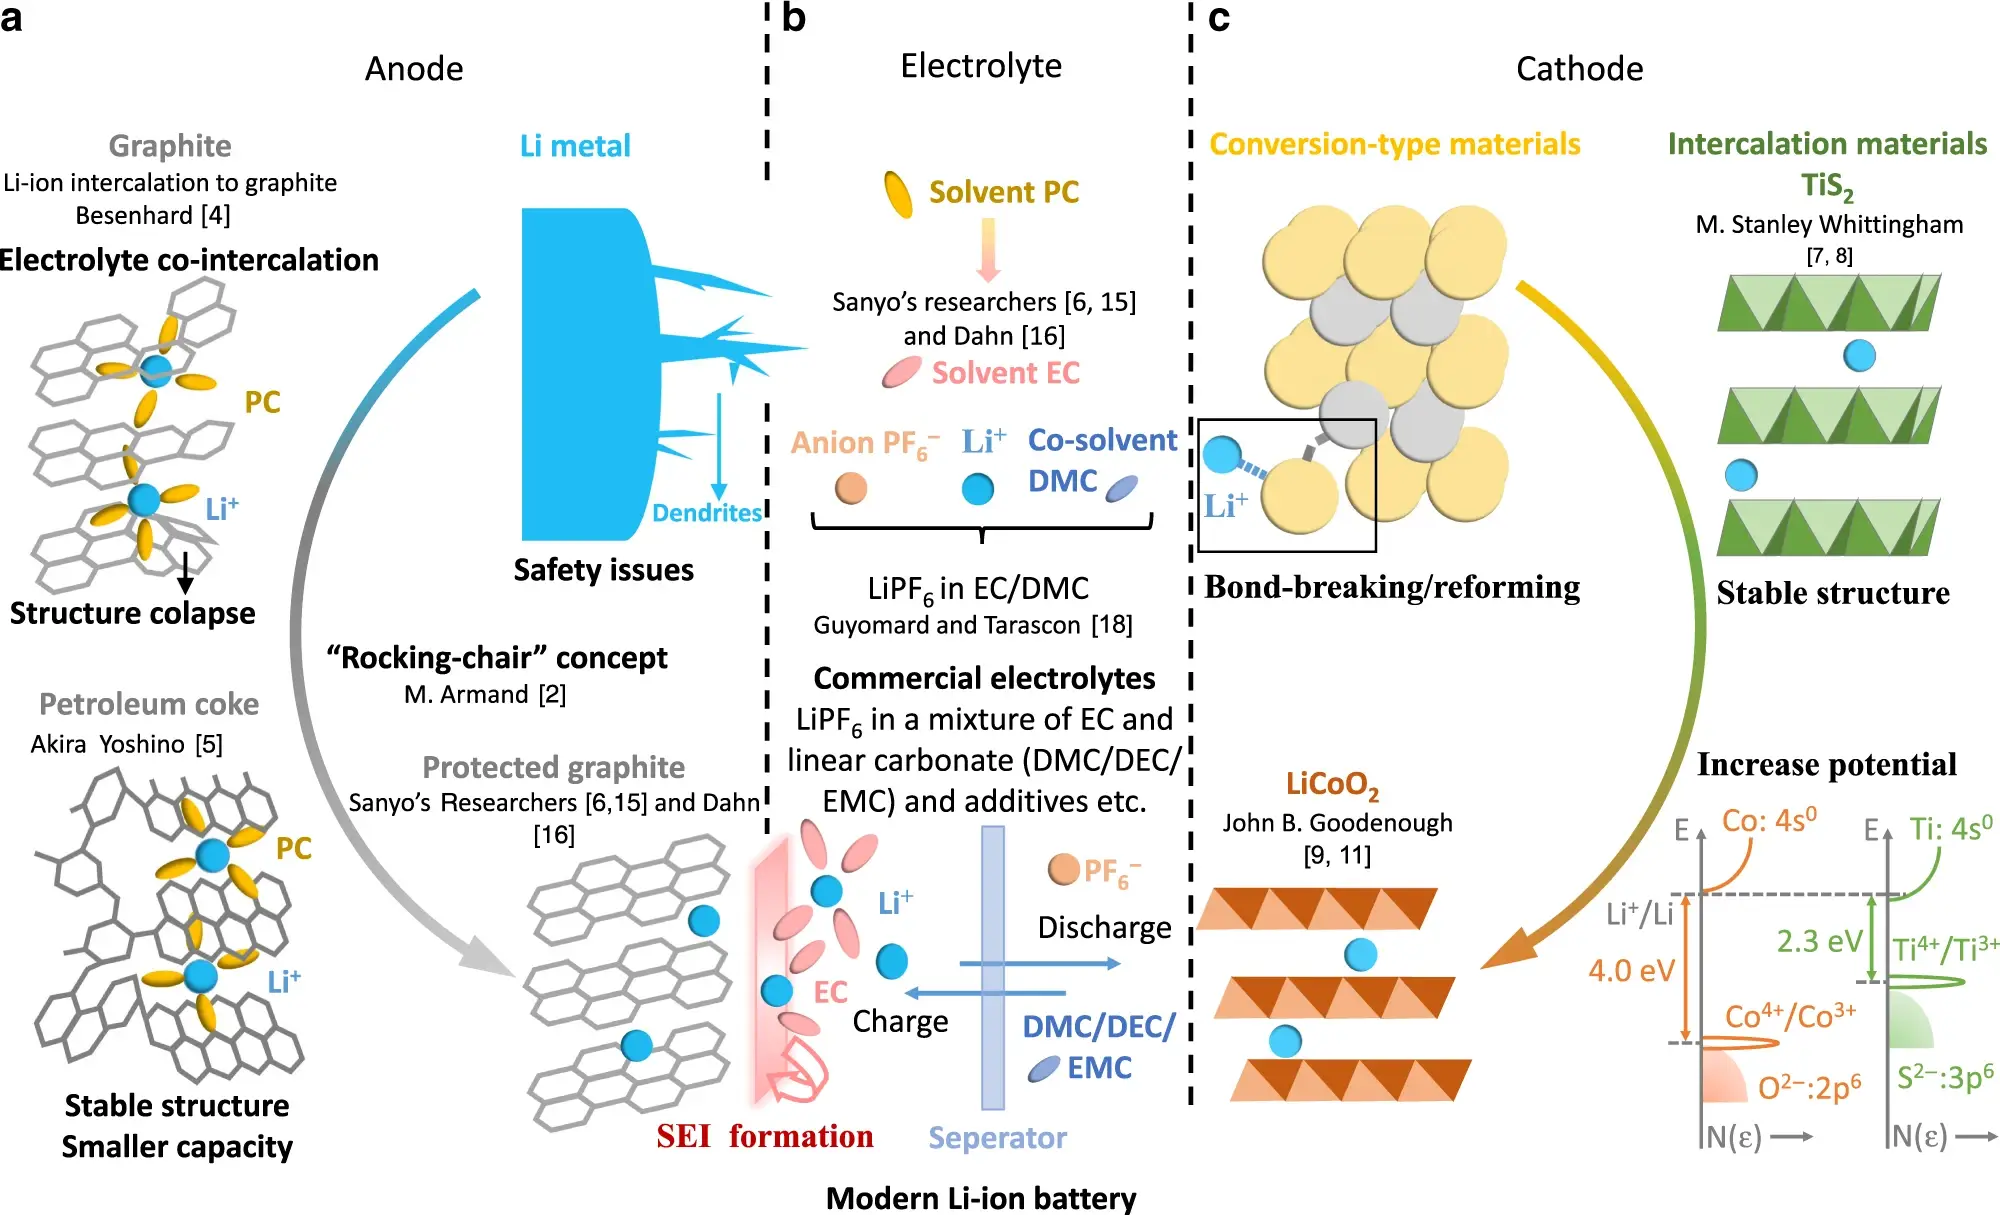
Figure 1. Schematic diagram of failure modes of lithium-ion batteries1
1. Experimental Equipment and Test Methods
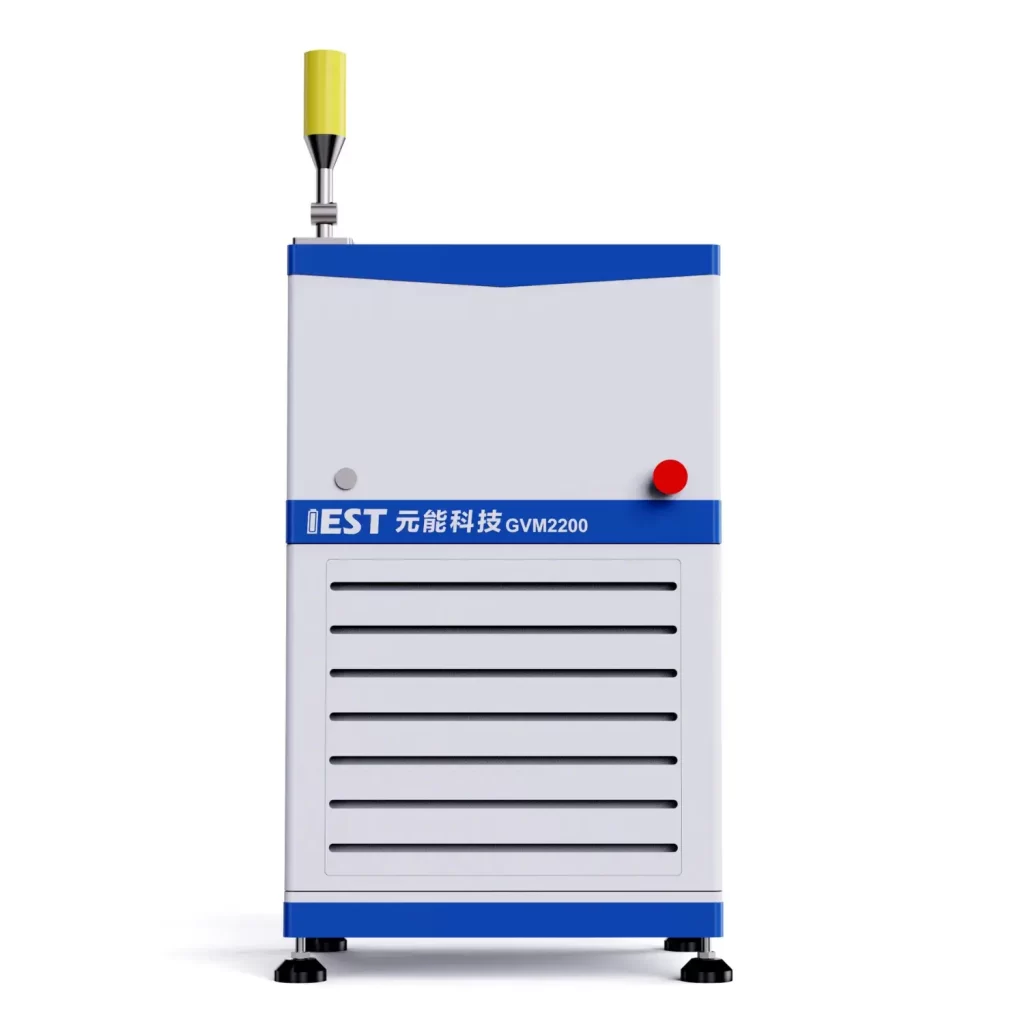
1.1 Experimental Equipment: Model GVM2200(IEST), the test temperature range is 20℃~85℃, and it supports dual-channel synchronous testing. The appearance of the equipment is shown in Figure 2.

Figure 2. Appearance of GVM2200 Equipment
1.2 Test Method: Initially weigh the cell m0, put the cell to be tested into the corresponding channel of the device, open the MISG software, set the cell number and sampling frequency parameters corresponding to each channel, and the software automatically reads the volume change and tests Data such as temperature, current, voltage, capacity, etc.
2. In-situ Monitoring of Gas Generation Behavior of Lithium-ion Batteries
2.1 Analysis of Charge and Discharge Curve and Volume Change Curve
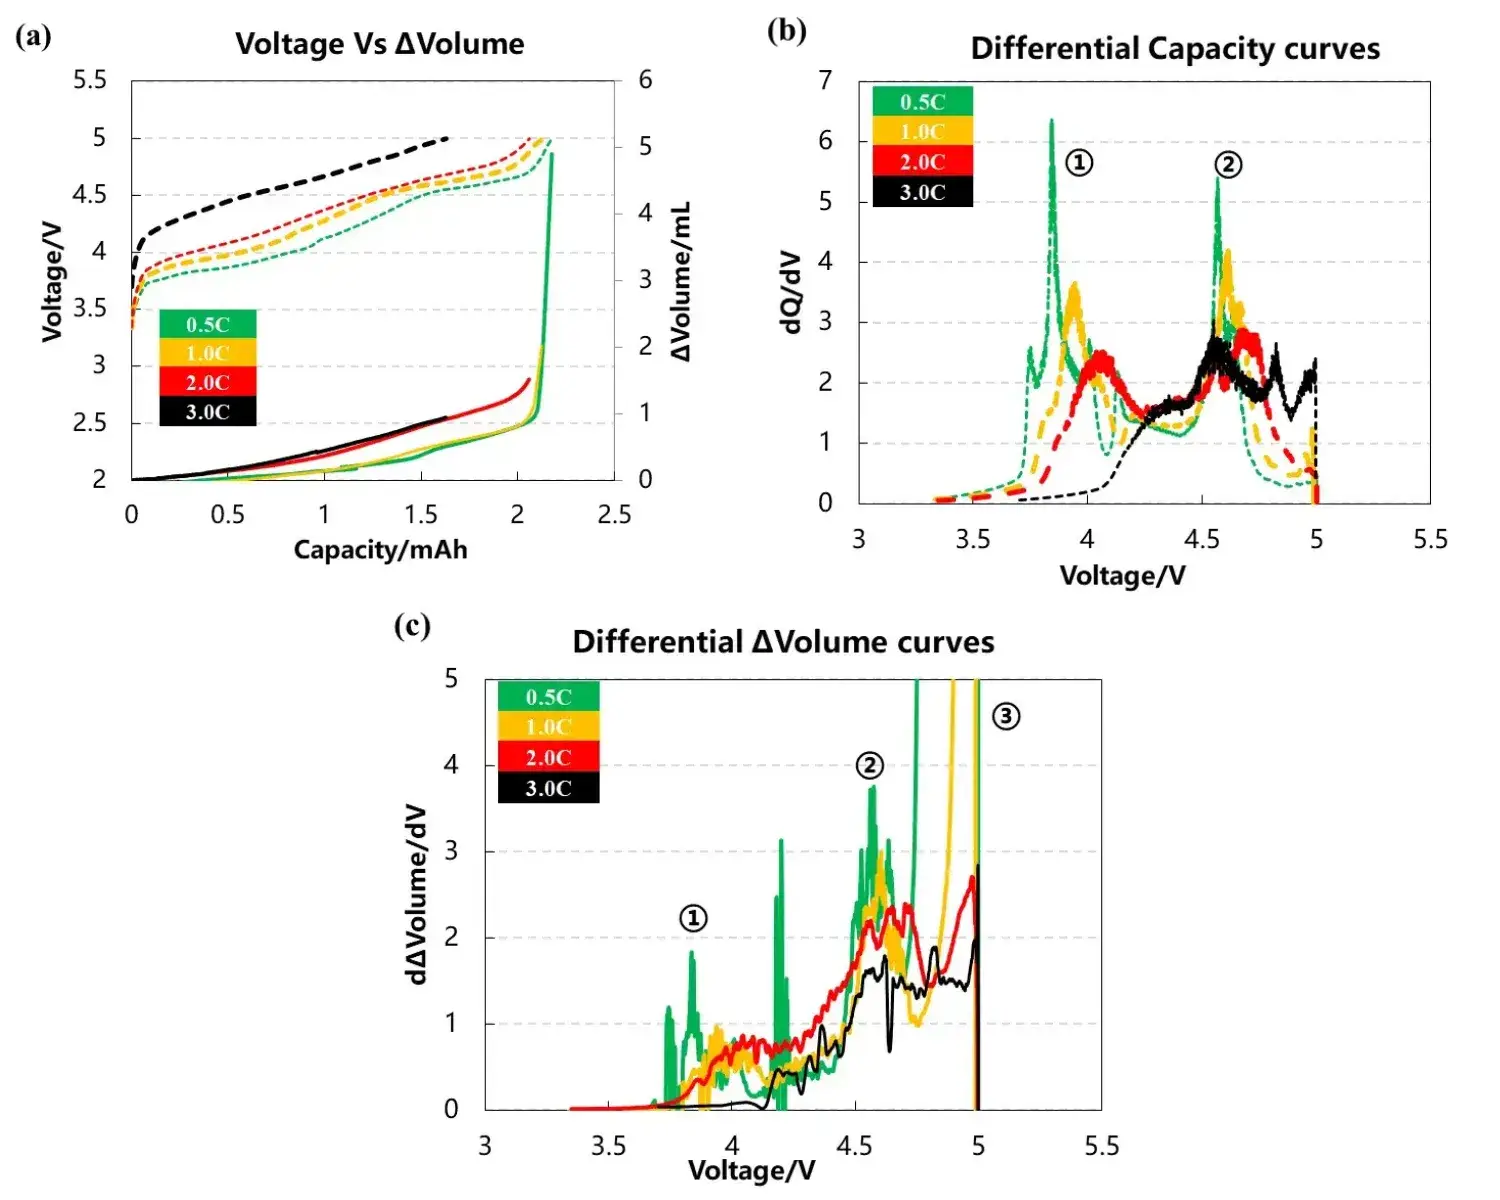
The volume change curve, voltage and differential capacity curve of the cell are shown in Figure 3(a)(b)(c). Different charging rates are used to overcharge the battery cells to 5V with constant current. It can be seen from Figure 3(a) that as the charging rate increases, the corresponding charging capacity decreases when the battery is overcharged to 5V, and the volume change curve corresponding to 0.5C and 1.0C will have an obvious inflection point when the voltage is close to 5V, and the gas production will increase sharply. It can be seen from the differential capacity curve in Figure 3(b) that with the increase of the charging rate, the two sets of deintercalated lithium peak positions at positions ① and ② gradually shift to the right, indicating that the polarization gradually increases. Figure 3(c) is the curve after the volume change curve is differentiated by the voltage. It can be seen that there are about three gas production peaks, while the two sets of curves of 2.0C and 3.0C have almost no obvious peaks at the third position.

Figure 3. (a)The charge and discharge curve of the battery cell at four rates. (b)the differential capacity curve. (c)the differential volume change curve.
2.2 Analysis of Cell Capacity and Gas Voltage
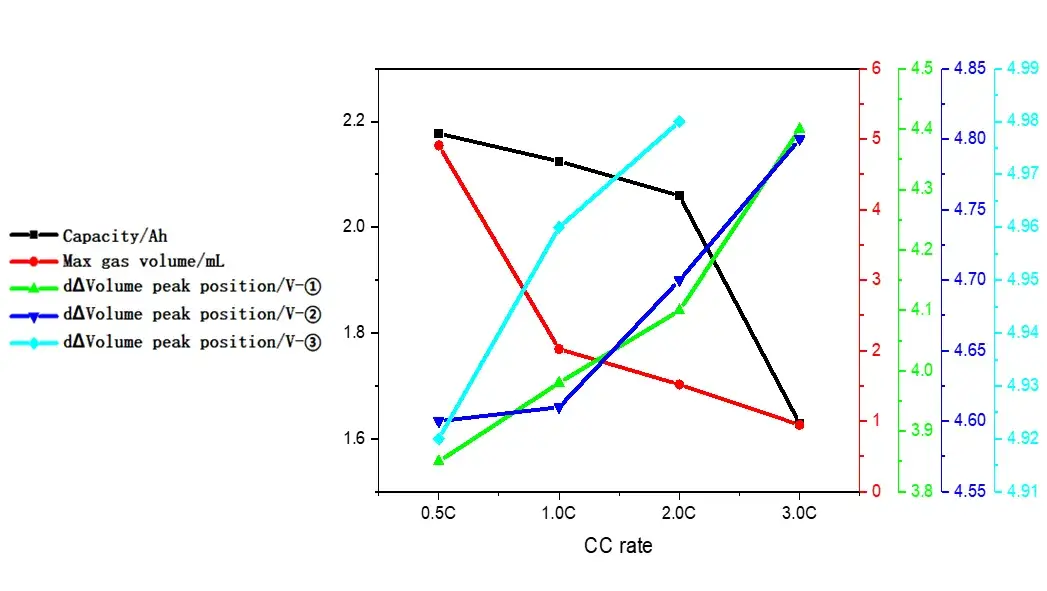
Table 1 and Figure 4 show the battery charging capacity and the inflection point voltage information of the gas production curve at different rates. As the charging rate increases, the charging capacity of the cell gradually decreases, and when the rate increases from 2C to 3C, the rate of capacity decay also increases. From the gas production curve of the cell, it can be seen that the gas production at a small rate of 0.5C is significantly greater than that corresponding to a rate above 1C. Comparing and analyzing the capacity attenuation curve and the gas production attenuation curve, it can be seen that with the increase of the charging rate, the main reason for the attenuation of the cell capacity is not the increase in the gas production. It may be due to the increase in the rate that the cell polarization increases, which makes it more difficult to deintercalate lithium ions. It can be seen from the differential curve of the volume change that the corresponding voltages of the three groups of gas production peaks all shift to the right with the increase of the magnification. When the magnification is 3.0C, the third gas production peak does not appear, indicating that the increasing polarization of battery cell increases the decomposition voltage of the electrolyte components, resulting in less gas production in the cell as a whole.
Table 1. Cell charging capacity and gas production related information corresponding to different magnifications


Figure 4. Analysis curves of capacity, gas production and gas production voltage under different magnifications
3. Summary
This paper uses a temperature-controllable dual-channel in-situ gas production volume monitor(GVM2200) to monitor the gas production behavior of lithium-ion cells under different overcharge conditions. It can be found that as the charging rate increases, the capacity of the cell decreases. The gas production is reduced, and the initial voltage of gas production is increased. The subsequent qualitative analysis of gas production components can be combined to further explore the effects of different solvents and additives types and contents on the overcharge of battery cells and help R&D personnel develop safer reliable electrolyte system.
4. References
[1] Jing Xie, Yi-Chun Lu. A retrospective on lithium-ion batteries. Nature Communications. (2020) 11:2499.
[2] C. P. Aiken, J. R. Dahn et al. An Apparatus for the Study of In Situ Gas Evolution in Li-Ion Pouch Cells. J. Electro Soc, 161(2014) A1548-A1554.
[3] Randolph A. Leising. Abuse Testing of Lithium-Ion Batteries: Characterization of the Overcharge Reaction of LiCoO2/Graphite Cells. Journal of the Electrochemical Society, 148(8):A838-A844 (2001).
Subscribe Us
Contact Us
If you are interested in our products and want to know more details, please leave a message here, we will reply you as soon as we can.


