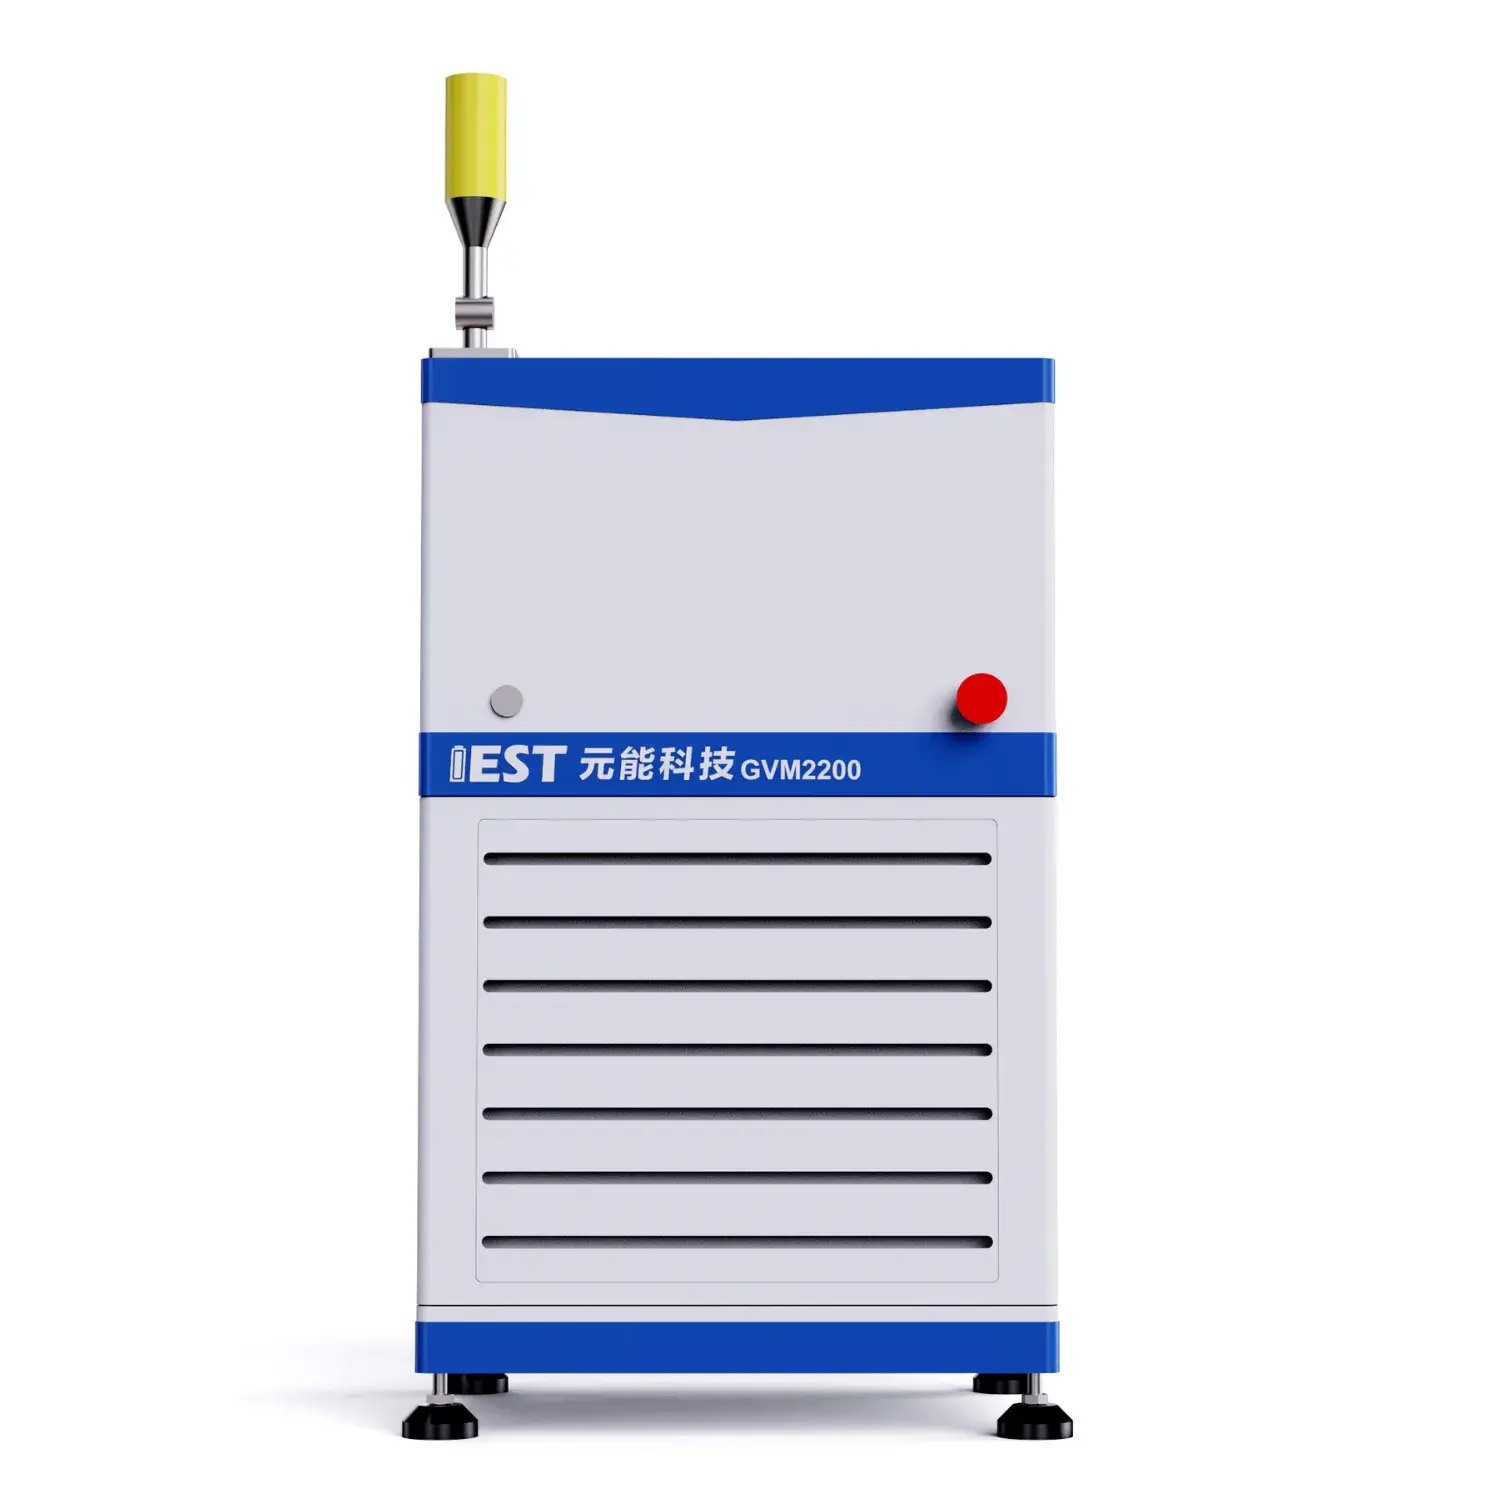
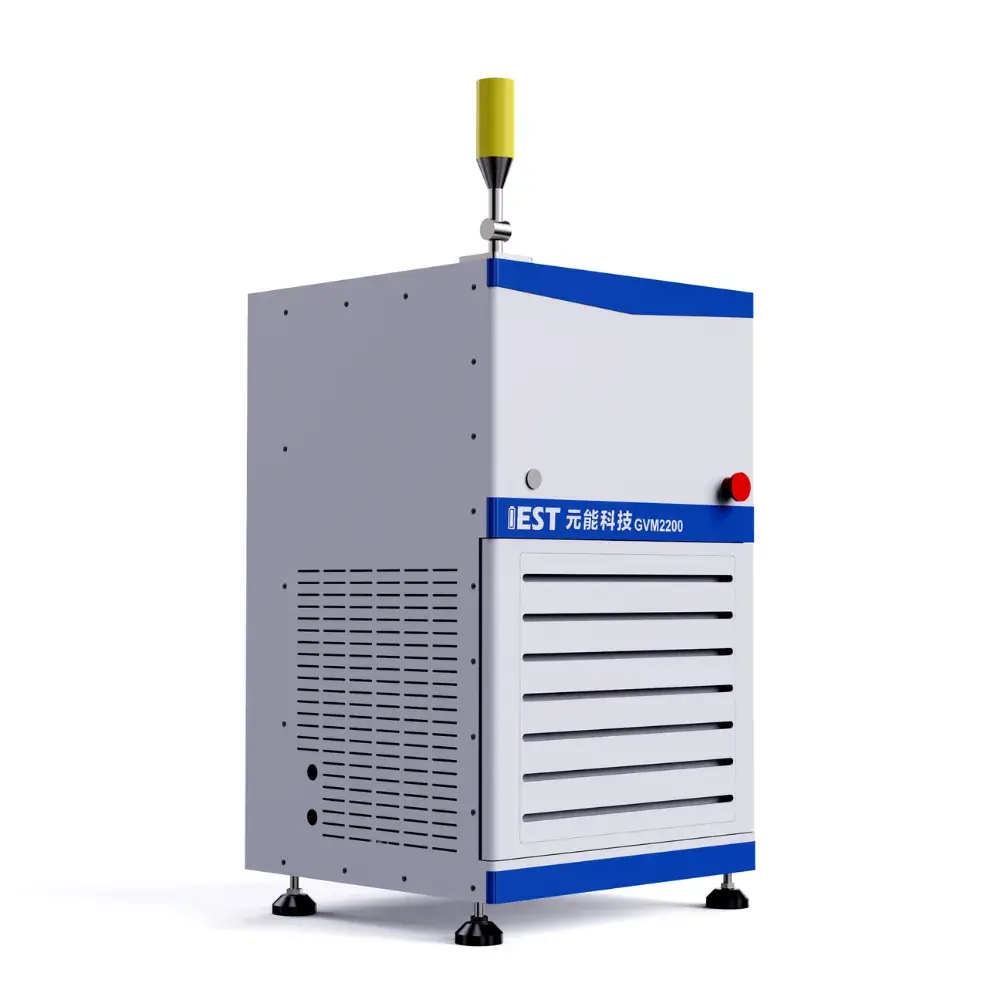
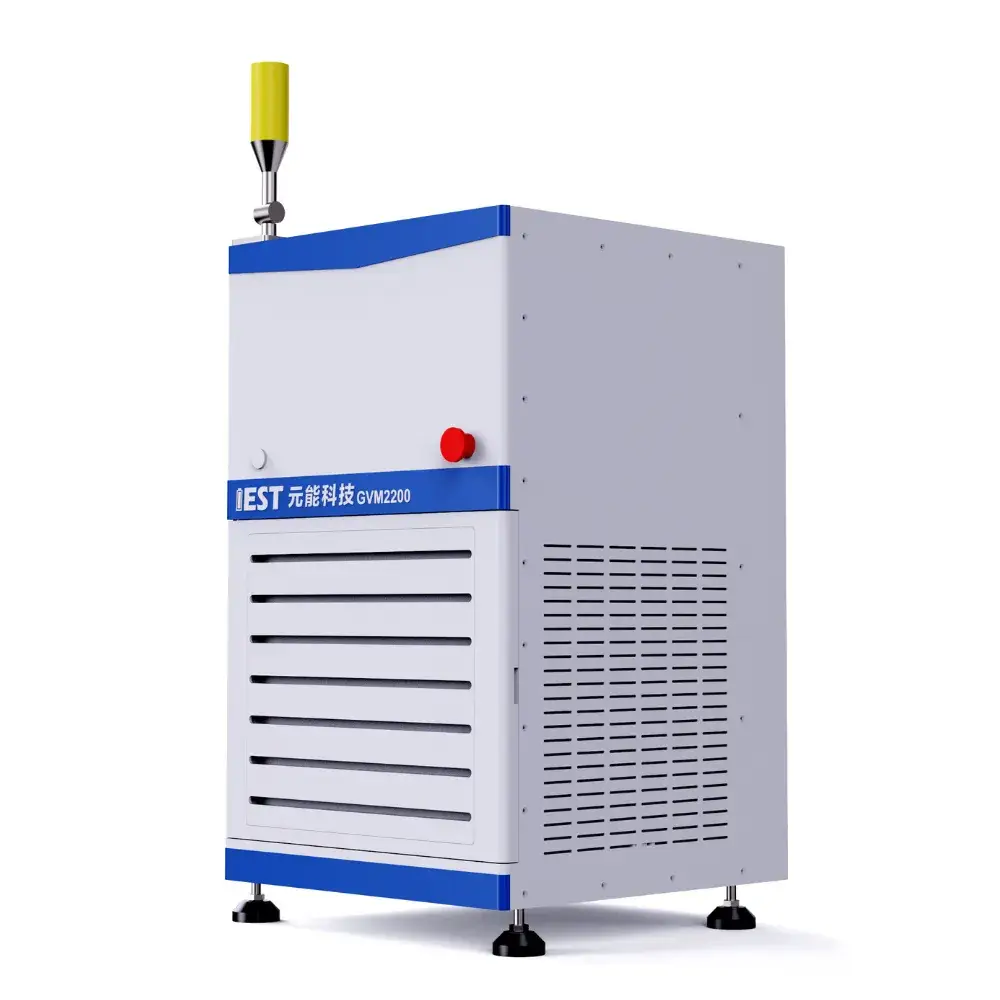
Description
1. Applicathions
- Electrolyte Development: Comparing the impact of different electrolyte formulations and additives on cell formation gassing, optimizing additive utilization in formulations to accelerate cell R&D.
- Formation Process Optimization: Evaluating the effects of temperature, C-rate, and cut-off voltage on gas volume, thereby optimizing formation parameters to enhance production efficiency and cell quality.
- Onset Monitoring: Detecting the gassing onset point during cell overcharge and overdischarge to evaluate the pressure tolerance limit of the cell chemistry system.
- Abuse Process Analysis: Investigating gassing rates and behavior to gain deeper insights into cell degradation and thermal abuse mechanisms.
- Storage Environment Definition: Exploring optimal storage and operational conditions for lithium-ion batteries, providing data support for cell datasheets and specification guidelines.
- Aging Behavior Analysis: Studying gassing aging mechanisms during long-term cycling to guide lifespan extension and enhance cell reliability.
- Material Modification Assessment: Evaluating the effectiveness of surface coating and particle modification techniques to support advanced material development.
- Slurry Mixing Optimization: Investigating the impact of formulations and slurry mixing processes on material coating integrity, optimizing processing to boost cell performance.
2. Traditional Testing Method
2.1 Single Volume Drainage Method
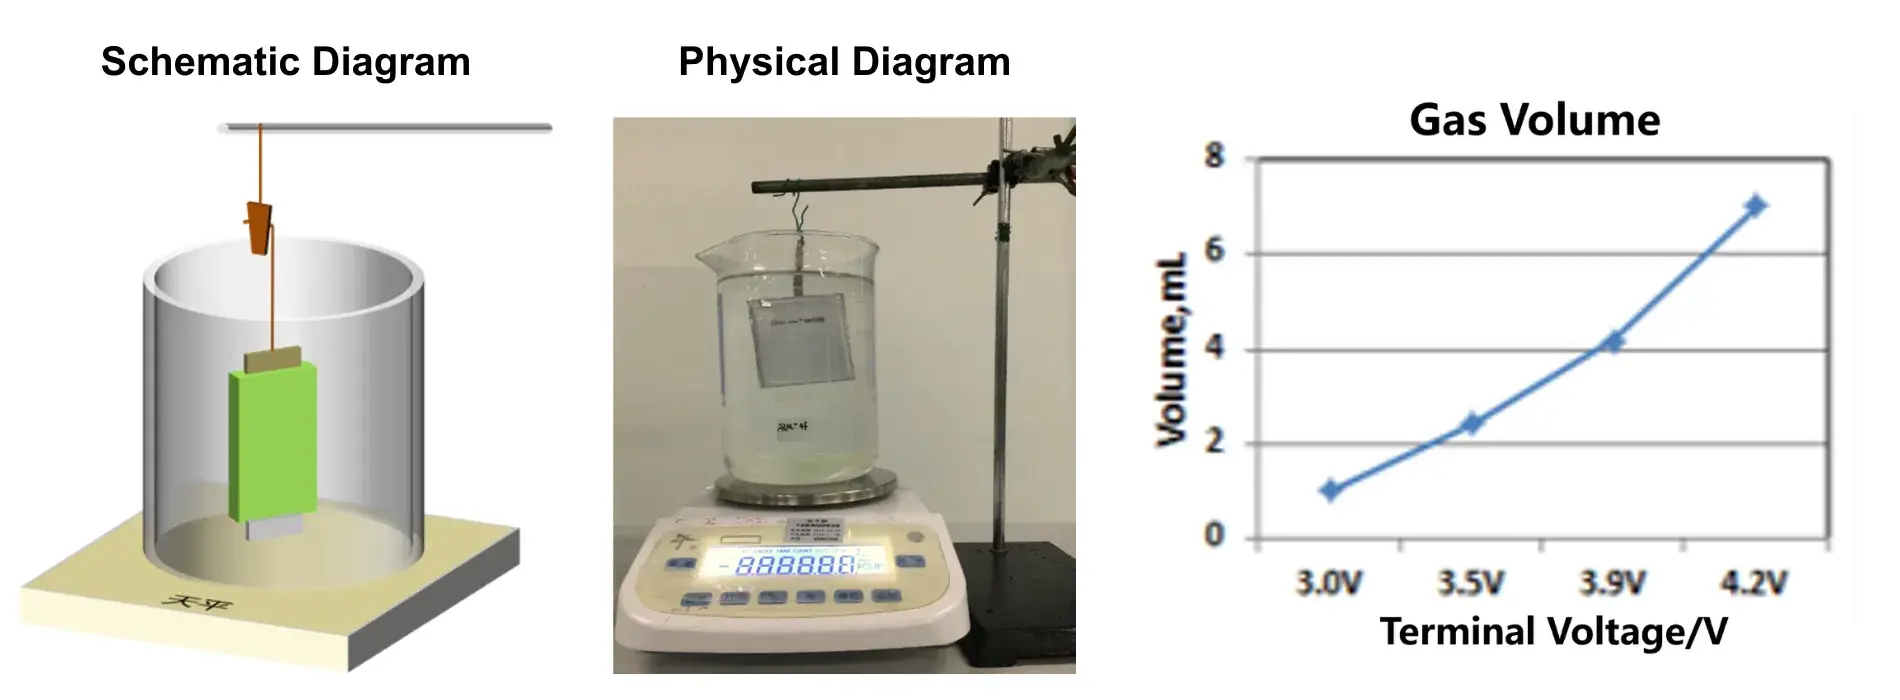
The Single Volume Drainage Method uses a balance to measure cell volume. It characterizes the volume change of a cell during the entire charging process by taking point-based measurements of the cell volume at different cutoff voltages and fitting the obtained volume data.
Disadvantages:
- Single-point measurement: Unable to capture continuous volume and gassing rate changes throughout the entire cell formation process.
- Ex-situ measurement: Susceptible to ambient environmental interference during sample transfer.
- Conventional balance weighing: Incapable of long-term, online, stable, and high-precision measurement.
- High cell consumption: Requires a large quantity of test cells, making it impossible to eliminate errors caused by cell-to-cell variability.
2.2 Simple In-situ Gas Analyzer Device
Self-assembled basic in-situ apparatus
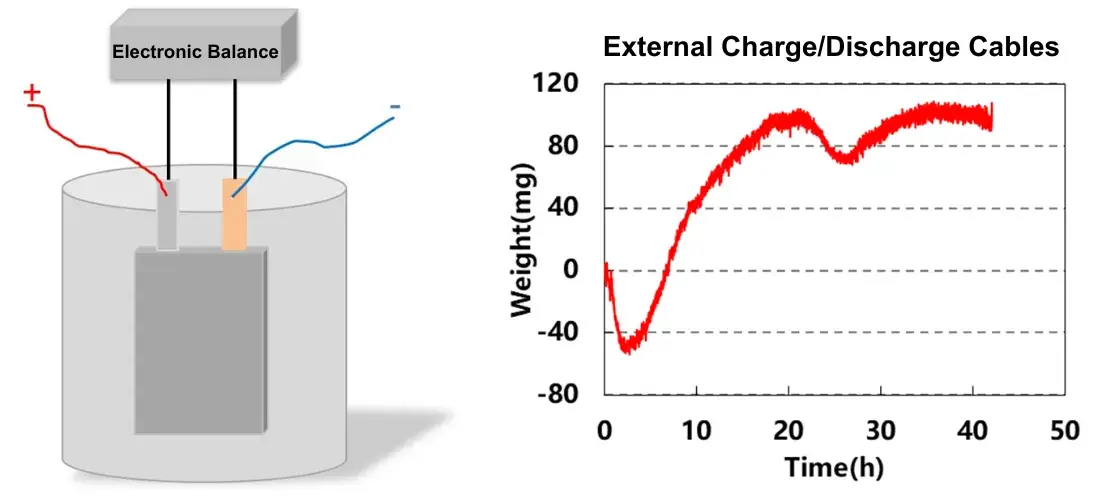
Disadvantages:
- Cannot perform temperature-variable testing at different temperatures;
- Unable to achieve force-electrical coupling, with significant load cell fluctuations due to external interference;
- Lacks automated data acquisition software, requiring manual post-processing and merging of data.
3. IEST Creative Solutions
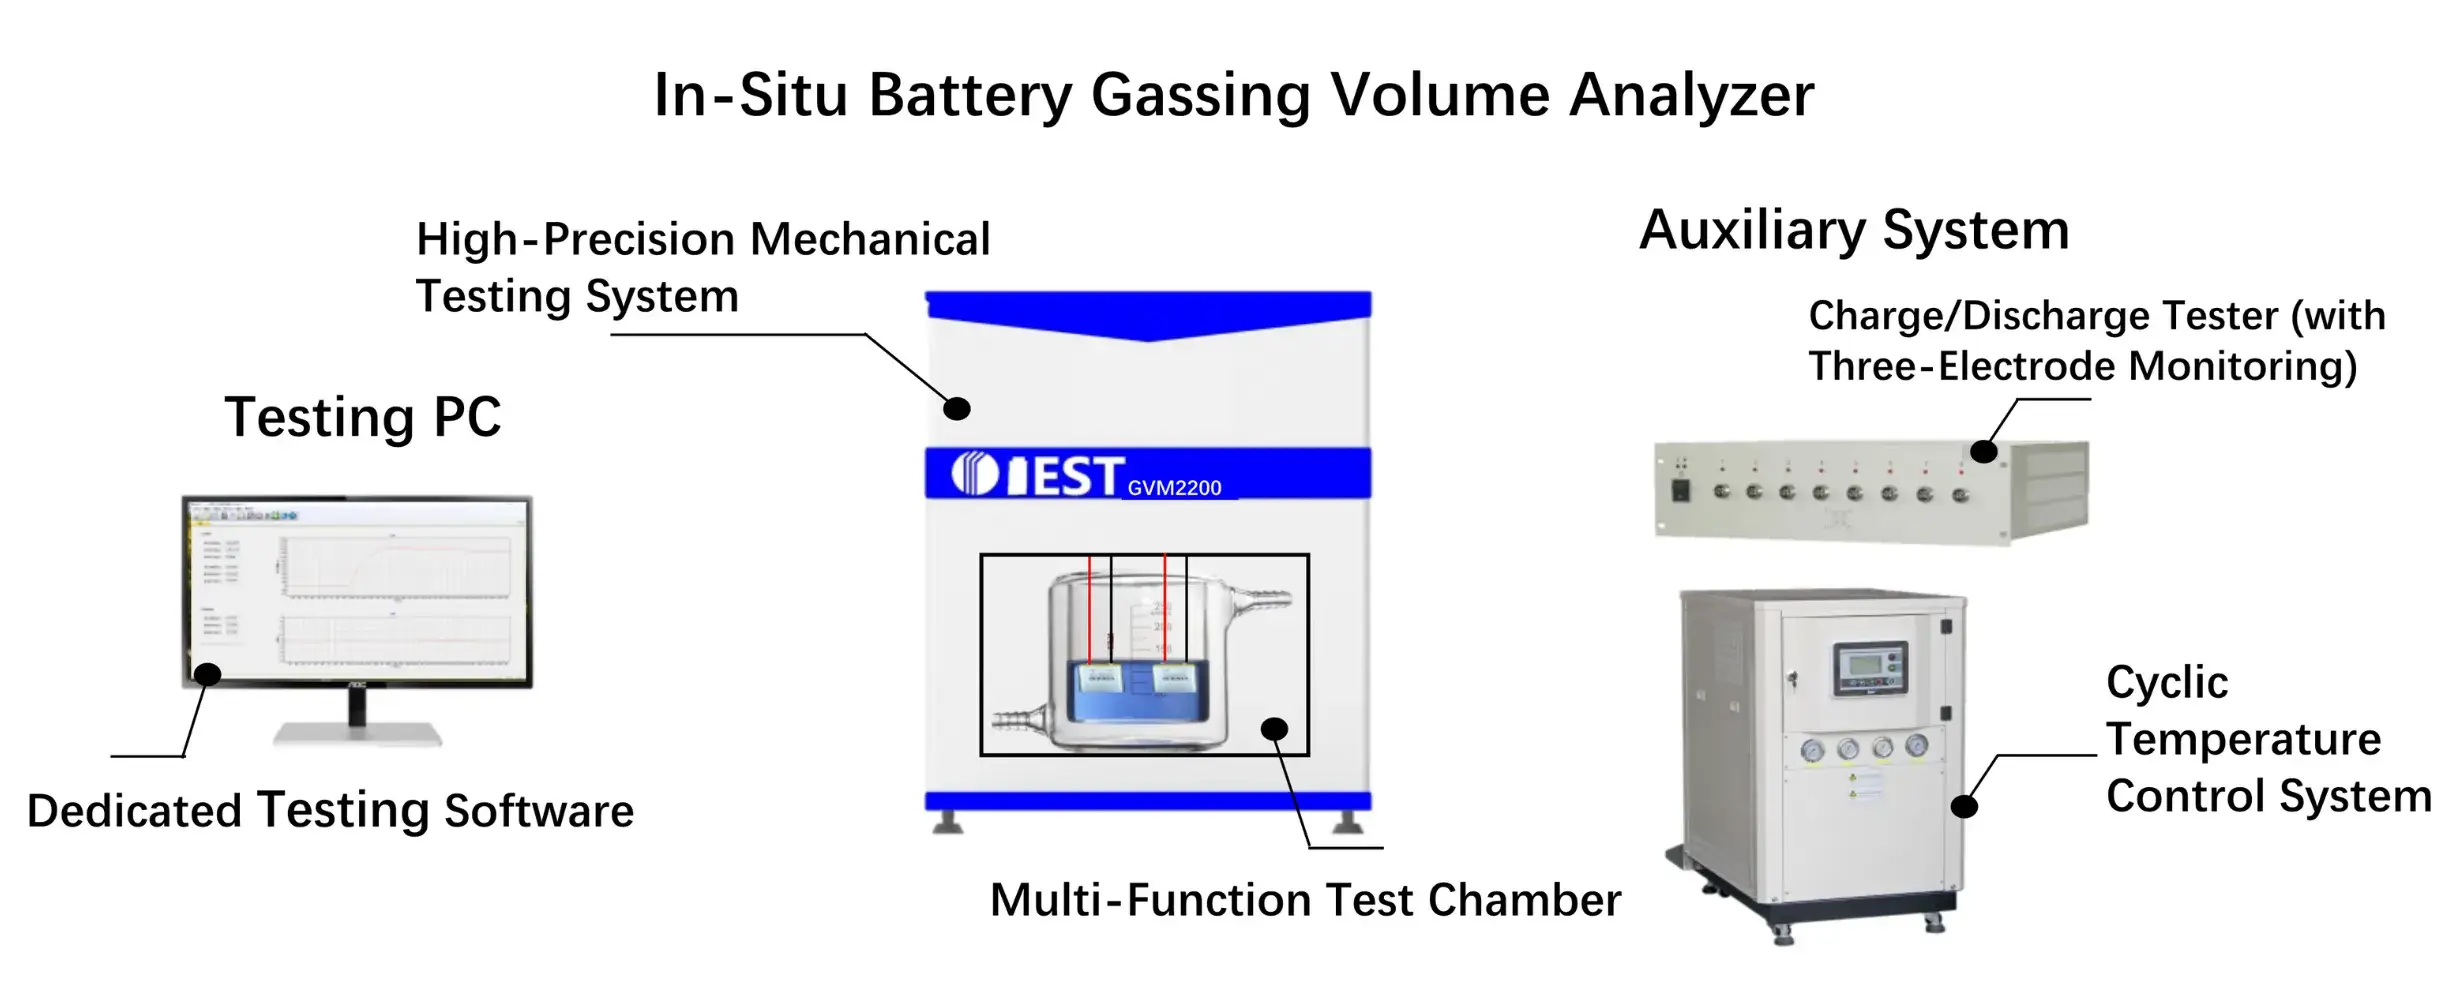
- Simultaneous Mechanical-Electrochemical Testing System: In-situ long-term monitoring with 1 μL resolution
- Temperature-Controlled Environments: 20°C to 85°C
- Dedicated Software: Real-time data acquisition from mechanical test systems with automated plotting of volumetric expansion curves and electrochemical profiles.
- Auxiliary System: Special structural design allowing seamless docking with supporting auxiliary systems for precise temperature regulation.
4. Instrument Principles
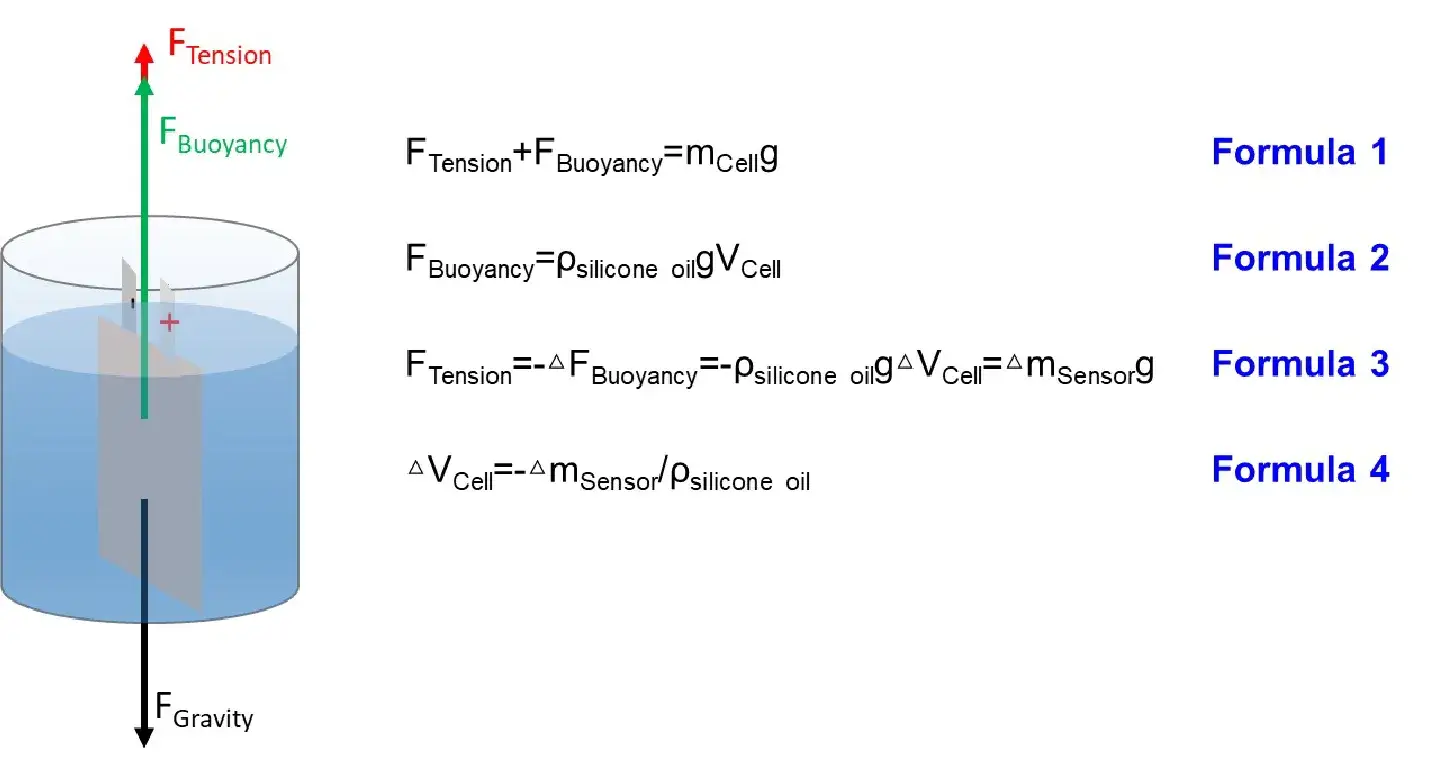
By combining Newton’s law (formula 1) and Archimedes’ buoyancy principle (formula 2), specialized sensors are used to measure the real-time mass changes of the cell during the charge & discharge process, and then the cell’s volume changes can be further calculated(formula 3 and 4).
5. Product Features
- Multi-Level Gassing Testing: Material Gassing → Single-Layer Stacked Cell Gassing → Small Pouch Cell Gassing → Cylindrical & Prismatic Cell Gassing
- Multi-Channel Gassing Testing: Single channel → 2-channel → 8-channels Testing
- Multiple Temperature Settings: Room Temperature Testing → High and Low Temperature Testing (RT to 85℃ with Water Bath Control)
- Comprehensive Gassing Analysis: Gassing Volume → Gassing Pressure → Gassing Composition Analysis
Applications
1. Formation Gassing Analysis
1.1 Formation at different temperatures
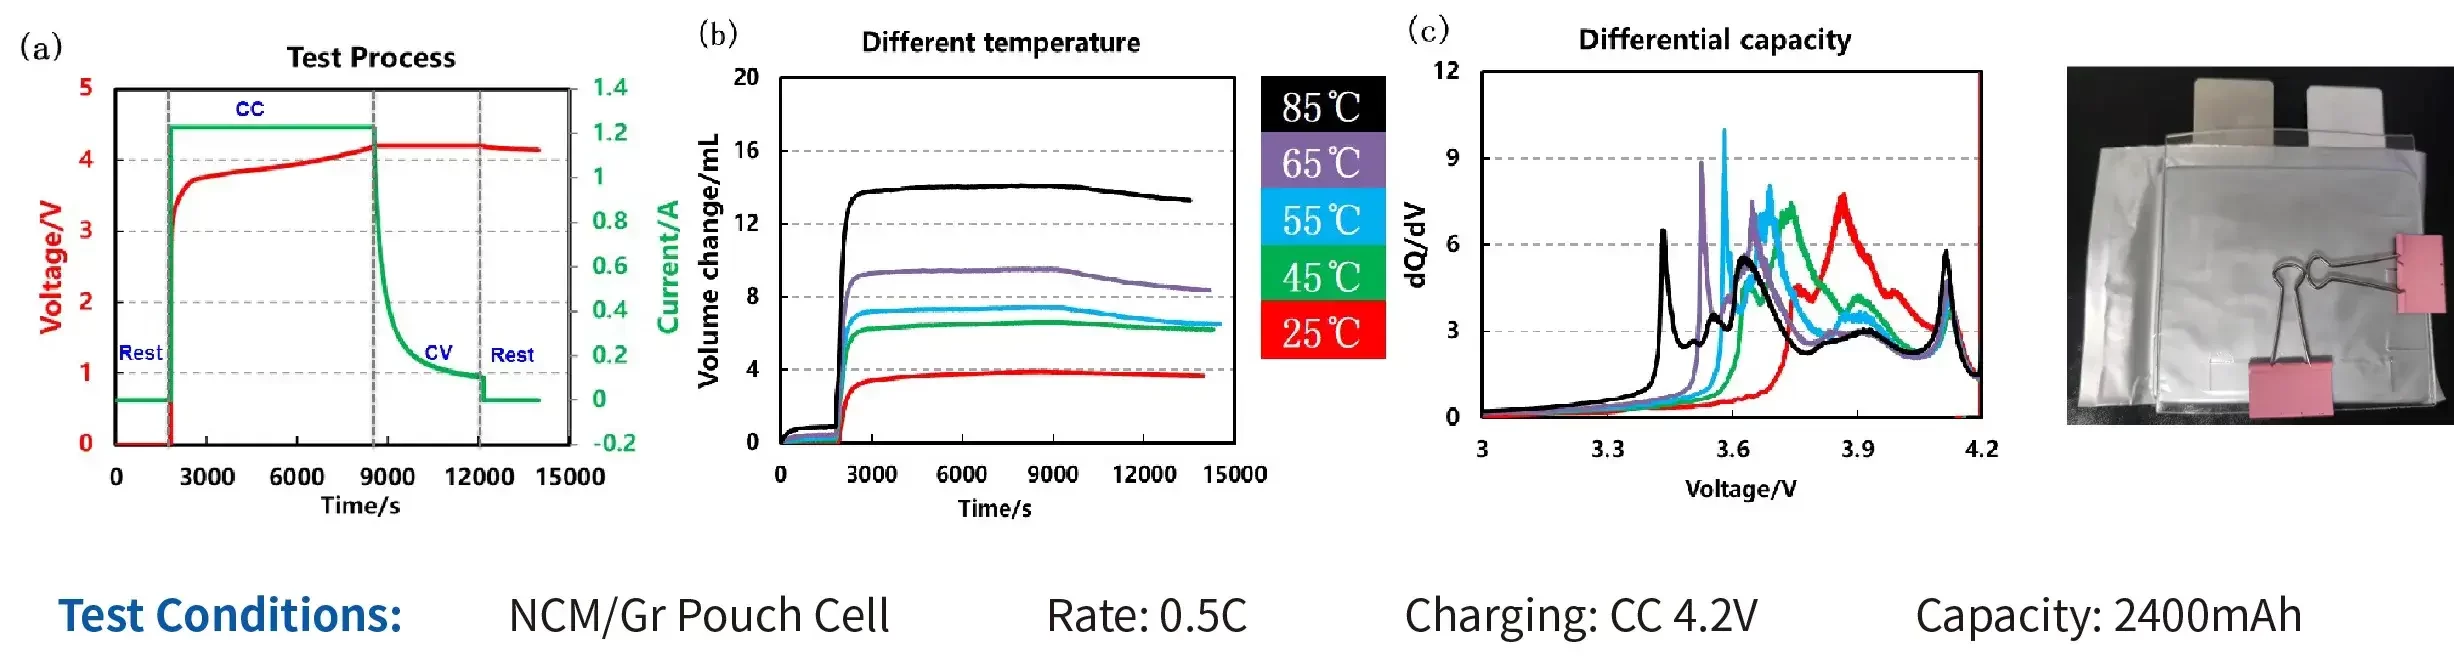
- Gas production increases progressively with elevated formation temperatures.
- From the perspective of differential capacity curves, higher formation temperatures reduce the polarization of each phase transition. However, when the temperature exceeds 55°C, the first phase transition peak becomes sharper, which may be related to the more vigorous SEI film formation reaction at elevated temperatures.
1.2 Formation with different electrolyte additives
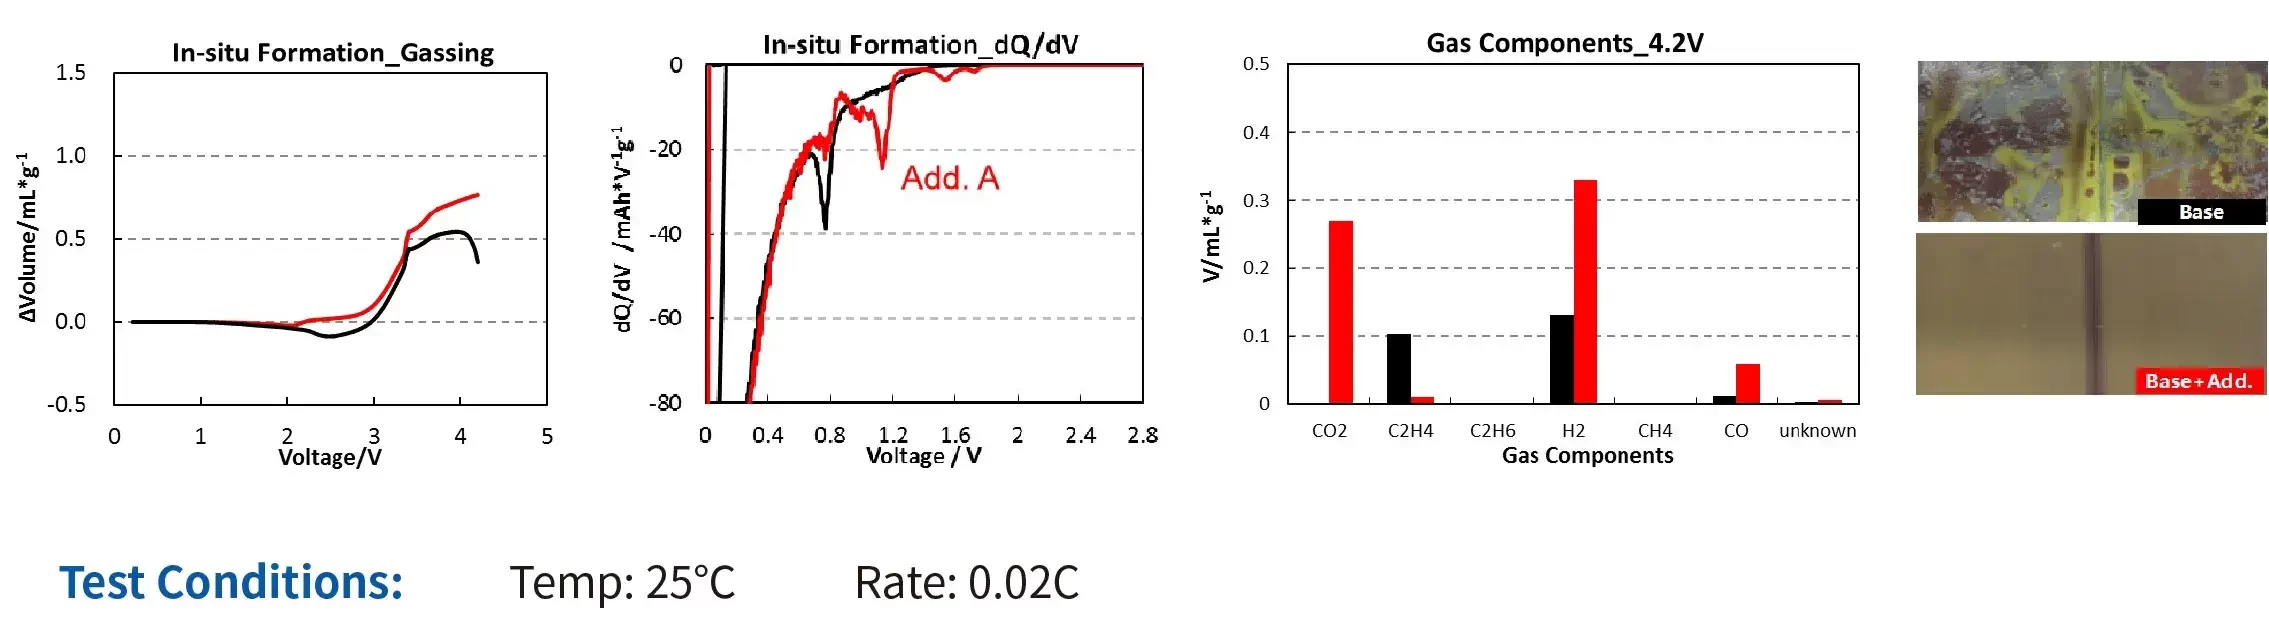
- In the same electrolyte, the gas generation volume and gas generation rate of the cell formed with electrolyte B, which contains a certain additive, are both higher than those of the electrolyte A without the additive. This additive helps the cell’s film formation reaction to be more complete.
- Comparative analysis of gas evolution volume/rate dynamics across electrolytes with varying additives enables rapid assessment of additive impacts on formation processes. Combined with three-electrode formation data, this approach facilitates targeted electrolyte formulation optimization.
- Combined with the MacMullin number data, it can be concluded that the ease of lithium-ion migration within the coating is influenced by the electrolyte formulation. A higher MacMullin number corresponds to poorer battery rate performance, indicating consistency between the electrochemical test results and tortuosity measurements.
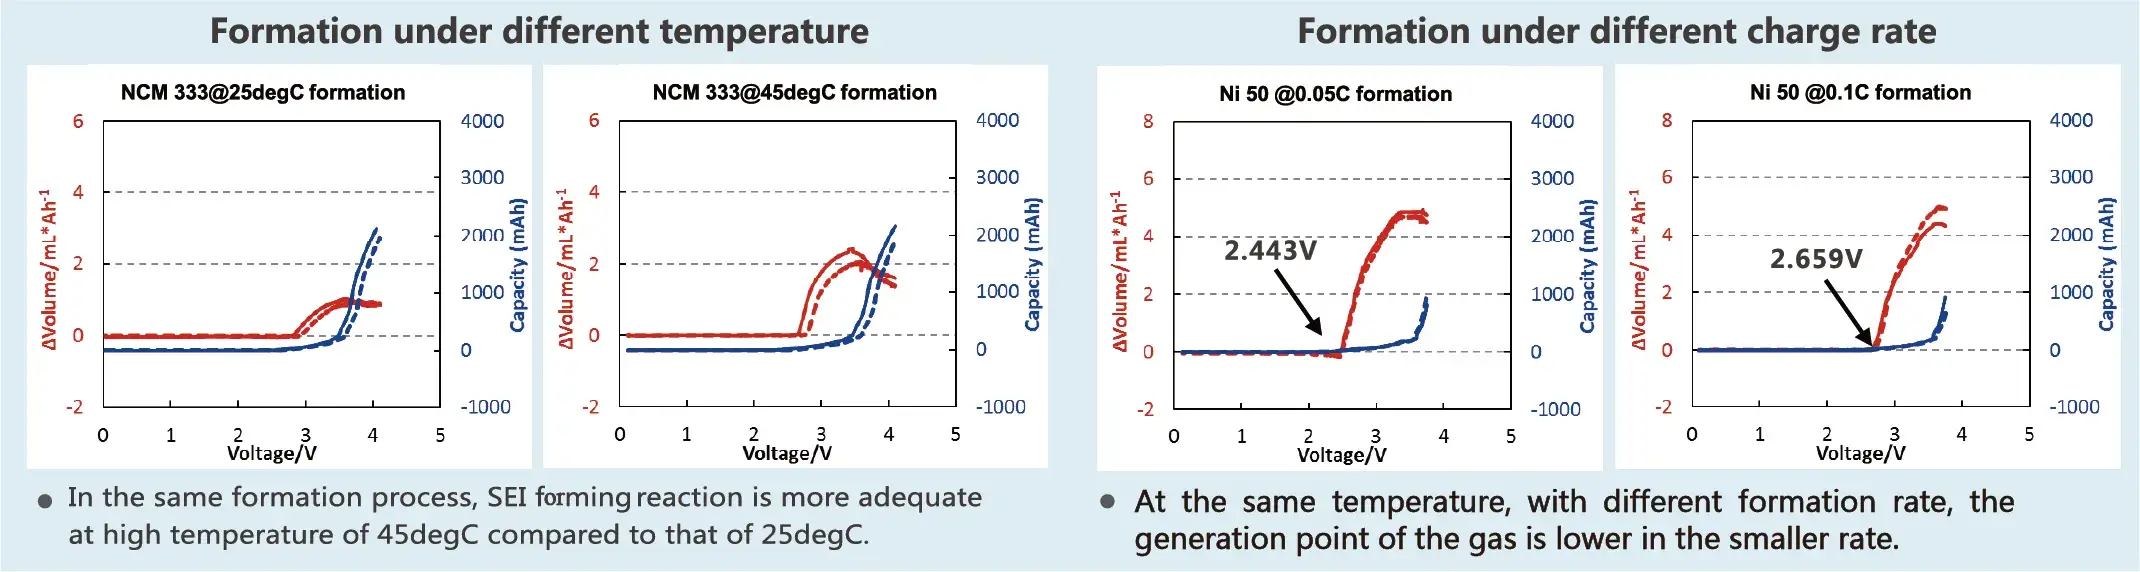
1.3 Different temperature and rate of formation conditions
2. Overcharge Gassing Analysis
2.1 NCM cells with different Ni contents
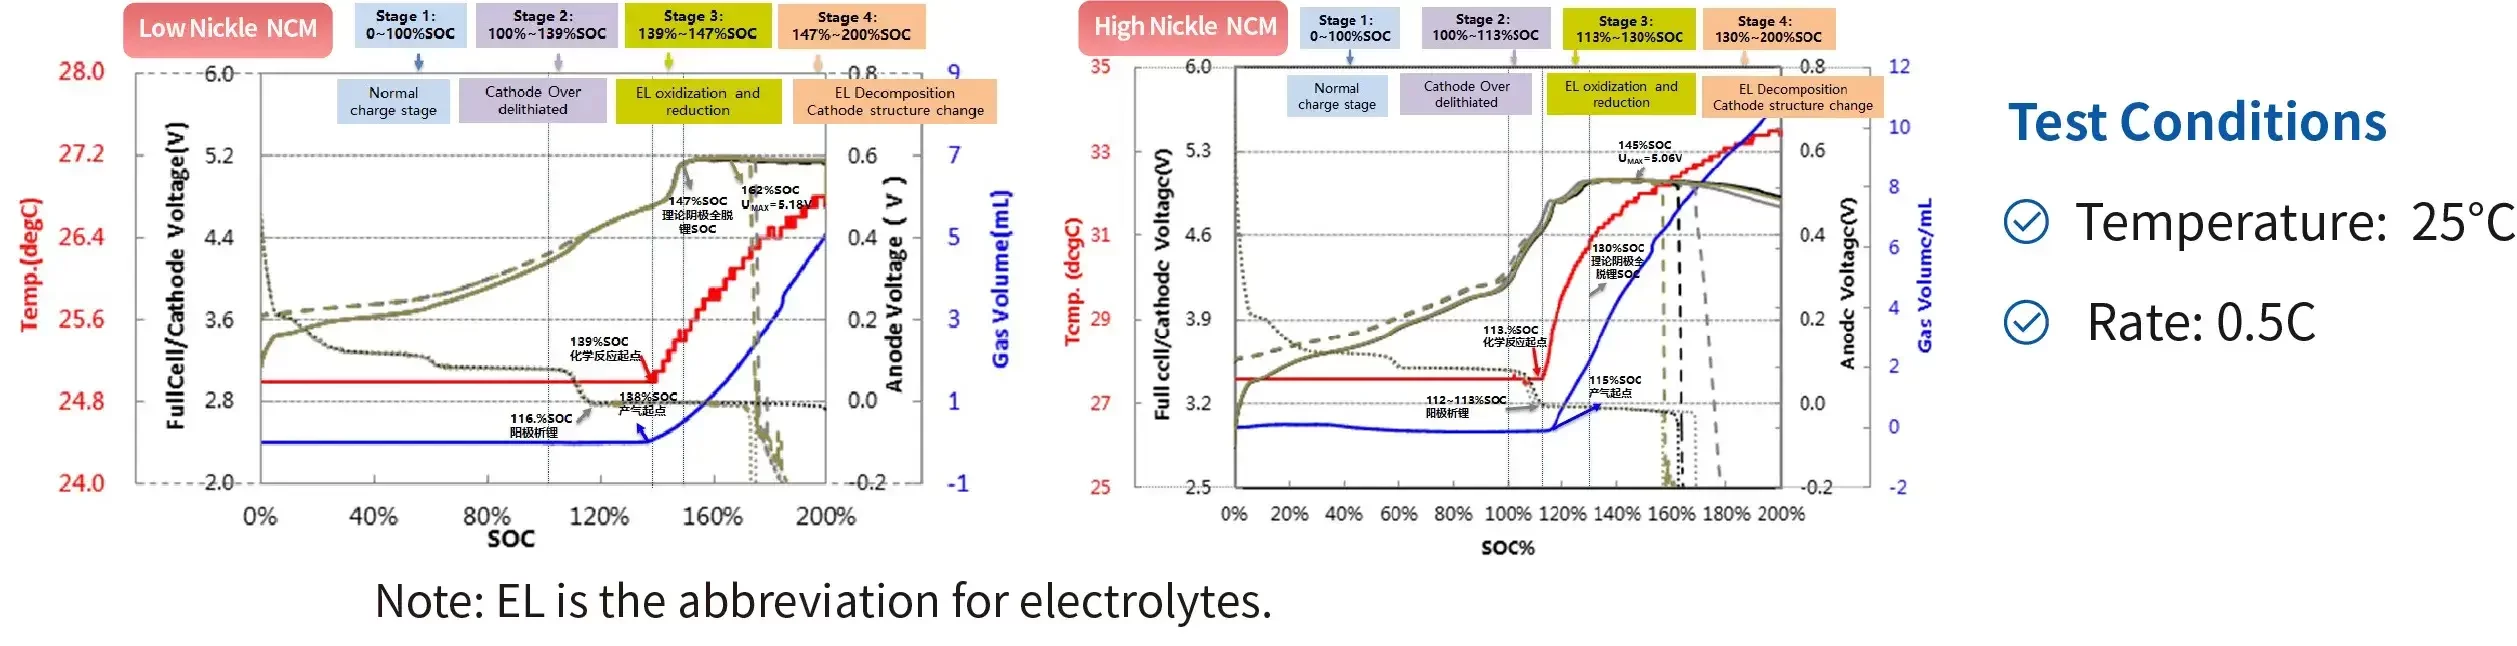
- Gassing & Temperature Surge: When overcharged to a specific potential, the slope of the volume change curve increases sharply, the cell surface temperature surges rapidly, and gas evolution begins instantaneously.
- Impact of Nickel Content: For ternary materials, as the nickel content increases, the gassing onset SOC shifts earlier from 138% to 115%.
- Mechanism & Performance Analysis: By monitoring volume and temperature variations during normal charging and overcharging, and correlating them with three-electrode potential profiles, key parameters—such as the onset potential and kinetics of massive side reactions, as well as the overcharge lithium plating potential—can be precisely identified. This quantitatively supports the analysis of material overcharge tolerance, enabling targeted optimizations and boosting R&D efficiency.
2.2 Cells with different cathodes and contents of electrolyte additives
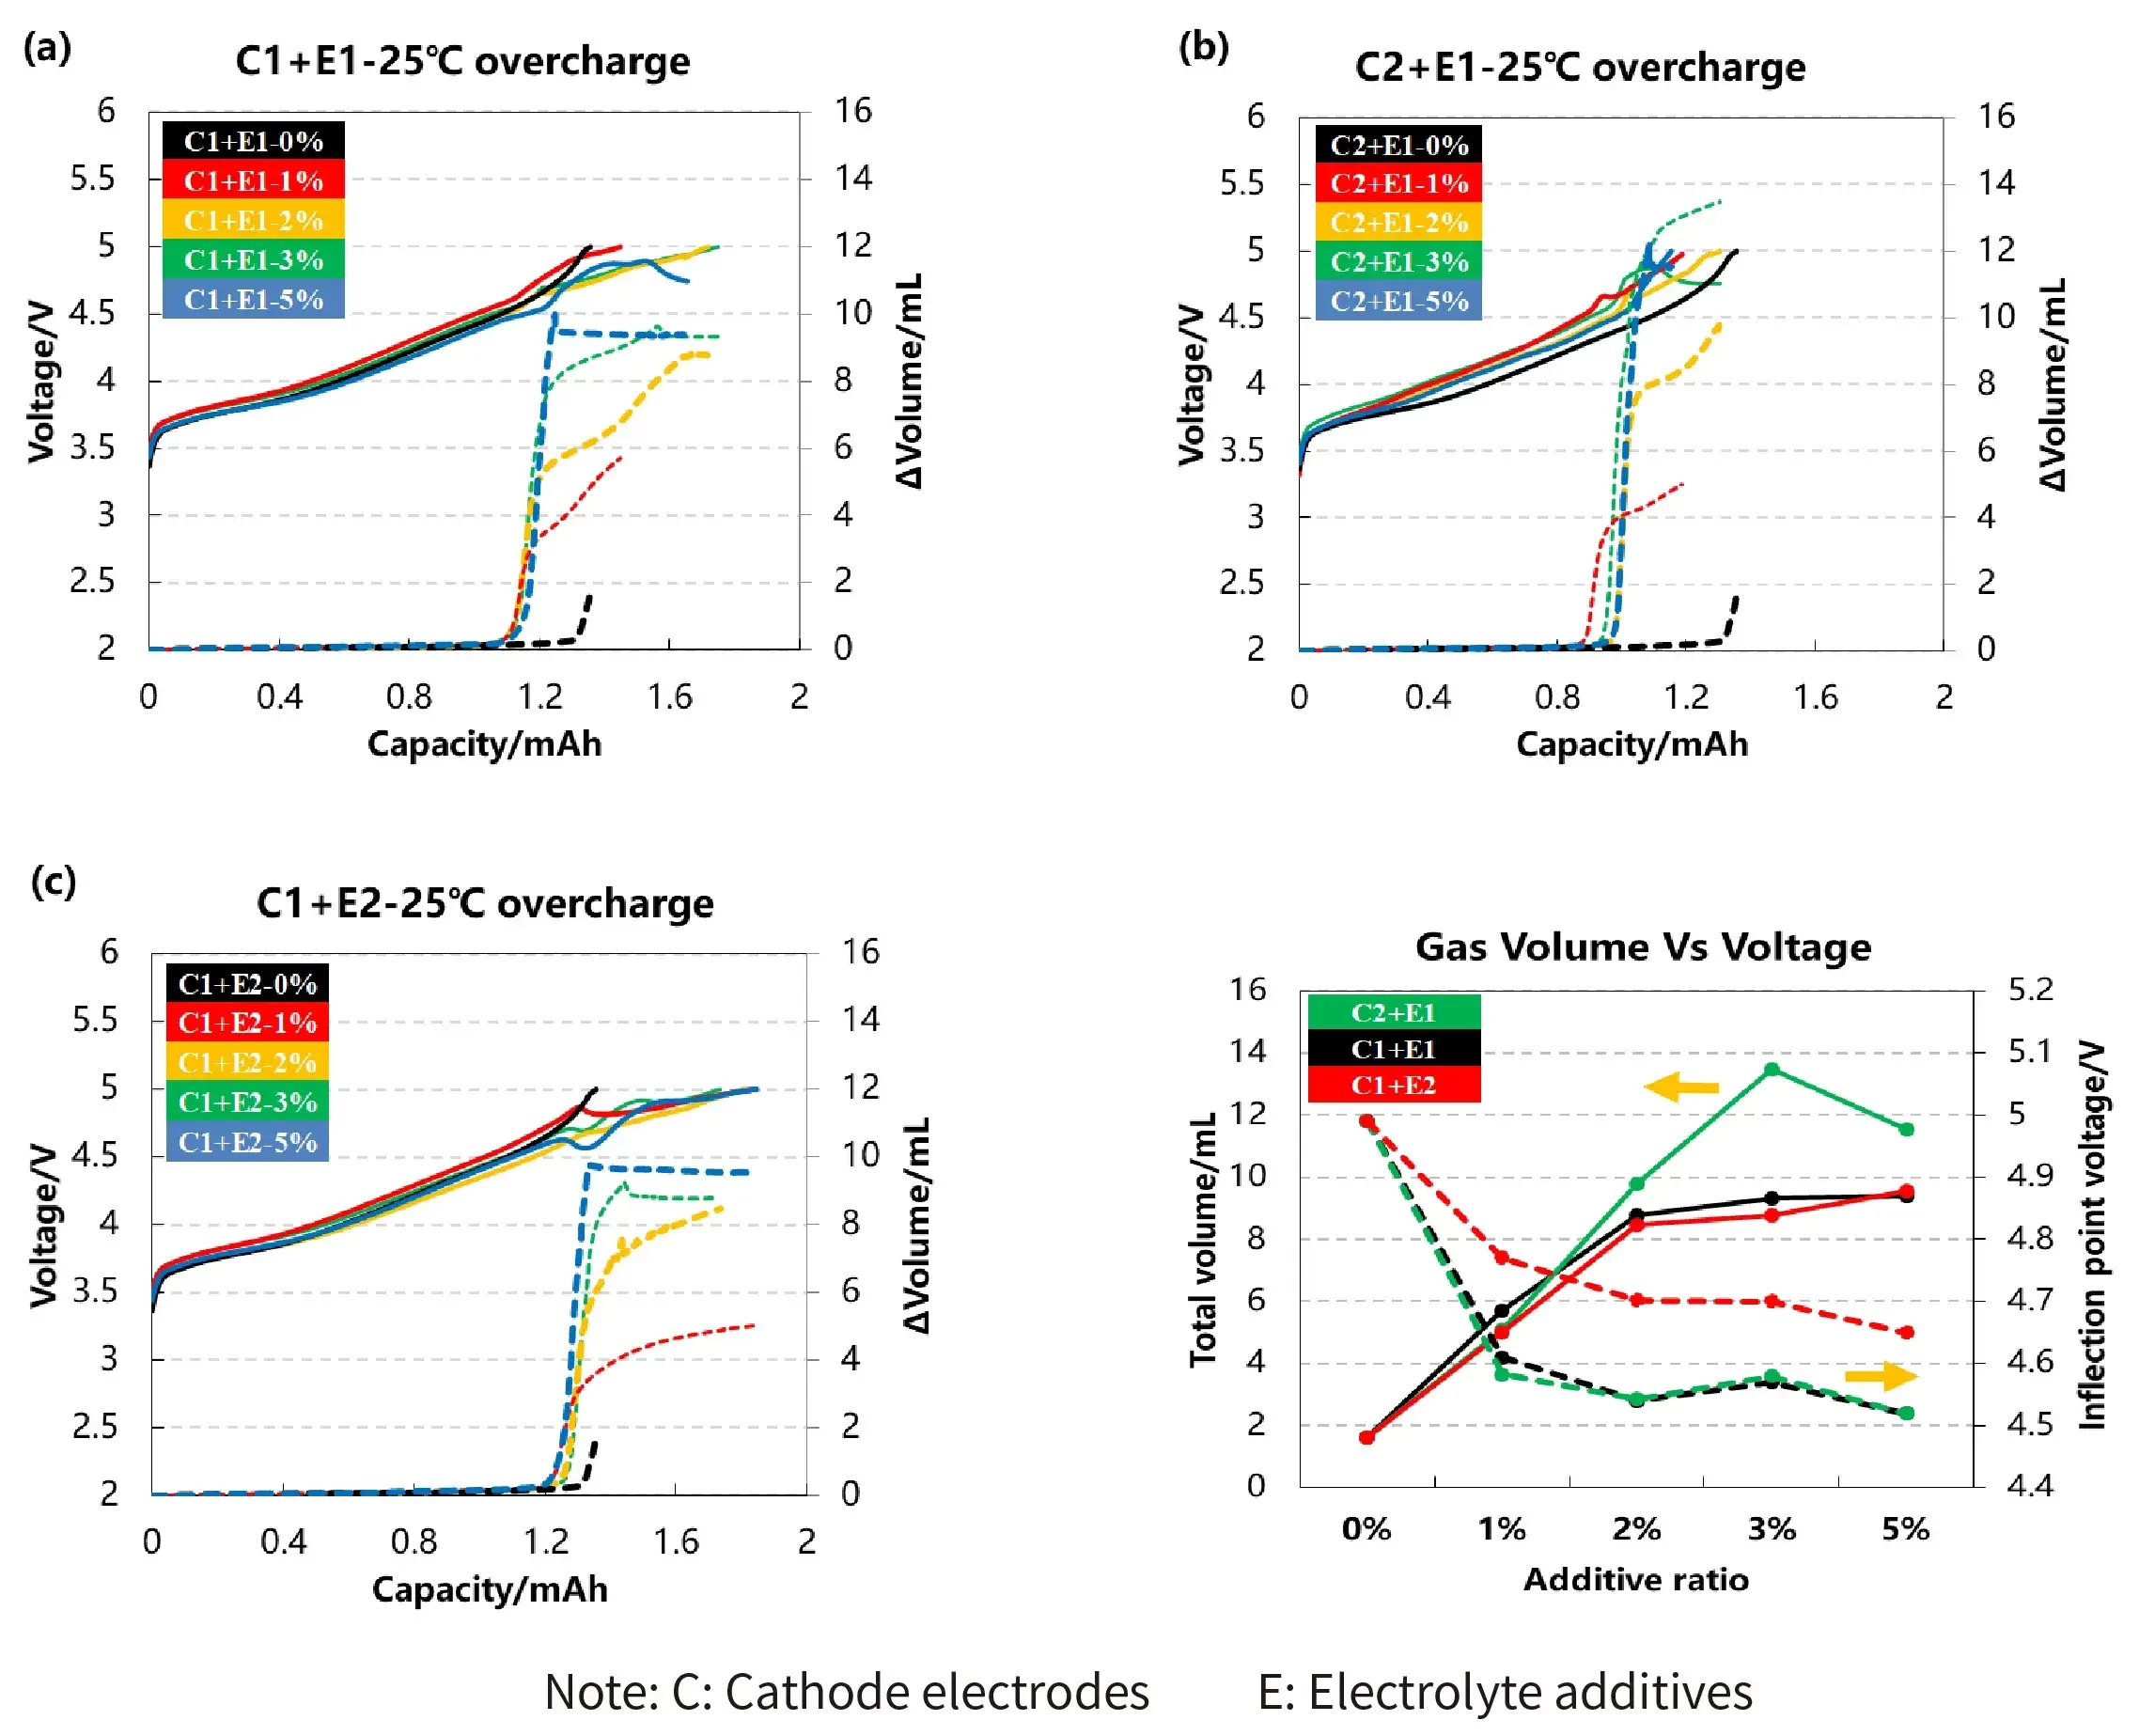
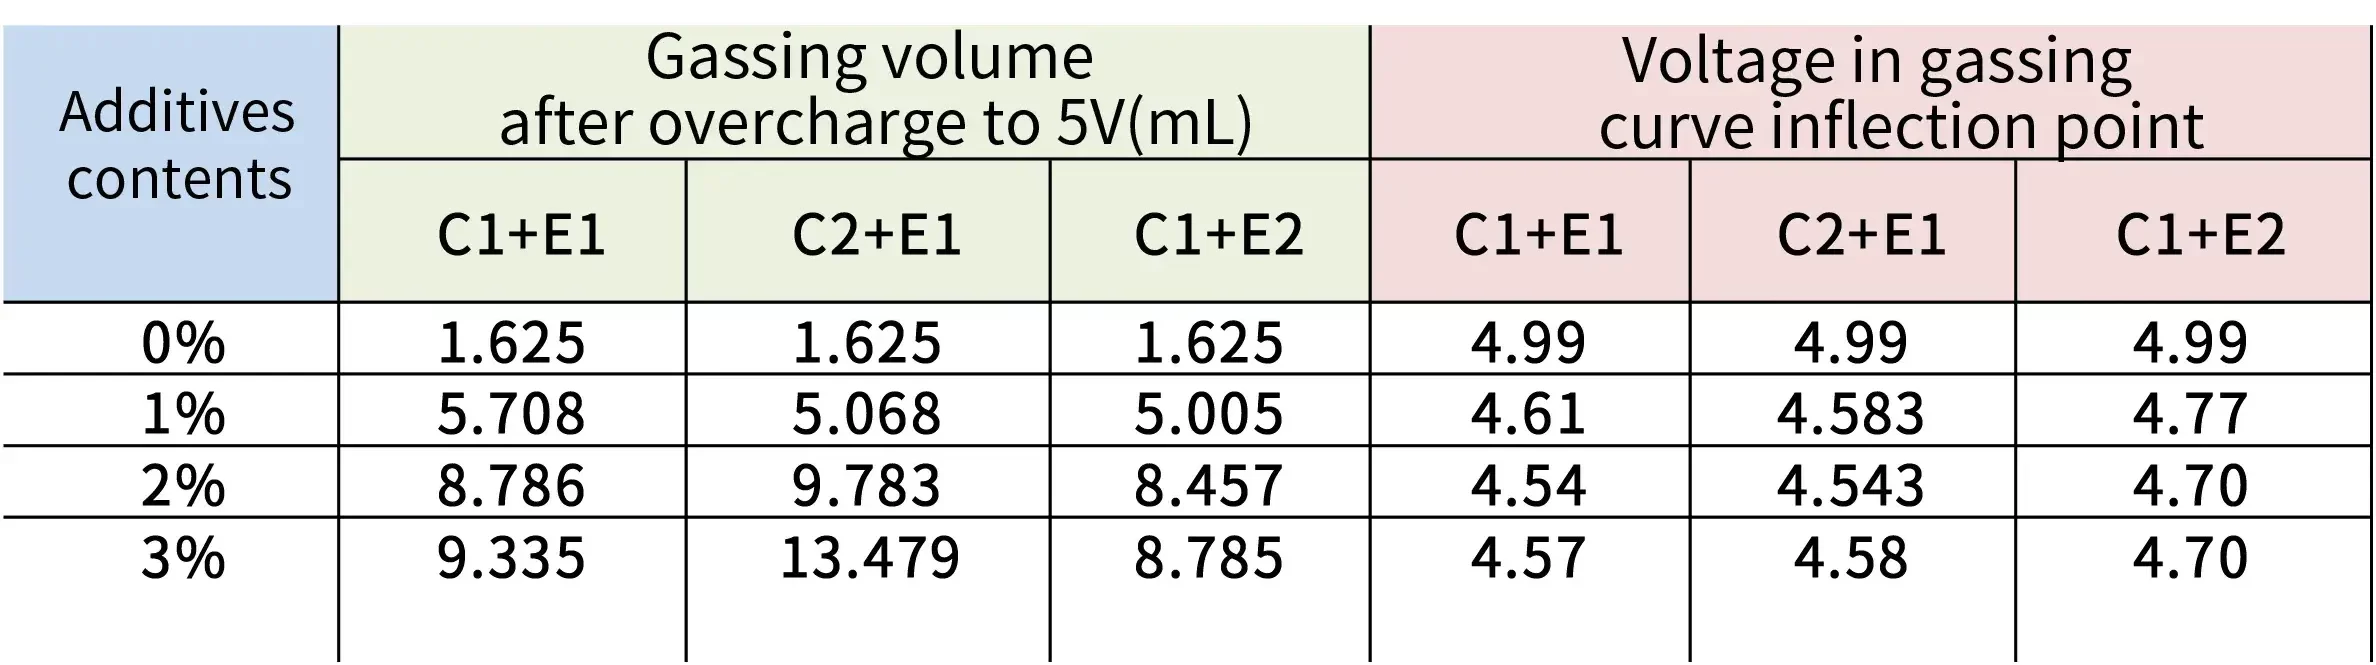
- Both cathode material types and electrolyte additive concentrations significantly influence total gas generation in cells, while the additive type dictates the gas evolution potential.
- Consequently, strategic selection of cathode materials, electrolyte additive types, and their concentrations enables modulation of overcharge-induced gassing behavior.
2.3 Overcharge and overdischarge of LFP batteries
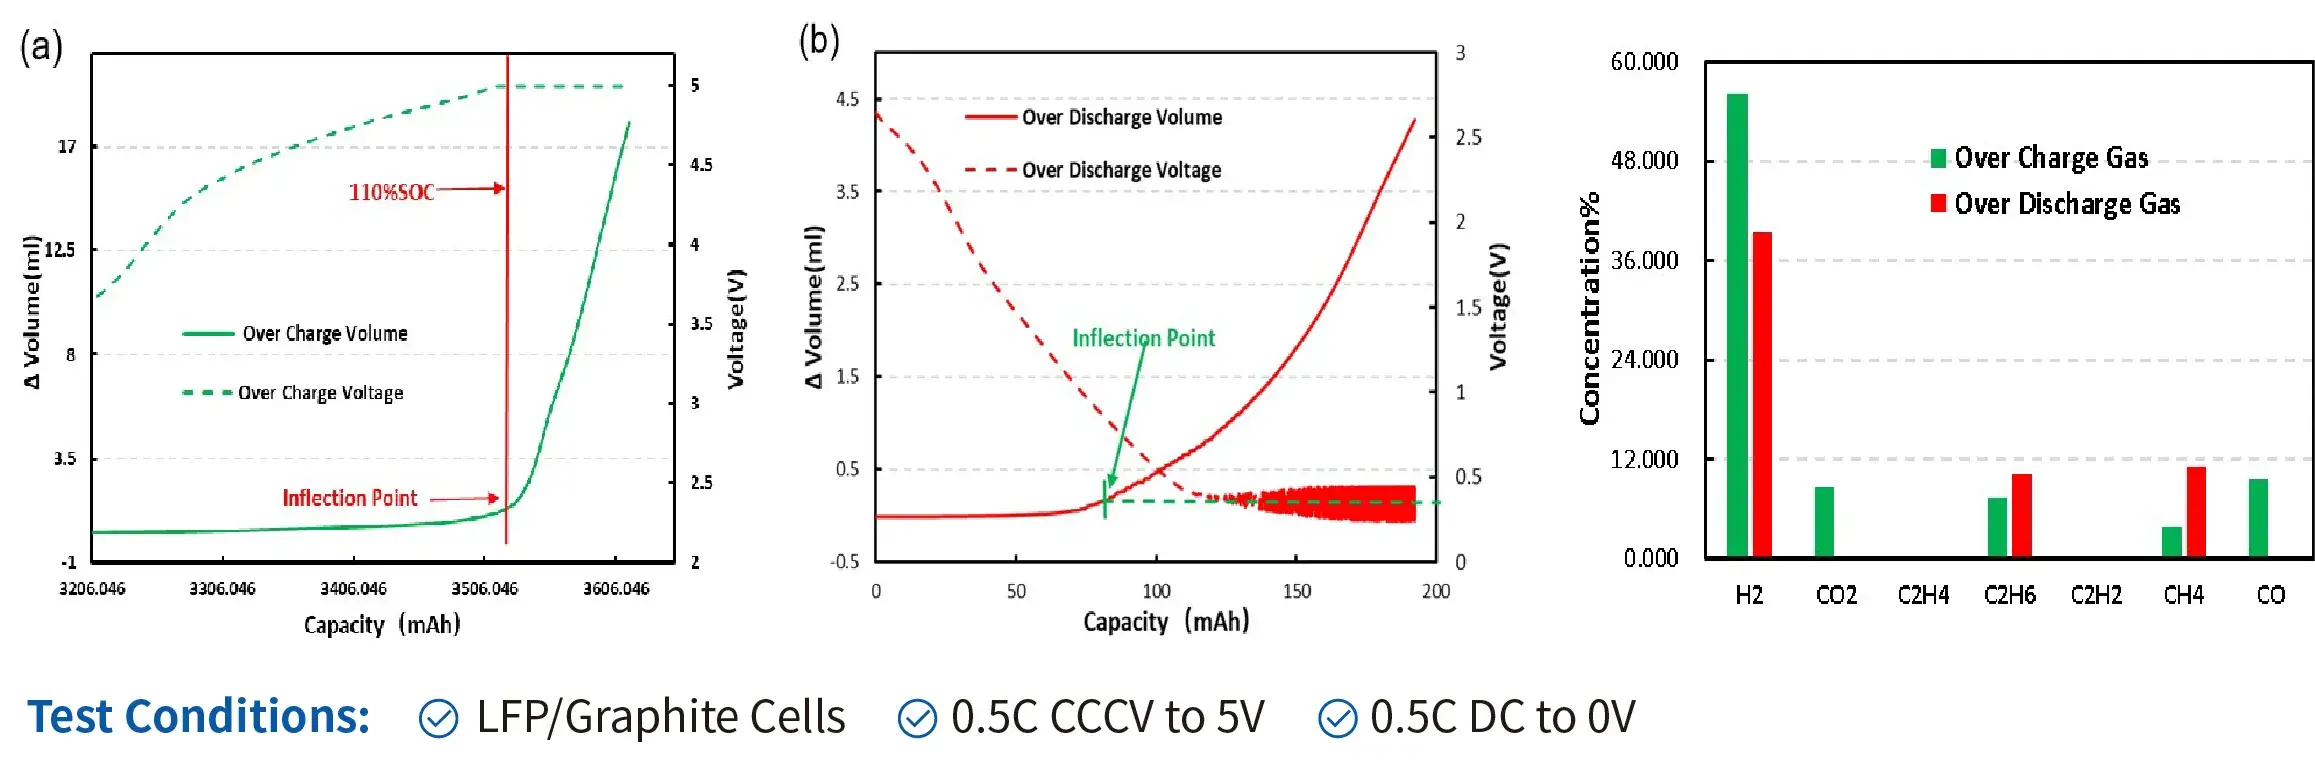
- As the cell is overcharged or overdischarged, the starting point of gas production can be detected in real time;
- Gas chromatography analyzes the gas composition under these two working conditions. in addition to the same gas type as the over-discharge cell, a relatively high content of CO and CO2 gas is also detected.
2.4 Different Overcharge C-Rates
-
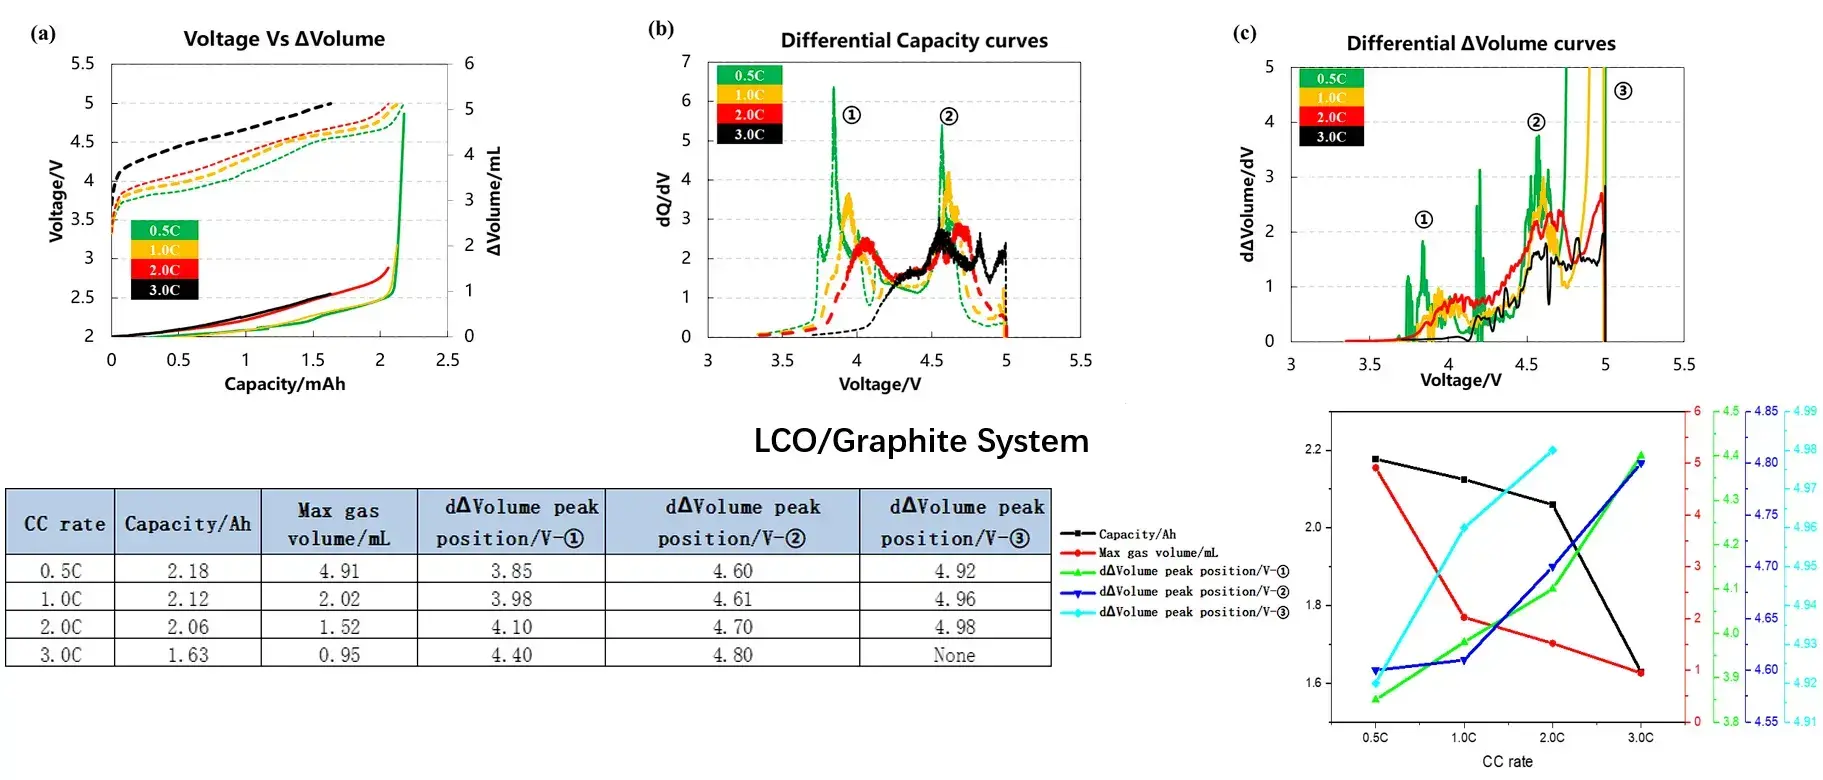
Effect of C-Rate on Gassing: As the charging C-rate increases, the cell capacity decreases, total gas evolution volume is reduced, and the gassing onset voltage shifts higher.
-
Electrolyte Formulation Optimization: Subsequently, integrating qualitative gas composition analysis can further elucidate the effects of different solvent and additive types and concentrations on cell overcharge gassing, assisting R&D researchers in developing safer and more reliable electrolyte systems.
3. Cycling Gassing Analysis
3.1 Cycle performance ofdifferent NCM cells
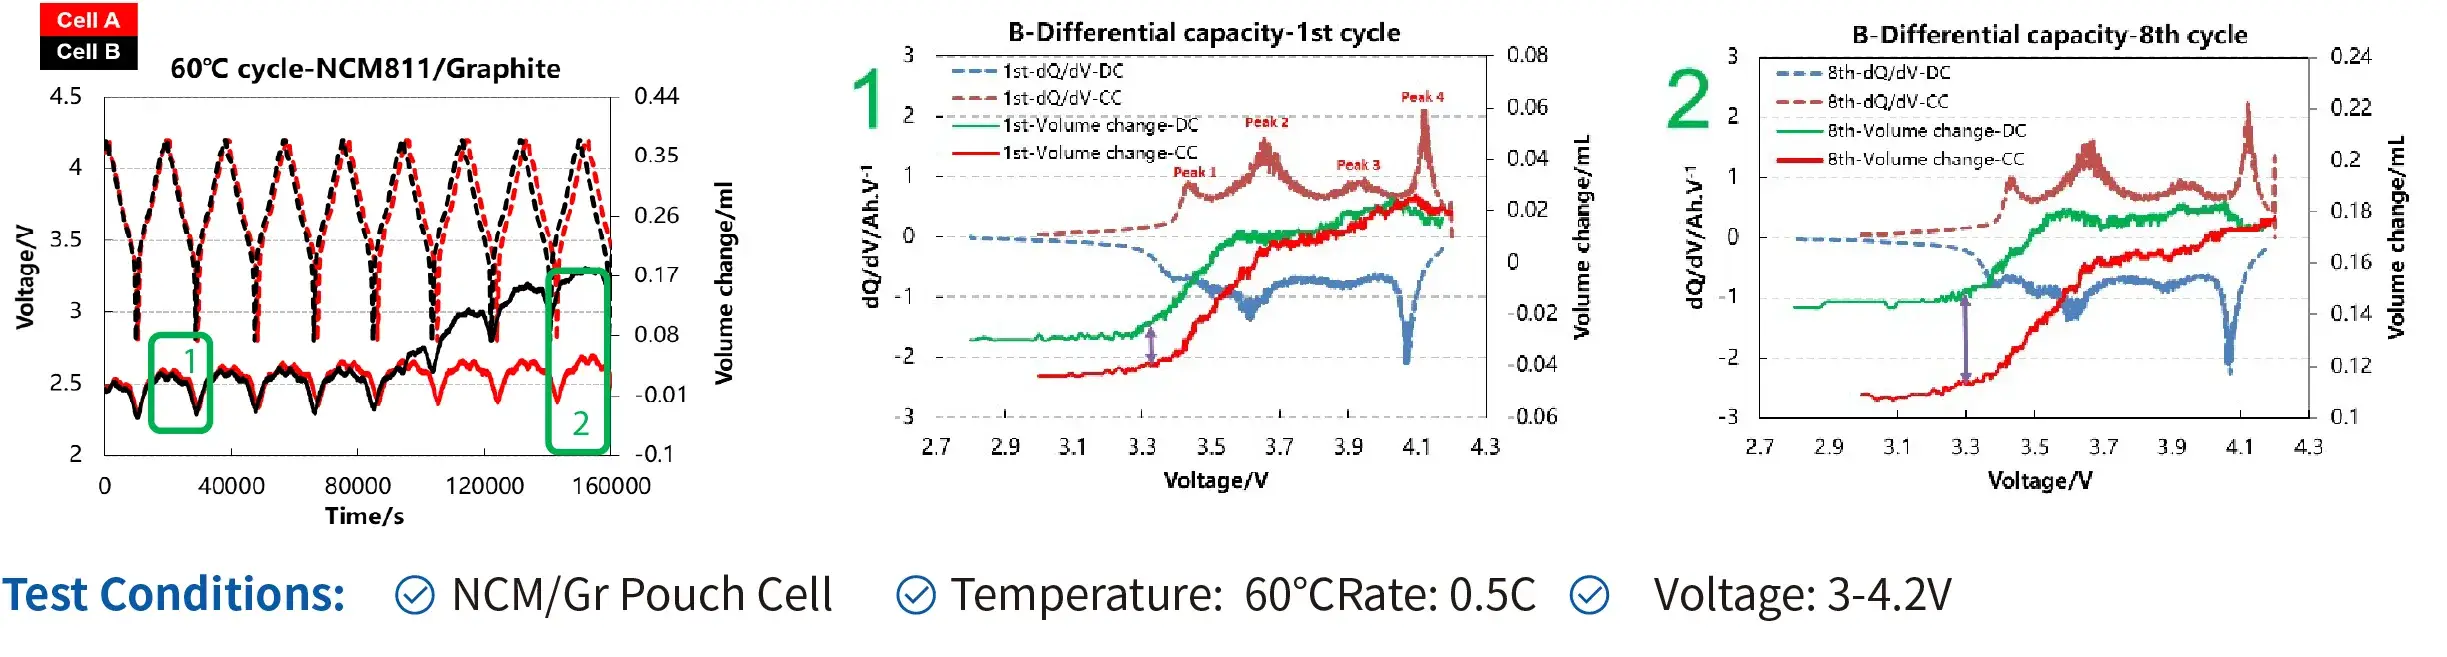
- Cell-A and Cell B are made by diferent NCM matemals. The volume change of Cell-B is larger than that of Cell-A during the long-term cycling and the irreversible volume change also increase from 0.01 mL to 0.04 mL.
- It can help to quantitatively analyze the cycling performance of diferent materials, modify the materials in a targeted manner, and improve the R&D efficiency.
4. Storage Gassing Analysis
4.1 Comparing NCM811 modified conditions
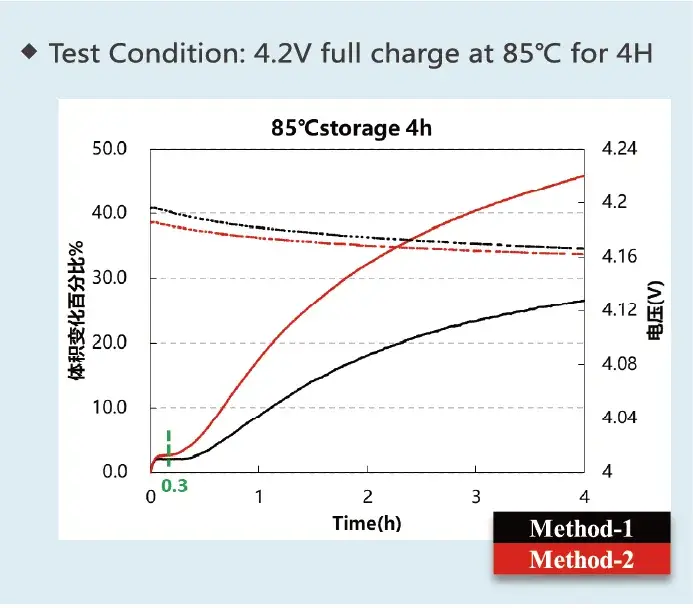
- At 85°C, both the voltage drop and the gas production of NCM811 modified by Method-1 arelarger than that of NCM811 modified by Method.
- It can used to compare the advantages of different modification methods of materials by using this in-situ method to continuously monitor the gas production during storage, which can help toimprove the efficiency of R&D.
4.2 Comparing different type of electrode
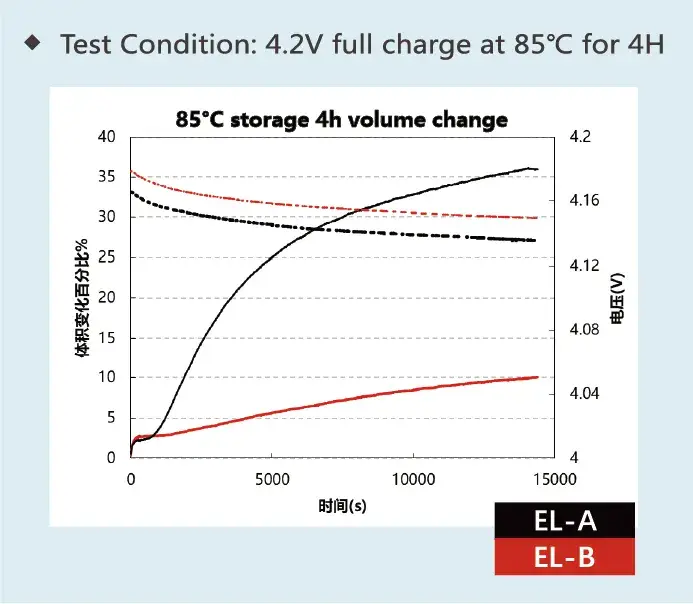
- Cell-A and Cell-B are made by different electrolyte systems. From the volume change curves during the full-charge storage, it can be found that Cell-A produce more gas than Cell-B, indicating that the electrolyte of EL-A is much easier to produce the gas under high temperatre and high voltage.
- Help to quantitatively analyze the gas evolution performance of different electrolytes, modify the electrolytes in a targeted manner, and improve the R&D efficiency.
4.3 Comparing different storage temperature
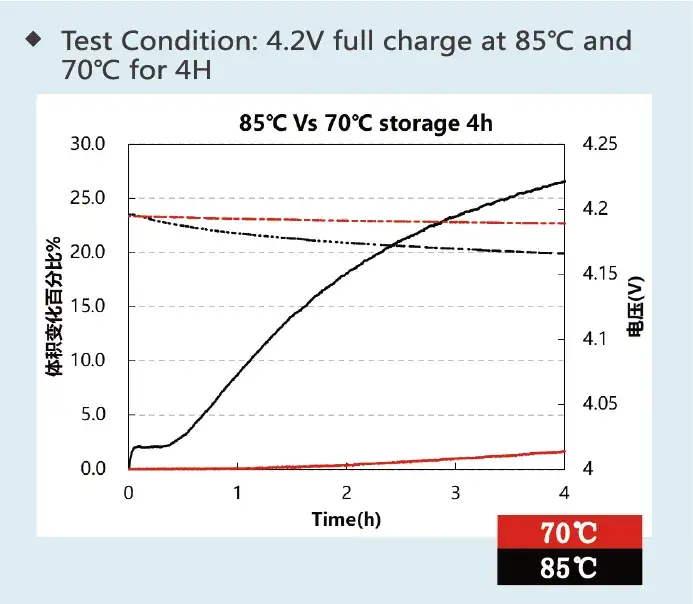
- This cell has better storage performance at 70°C, while it produce more gas at 85°C
- By using in-situ method to continuously monitor the gas production during, the storage point and maximum point of gas evolution can be obtained, which is helpful for researchers to carry out the next step of R&D work in a targeted manner.
5. Gassing Evolution from Silicon-based Slurries
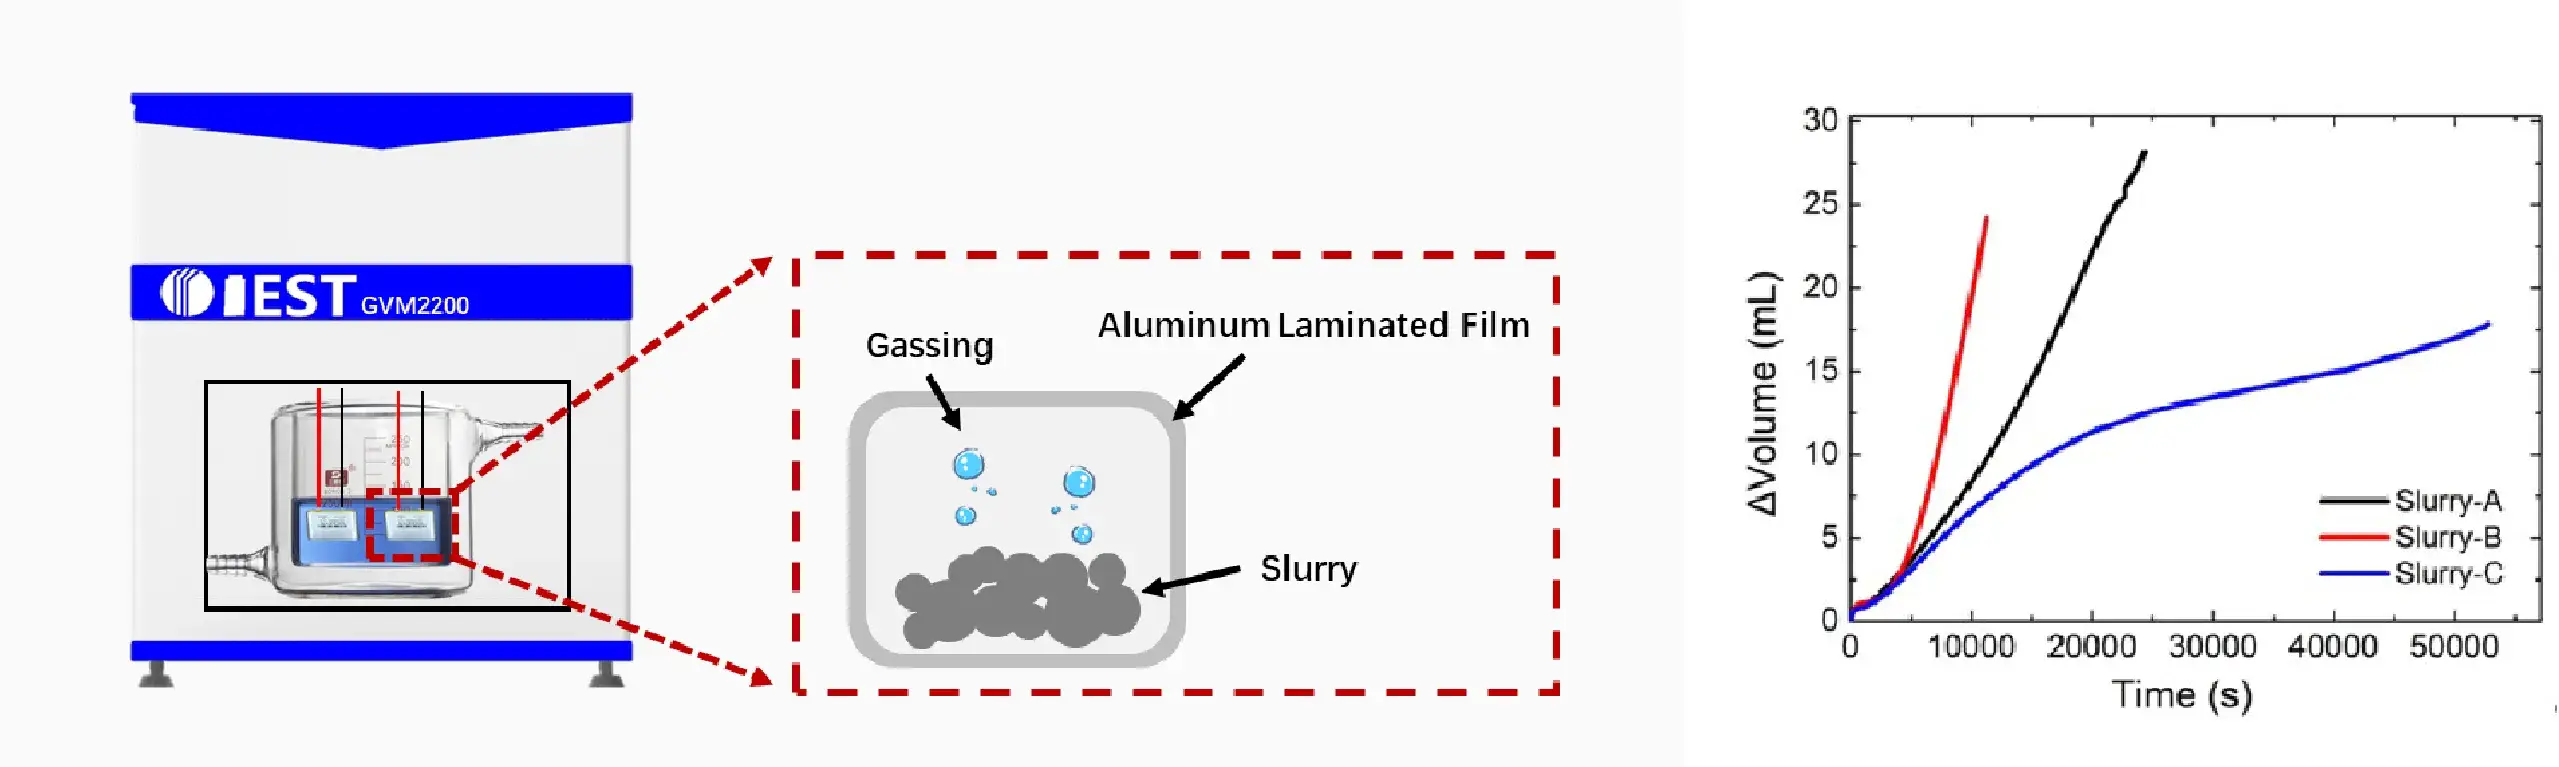
- Pre-magnesium or pre-lithiation treatment of silicon monoxide results in gas generation in the slurry.
- Lithium compensation additives in the cathode tend to decompose and generate gas during the actual slurry and lithium compensation process.
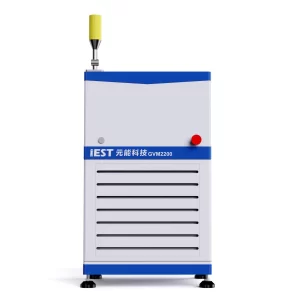
- IEST in-situ battery gassing analyzers (GVM2200) can be used to characterize slurry gas production in real time.
Video
Specifications
| Model | GVM2100 | GVM2200 | GVM2150 |
|---|---|---|---|
| Channels | Single channel (1 cell) | Dual channel (2 cells) | Single channel (1 cell) |
| Max Cell Mass (with fixture) | 1000g | 1000g | 5000g |
| Test Temperature | 20 ~ 85°C | ||
| Volume Change Resolution | 1 μl | 10 μl | |
| Volume Change Accuracy | ±10 μl | ±30 μl | |
| System Stability | ≤ 20 μl (RT, < 12h) | ≤ 50 μl (RT, ≤ 12h) | |
| Dimensions | 502*505*800 mm | ||
| Equipment Weight | 60kg | 70.5kg | 65kg |
| Maximum size of battery cell (excluding tabs): 220*180 mm (special size can be customized) | |||