-
iestinstrument
Entering Electrochemistry | EIS Diagnostic Testing for Lithium Battery Failure Analysis
1. Background: The Critical Role of EIS Diagnostic Test in Battery Failure Analysis
In investigations of energy storage station explosions or electric vehicle fires, “battery failure” consistently emerges as the root cause. Lithium-ion batteries fail through multiscale electrochemical degradation: electrode material collapse, lithium dendrite growth, SEI film thickening, and electrolyte decomposition. These microscopic changes manifest as capacity fade, internal resistance increase, and thermal runaway.
Traditional failure analysis methods face significant limitations: destructive testing prevents sample reuse, and static measurements miss dynamic degradation processes. Non-destructive methods that reveal these evolving failure modes are therefore essential. The EIS diagnostic test (electrochemical impedance spectroscopy) is uniquely suited to this task that provides a comprehensive “CT scan” of battery health, enabling precise lithium battery failure analysis.
2. EIS Diagnostic Testing: A Multi-Layered Approach to Battery Health Assessment
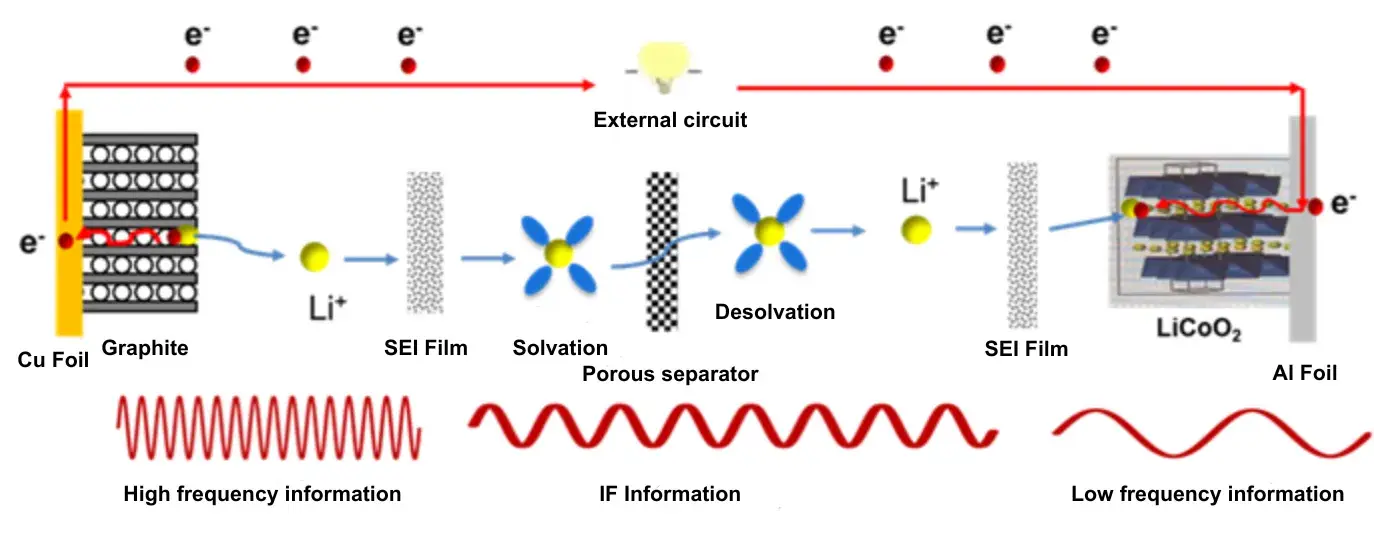
Electrochemical impedance spectroscopy battery testing uses small-amplitude perturbations across a broad frequency range to separate processes by their time constants—much like layered imaging:
-
High-frequency region (10,000–100 Hz): Identifies contact impedance issues at current collector/electrode interfaces, revealing mechanical defects such as poor tab welding or electrode layer separation
-
Mid-frequency region (1,000–10 Hz): Characterizes charge transfer impedance, diagnosing reaction kinetics degradation in active materials
-
Low-frequency region (10–0.01 Hz): Detects Warburg impedance changes, exposing lithium-ion diffusion blockage within electrodes

Figure 1. Electrochemical processes with different time constants inside a battery
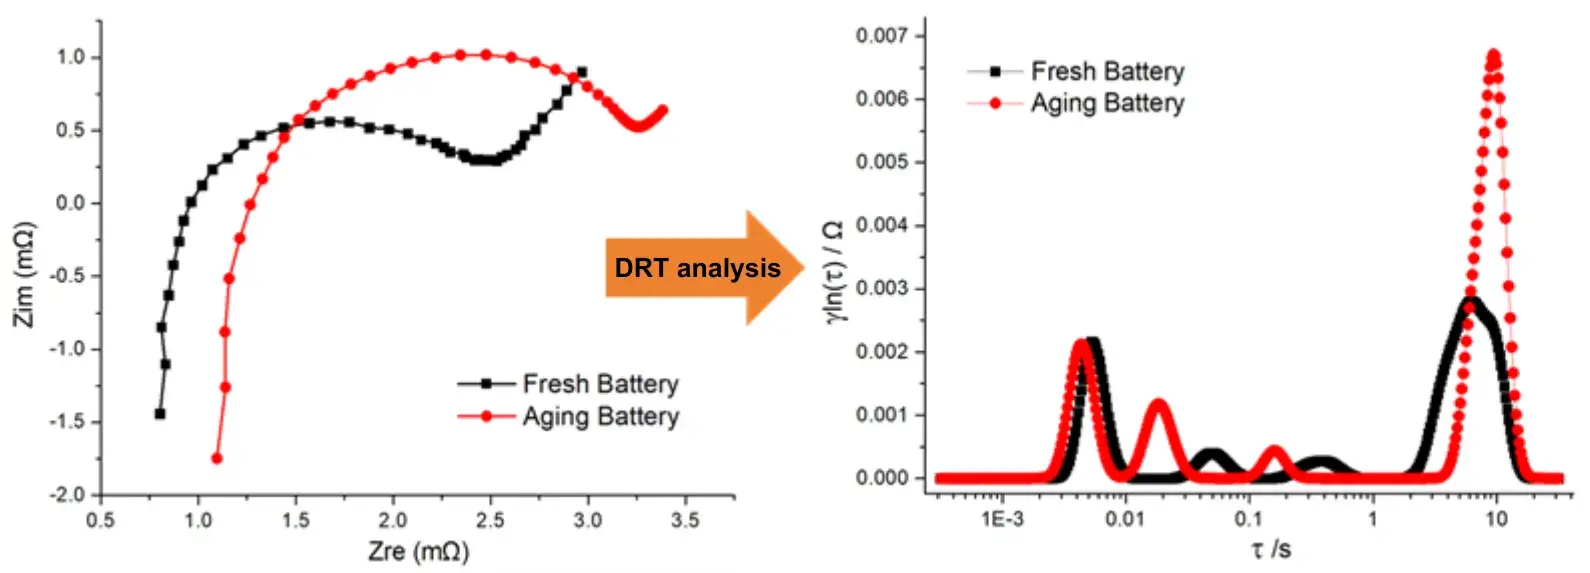
By fitting Nyquist data to equivalent circuits and applying Distribution of Relaxation Times (DRT), EIS diagnostic testing converts semicircles and slopes into meaningful parameters such as R_SEI and R_ct. These electrochemical fingerprints enable targeted lithium battery failure analysis—for example, identifying when a diffusion-limited slope signals graphite layer collapse or increased SEI thickness.

Figure 2. Distribution of Relaxation Times, DRT Analysis
3. From Laboratory to Industrial Application: Overcoming EIS Implementation Barriers
Despite extensive research (10,000+ publications), EIS diagnostic implementation faced significant industrial barriers:
-
Equipment limitations: Traditional potentiostats struggled with high-current testing for large-capacity batteries (>100 Ah)
-
Data complexity: Impedance spectra interpretation required specialized expertise unavailable to production line engineers
Industrial-grade EIS battery test systems (BIT6000 series) launched by IEST have overcome these challenges through three key innovations:
- High current technology: Increase the current test range to meet the EIS test of large-capacity batteries (>100Ah);
- Composite excitation technology: Use multi-frequency superposition technology to compress the original test time by more than half;
- Intelligent data processing technology: Combined with big data engine and machine learning algorithm, it can realize rapid data analysis, locate failure causes, automatic classification, etc., which is more suitable for production line engineers
4. The EIS+ Paradigm: Integrated Diagnostic Approaches for Comprehensive Failure Analysis
Advanced electrochemical impedance spectroscopy battery testing now integrates with complementary techniques, creating powerful diagnostic matrices:
- EIS+in-situ XRD: This combined technology can simultaneously observe the correlation between the phase change impedance and crystal structure evolution of NMC positive electrode materials;
- EIS+ultrasonic scanning: locate the hot spot of lithium deposition inside lithium-ion batteries through spatial mapping of acoustic impedance and electrical impedance;
- EIS+AI technology: The AI model trained based on a million-level impedance spectrum database can predict the remaining life (SOH) of the battery with an error of <3%
These technology combinations are building a “digital twin” system for battery failure analysis, allowing researchers to simulate the failure evolution path under different stress conditions in virtual space, and provide a theoretical foundation for the next generation of battery design that “failure prevention is more important than post-analysis”.
5. Practical Implementation Tips
-
Standardize test conditions: report cell state-of-charge, temperature, and current so impedance results are comparable.
-
Use DRT and model-agnostic analytics: avoid over-reliance on one equivalent circuit; DRT helps visualize overlapping processes.
-
Integrate with production QC: use rapid EIS screening to triage cells before final assembly; combine with mechanical and thermal tests for comprehensive QA.
-
Maintain a labeled spectral database: annotated spectra accelerate AI-driven diagnostics and fault classification.
6. Summary
Electrochemical impedance spectroscopy is evolving from an academic analysis tool into a robust industrial diagnostic test for lithium batteries. As EIS diagnostic testing scales into factories, its layered, non-destructive insights—especially when combined with DRT and AI—will become indispensable for reliable lithium battery failure analysis, improved quality control, and safer energy storage deployments. Decoding each semicircle and slope in an EIS spectrum is effectively reading the battery’s “vital signs”—and acting early on those signals can prevent costly or dangerous outcomes.
7. EIS Battery Testing Instruments Provider Recommend:IEST Instrument
Contact Us
If you are interested in our products and want to know more details, please leave a message here, we will reply you as soon as we can.


