-
iestinstrument

Abstract
1. Introduction: Why Separator Ionic Conductivity Matters
Lithium-ion intercalation, deintercalation, and side reactions including SEI growth and gas generation can generate internal pressure in battery cells. This pressure influences battery performance through interfacial effects on both electrodes and the separator.[1] The separator — which enables Li⁺ transport while preventing electronic contact between cathode and anode — is particularly affected by mechanical compression because its porous polymer structure deforms under load.
Studies have shown that the deformation-pressure curve of porous separators during compression follows three distinct stages:[2,3]
-
Stage I — Elastic: Reversible deformation; the separator rapidly restores its original morphology after pressure is released, maintaining unchanged ionic conductivity.
-
Stage II — Plastic: Irreversible pore collapse; ion transport capability is reduced and the separator fails to fully recover its initial microstructure after pressure removal.
- Stage III — Densification: Full pore closure; ionic conductivity is lost entirely as the porous structure collapses into a compact, non-porous body.
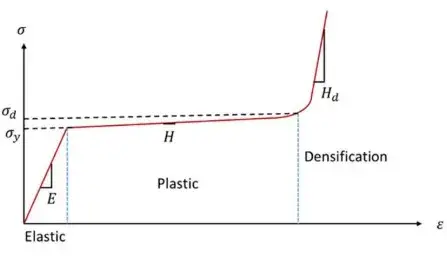
Figure 1. Battery separator compression stages — Stage I: elastic (reversible); Stage II: plastic (irreversible pore collapse, ionic conductivity reduced); Stage III: densification (pore closure, ionic conductivity lost) [2]
Quantitative data show that separator deformation reaches approximately 0.5 at 0–20 MPa and increases from 0.5 to 0.55 at 20–30 MPa. Over 0–12 MPa, ionic conductivity decreases linearly with applied stress; above 12 MPa, ionic conductivity decline accelerates before gradually stabilizing.[4] Different separator types show different rates of ionic conductivity decay with pressure. This study focuses on the 0–3 MPa range — relevant to typical battery module assembly preloads — to explore how pressure affects separator ionic conductivity in two commercial samples.
2. Experimental Setup and Ionic Conductivity Calculation
2.1 Test Instrument
The IEST Multi-channel Separator Ionic Conductivity Test System (EIC2400M) (Figure 2) was used. The system provides four independent test channels, supplies a high-purity argon atmosphere to prevent electrolyte oxidation during testing, and supports EIS (electrochemical impedance spectroscopy) measurement of multi-channel separator samples simultaneously. Pressure range: 10–50 kg; frequency range: 100 kHz–0.01 Hz.
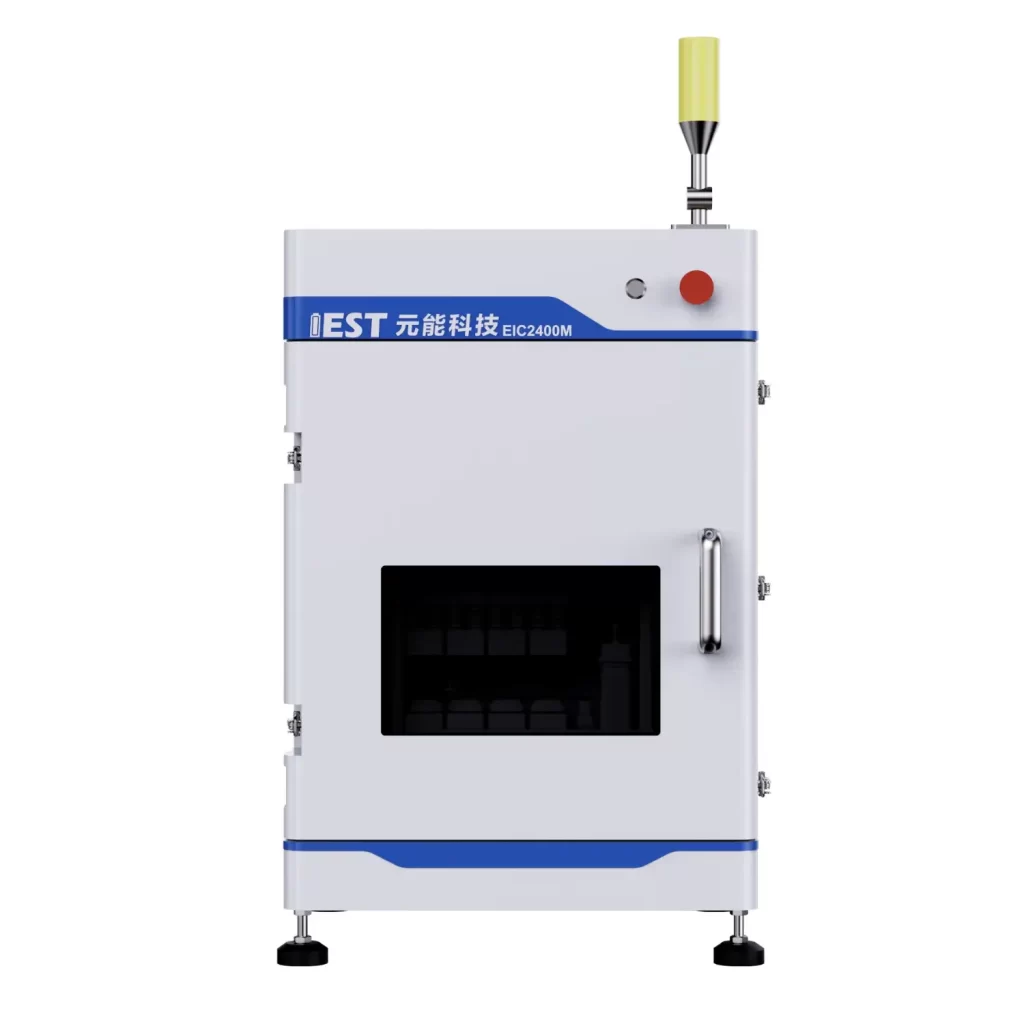
Figure 2. IEST EIC2400M Multi-channel Separator Ionic Conductivity Test System — 4 channels, argon atmosphere, 10–50 kg, 100 kHz–0.01 Hz frequency range for EIS-based ionic conductivity measurement
2.2 Test Samples
Two commercial separator variants (Separator A and Separator B) were tested. To extract through-thickness ionic resistance consistently and eliminate contact and fixture artifacts, each separator was measured as 1, 2, 3, and 4 stacked layers at each pressure — enabling linear fitting of resistance versus layer count to isolate the per-layer ionic resistance R.
2.3 Test Procedure
-
Mount 1–4 layers of separator in each EIC2400M channel; inject electrolyte and allow full wetting equilibration under argon atmosphere.
-
Apply the selected static preload (target pressure in the 0–3 MPa range) and allow mechanical equilibration.
-
Record EIS (100 kHz–0.01 Hz frequency sweep) and extract high-frequency real-axis intercepts to determine ionic resistance for each layer-count stack.
-
Repeat at several preset pressures from near-zero baseline up to the study’s maximum.
-
Fit ionic resistance R versus number of layers linearly to extract the per-layer ionic resistance R, then compute ionic conductivity σ using the calculation formula below.
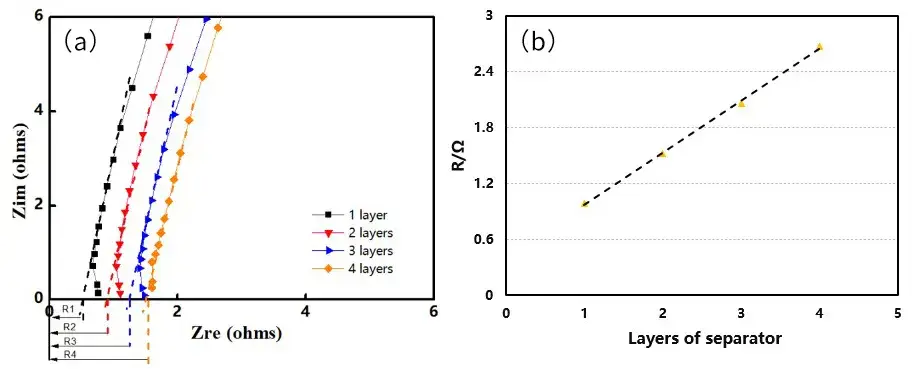
Figure 3. EIS impedance spectra for different separator layer counts (a) and R-versus-layers linear fitting diagram (b) — multi-layer stacking method isolates per-layer ionic resistance R from contact artifacts
2.4 Ionic Conductivity Calculation
Separator ionic conductivity σ is calculated from the fitted ionic resistance R using Equation (1):
\(\sigma = d / (R \cdot S)\) (1)
where \(\sigma\) = ionic conductivity (S/cm), \(d\) = thickness (cm), \(R\) = ionic resistance (\(\Omega\)), and \(S\) = electrode area (cm\(^2\)).
In practice:
-
Measure R by linear fitting of impedance-derived intercepts for stacks of different layer counts (this reduces contact and fixture contributions).
-
Use the physical thickness dd of a single separator layer (measured under the same pressure conditions if compression is significant).
-
Use the geometric electrode/separator contact area SS used in the test fixture.
In practice: R is obtained by linear regression of EIS-derived intercept values for stacks of 1–4 separator layers; d is the physical thickness of a single separator layer measured under the same pressure conditions; S is the geometric contact area of the test fixture. This multi-layer approach provides robust ionic conductivity calculation that minimizes systematic error from contact resistances and fixture effects — which can be significant when measuring thin, low-resistance separators.
3. Results Analysis
3.1 EIS Extraction Under Different Pressures
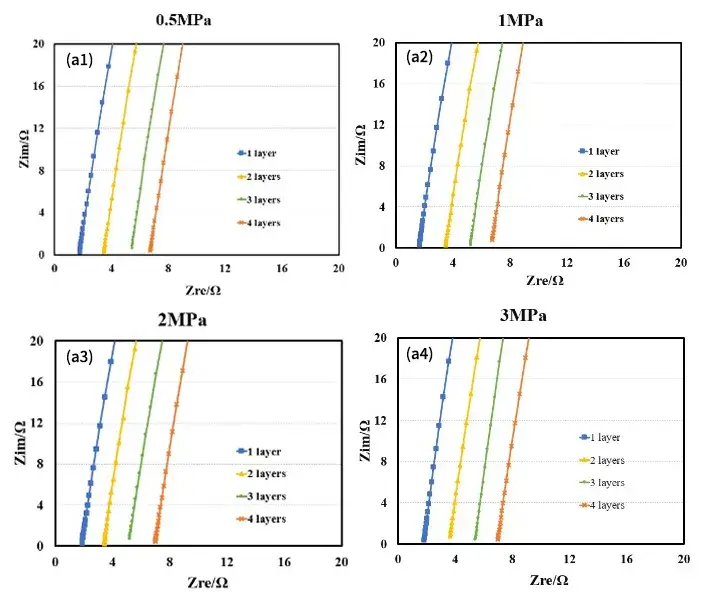
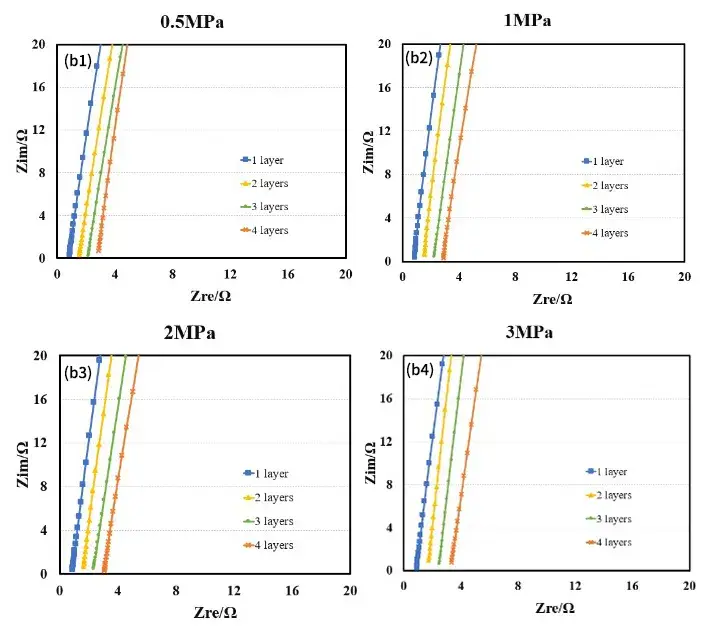
Figure 4. EIS spectra under different applied pressures — Separator A (a); Separator B (b). High-frequency intercept increases with pressure for both; Separator B shows a larger shift per MPa.
Figure 4 shows the EIS spectra for Separators A and B measured under different pressures. Using the baseline EIS for linear fitting, high-frequency real-axis intercept values R1, R2, R3, and R4 were recorded for 1–4 stacked separator layers at each pressure. Linear fitting of R versus layer count gave the per-layer ionic resistance R at each pressure. Substituting R into Equation (1) gives the ionic conductivity at each pressure, as shown in Figure 5 and Tables 1 and 2.
The key finding: ionic conductivity of both separators decreases approximately linearly with increasing compressive pressure from 0 to 3 MPa. The rate of decrease for Separator B is significantly greater than for Separator A. This demonstrates that separator ionic conductivity under compression is not a fixed material property — it depends on the applied pressure and the separator’s microstructural resistance to pore collapse.
| Pressure | 3MPa | 2MPa | 1MPa | 0.5MPa |
|---|---|---|---|---|
| Area/cm² | 1.5386 | |||
| Thickness/µm | 25 | |||
| 1 | 1.8000 | 1.8545 | 1.6334 | 1.7353 |
| 2 | 3.5580 | 3.3876 | 3.4352 | 3.4248 |
| 3 | 5.3743 | 5.0925 | 5.1979 | 5.3708 |
| 4 | 6.8625 | 6.9316 | 6.6666 | 6.6837 |
| R/Ω | 1.7204 | 1.6936 | 1.6862 | 1.6791 |
| \(R^2\) | 0.9990 | 0.9994 | 0.9999 | 0.9996 |
| \(\sigma\) (mS/cm) | 0.9445 | 0.9594 | 0.9636 | 0.9677 |
| Layers/Separator | 3MPa | 2MPa | 1MPa | 0.5MPa |
|---|---|---|---|---|
| Area/cm² | 1.5386 | |||
| Thickness/µm | 10 | |||
| 1 | 1.1570 | 1.1049 | 1.0493 | 1.0705 |
| 2 | 2.1678 | 2.0466 | 1.9302 | 1.9518 |
| 3 | 3.1906 | 2.8173 | 2.8746 | 2.7870 |
| 4 | 4.2339 | 3.9630 | 3.5911 | 3.5370 |
| R/Ω | 1.0253 | 0.9345 | 0.8570 | 0.8235 |
| \(R^2\) | 0.9999 | 0.9942 | 0.9970 | 0.9987 |
| \(\sigma\) (mS/cm) | 0.6339 | 0.6955 | 0.7584 | 0.7892 |
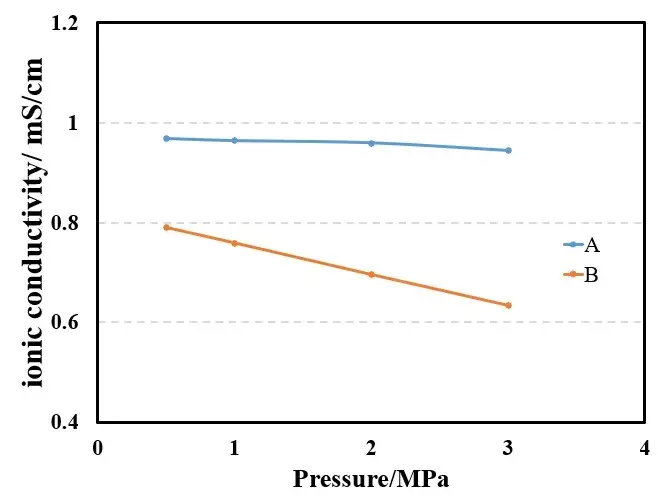
The porosity of the separator is the critical structural factor determining mass transport: it ensures sufficient Li⁺ ionic conductivity at zero or low compression. The data from this experiment confirm that mechanical pressure alters separator microstructure — reducing pore connectivity and volume — which hinders ion migration and thereby reduces Li⁺ ionic conductivity. The difference between Separator A and Separator B in pressure sensitivity reflects differences in their pore wall mechanical properties: stiffer pore walls resist collapse and maintain ionic conductivity better under compression.
4. Discussion: Mechanisms and Practical Implications
4.1 Mechanisms Behind Ionic Conductivity Loss Under Compression
-
Porosity reduction: Compression reduces pore volume and connectivity, raising tortuosity and reducing continuous liquid pathways for Li⁺ ions — the fundamental cause of ionic conductivity loss under pressure.
-
Pore constriction and closure: Narrowing or closure of transport channels increases the effective ion transport path length and effective ionic resistance, even before full pore closure (Stage III) is reached.
-
Contact changes: While the multi-layer stacking and linear fitting procedure minimizes contact artifacts, local contact area changes between the separator, current collector, and fixture under load can slightly affect apparent ionic resistance.
4.2 Why Some Separators Are More Pressure-Sensitive
Separators with thinner pore walls, higher initial porosity, or less mechanically robust polymer matrices compact more readily at low pressures and therefore lose ionic conductivity faster. Reinforced or microporous separators with higher elastic modulus resist pore collapse and maintain ionic conductivity better across the 0–3 MPa range typical of battery module assembly preloads.
4.3 Cell and Pack Design Implications
-
Module preload and spring design: Module clamping forces and spring pretension should be defined to avoid the pressure regime where separator ionic conductivity begins to degrade significantly — typically the onset of Stage II plastic compression for the selected separator type.
-
Battery model inputs: Electrochemical models should include pressure-dependent σ to correctly predict rate capability, cell resistance, and spatial state-of-charge gradients under pack compression and swelling.
-
Separator selection for high-power designs: For applications with high module preload or mechanically constrained assemblies, choose separators with demonstrated lower pressure sensitivity (stiffer microstructure or reinforced architecture).
-
Formation and cycling protocol control: Formation pressures and cell fixture loads should be reported alongside ionic conductivity data because they change the effective ionic conductivity baseline for the separator in situ.
5. Best Practices for Measuring Separator Ionic Conductivity Under Pressure
-
Use multi-layer stacking with linear fitting to remove fixture and contact artifacts and isolate per-layer ionic resistance R.
-
Measure actual separator thickness under load where possible — thickness compression directly affects the σ = d/(R·S) calculation and should be measured at the same pressure as the EIS test.
-
Control atmosphere and wetting: Run all tests in an inert (argon) atmosphere and allow full electrolyte equilibration before EIS to ensure complete pore wetting.
-
Report all test details: applied pressure, electrolyte composition, soak time, temperature, sample area, and layer count are all required for reproducible separator ionic conductivity measurement across laboratories and instruments.
-
Characterize the full \(\sigma(p)\) pressure curve over the expected operating pressure range for your cell and pack design — a single-point measurement at one pressure cannot capture pressure-dependent behavior.
6. Conclusion
This study demonstrates that mechanical compressive pressure substantially affects separator ionic conductivity in the 0–3 MPa range typical of battery module assembly. Using the IEST EIC2400M multi-channel separator ionic conductivity test system, ionic resistance was accurately measured by multi-layer EIS stacking and linear fitting, enabling precise ionic conductivity calculation via σ = d/(R·S). Both commercial separators showed linear ionic conductivity decline with pressure; Separator B exhibited significantly greater sensitivity than Separator A, reflecting differences in microstructural mechanical resilience. These insights can guide separator selection, inform battery module preload specification, and provide physically grounded inputs for pressure-dependent electrochemical modeling of high-power lithium-ion cells.
7. References
[1] Cui Jin, Shi Chuan, Zhao Jinbao. Research progress on the effect of mechanical pressure on the performance of lithium batteries[J]. Journal of Chemical Industry, 2021, 72(7): 3511-3523.
[2] Gioia G, Wang Y, Cuitiño A M. The energetics of heterogeneous deformation in open-cell solid foams[J]. Proceedings of the Royal Society of London Series A: Mathematical, Physical and Engineering Sciences, 2001, 457(2009): 1079-1096.
[3] Sarkar A, Shrotriya P, Chandra A. Modeling of separator failure in lithium-ion pouch cells under compression[J]. Journal of Power Sources, 2019, 435: 226756.
[4] Peabody C, Arnold C B. The role of mechanically induced separator creep in lithium-ion battery capacity fade[J]. Journal of Power Sources, 2011, 196(19): 8147-8153.
8. Lithium Battery Testing Solutions Recommend:IEST Instrument
IEST is a high-tech enterprise focusing on R&D and production of lithium ion battery tester. IEST is a professional manufacturer that integrating laboratory instrument R&D and production, method development, instrument sales and technical services. Committed to providing leading testing solutions and services for the global new energy field, IEST company serves key clients like CATL, BYD, Huawei, Svolt, GM, Leyden, Sintef, Factorial, Cabot, Cuberg.
9 FAQs
9.1 What is separator ionic conductivity and what is its unit?
Separator ionic conductivity (σ) is a measure of how readily Li⁺ ions transport through the separator membrane under the influence of an electrochemical potential gradient. Its SI unit is S/m (siemens per meter), but S/cm (siemens per centimeter) is conventional in battery literature. It is calculated using the formula σ = d/(R × S), where d is separator thickness (cm), R is the ionic resistance (Ω) measured by EIS, and S is the electrode contact area (cm²). A higher σ value means lower resistance to Li⁺ transport — which supports faster charging, better rate capability, and lower cell internal resistance. Separator ionic conductivity is not a fixed property; it depends on pore structure, electrolyte wettability, temperature, and, as this study demonstrates, applied compressive pressure. Typical values for commercial polyolefin separators in standard carbonate electrolyte range from approximately 0.5 to 2.0 mS/cm depending on separator type and measurement conditions.
9.2 How does compressive pressure affect separator ionic conductivity?
Compressive pressure reduces separator ionic conductivity by physically deforming the porous separator structure. Three compression stages are recognized. In Stage I (elastic), deformation is reversible and ionic conductivity is maintained. In Stage II (plastic), irreversible pore collapse reduces pore volume and connectivity, raising ionic resistance and reducing ionic conductivity proportionally — this stage produces a linear conductivity-pressure relationship in the 0–3 MPa range studied here. In Stage III (densification), pores close completely and ionic conductivity is lost. In this study, both commercial separators tested showed linear ionic conductivity decline across 0–3 MPa — in the Stage II plastic compression regime — with Separator B declining approximately twice as fast per MPa as Separator A. This difference reflects their different pore wall modulus and microstructural architecture. These results mean that battery module assembly preload directly affects the separator’s effective ionic conductivity during operation.
9.3 How is EIS used to measure separator ionic resistance and ionic conductivity?
EIS (electrochemical impedance spectroscopy) measures separator ionic resistance by recording the complex impedance of a symmetric cell (two identical blocking electrodes separated by the electrolyte-soaked separator) across a wide frequency range (e.g., 100 kHz–0.01 Hz). The separator ionic resistance R appears as the high-frequency real-axis intercept of the Nyquist plot. To minimize contact and fixture artifacts, the multi-layer stacking approach is recommended: measure R for 1, 2, 3, and 4 stacked separator layers, then fit R linearly versus layer count — the slope gives the per-layer ionic resistance. This per-layer R is substituted into σ = d/(R·S) to calculate ionic conductivity. The IEST EIC2400M system supports four-channel parallel EIS in an argon atmosphere, enabling simultaneous measurement of multiple separator samples at defined applied pressures and ensuring complete electrolyte wetting before testing begins.
9.4 What are the three stages of battery separator compression, and at which stage does ionic conductivity start to decrease?
Battery separator compression under increasing mechanical load follows three stages. Stage I (elastic) occurs at low pressure: the separator deforms reversibly, pore volume is largely maintained, and ionic conductivity is unchanged. The separator fully recovers after pressure is released. Stage II (plastic) occurs at intermediate pressure: pore walls begin to permanently deform and collapse, reducing pore volume and connectivity. Ionic conductivity decreases with pressure in this stage — in the linear range studied here (0–3 MPa), conductivity declined approximately linearly for both tested commercial separators. Stage III (densification) occurs at high pressure: pores close completely, the separator behaves as a dense solid, and ionic conductivity is essentially zero. In practical battery module assembly, preload forces should be controlled to remain within Stage I — or at most the early linear portion of Stage II — to avoid permanent ionic conductivity degradation.
9.5 How should separator ionic conductivity data be reported for accurate cross-laboratory comparison?
Separator ionic conductivity is a condition-dependent measurement, so reporting all test parameters is essential for meaningful comparison between laboratories or publications. The minimum required information includes: applied compressive pressure (or “zero pressure” with assembly force documented); electrolyte composition (solvent system, salt identity, and concentration in mol/L or M); temperature; soak time before EIS measurement; electrode contact area S; separator thickness d at the measurement pressure; number of layers measured and fitting method; and EIS frequency range and fitting method used to extract the real-axis intercept. Without these, two laboratories testing the same separator may report significantly different σ values simply due to differences in assembly pressure, incomplete wetting, or different fixture areas. The IEST EIC2400M‘s defined pressure range (10–50 kg) and argon atmosphere minimize wetting variability, but electrode area and exact pressure must still be specified for reproducible ionic conductivity calculation.
