

C.P. Aiken (first author) and J.R. Dahn (corresponding author) of Dalhousie University in Canada introduced a device for in-situ gas evolution testing of lithium-ion pouch cells to analyze the formation and initial charging of a ternary battery cell system. The gas production behavior observed during formation and discharge can distinguish the influence of different electrolyte additives on the volume change of the cell — the basis for the additive screening analysis in Section 3.3.
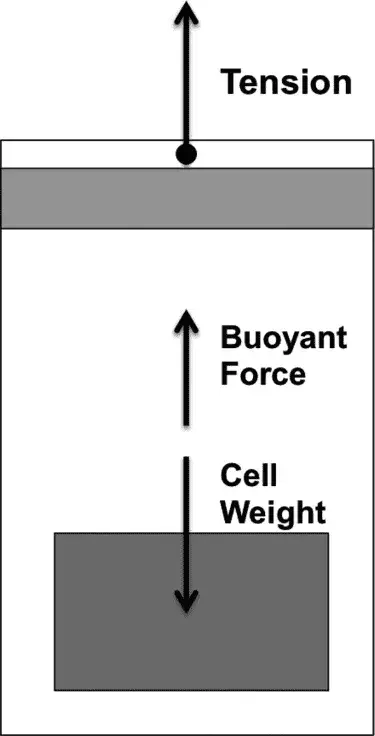
Figure 1. Schematic diagram of cell force in the in-situ gas evolution measurement setup
\[F_{buoyant} = \rho g V, \quad (1)\]
\[\sum F = F_{weight} + F_{buoyant} + F_{tension}, \quad (2)\]
\[\Delta F_{tension} = -\Delta F_{buoyant} = -\rho g \Delta V, \quad (3)\]
\[F_{tension} = m_{balance} g, \quad (4)\]
\[\Delta V = -\frac{\Delta m_{balance}}{\rho}, \quad (5)\]
Where $\rho$ is the density of the liquid, $g$ is the acceleration due to gravity, $V$ is the volume of the cell, $F_{tension}$ is the tensile force, and the mass is the balance reading. As the cell generates gas and its volume increases, the buoyant force increases and the measured tension correspondingly decreases — this relationship is what allows continuous, real-time gassing volume tracking without opening the cell.
The battery cell is suspended in a silicone oil liquid while the pulling force of the cell is measured, and the positive and negative tabs of the cell are connected to a Maccor Series 4000 charge/discharge system to synchronize formation cycling at an ambient temperature of 40.0 ± 0.1°C.
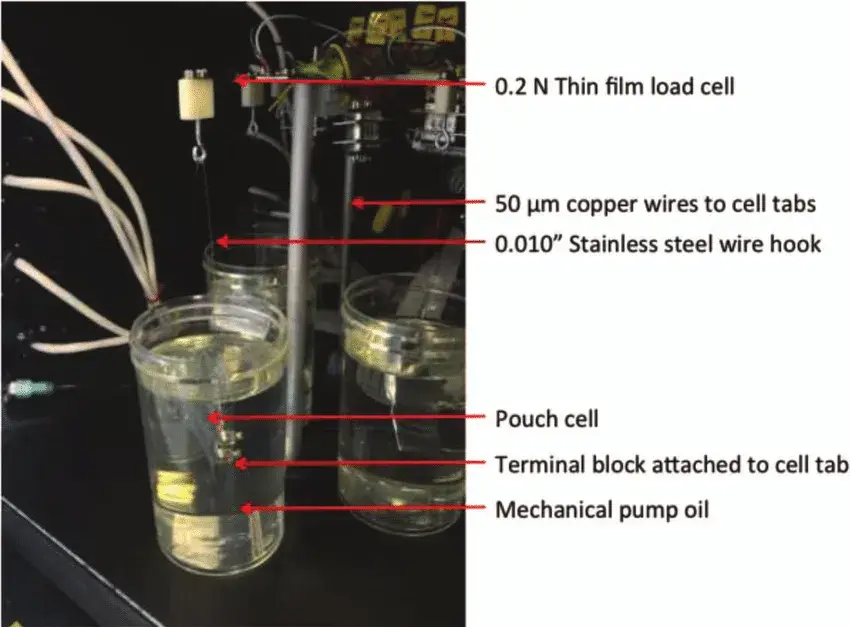
Figure 2. Archimedes In Situ Gas Analyzer (AISGA) with components labeled on one of the five testing channels
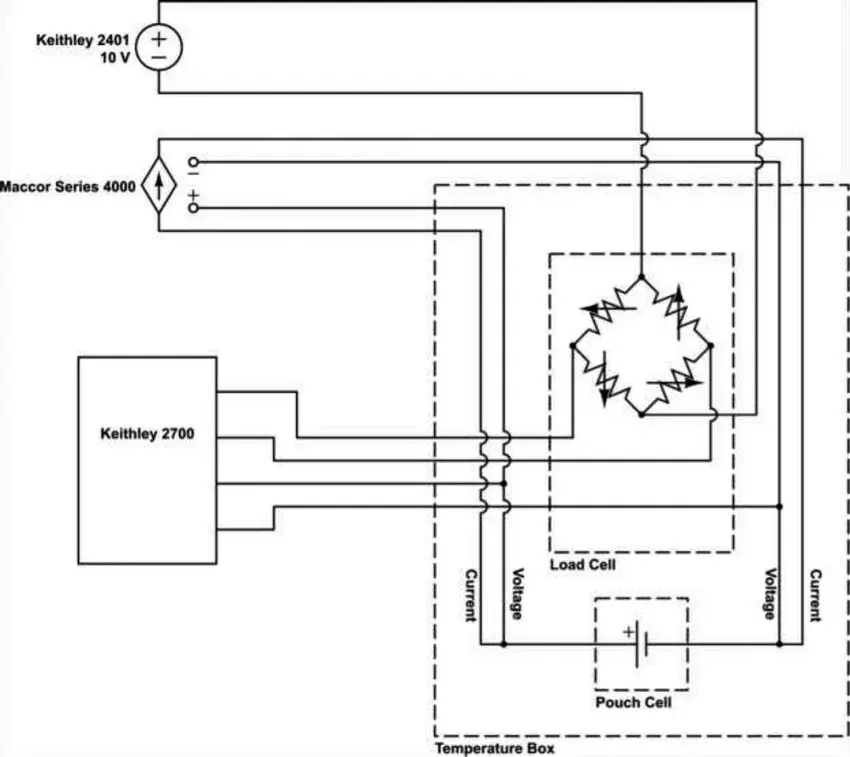
Figure 3. Physical diagram and circuit diagram of the in-situ measurement device
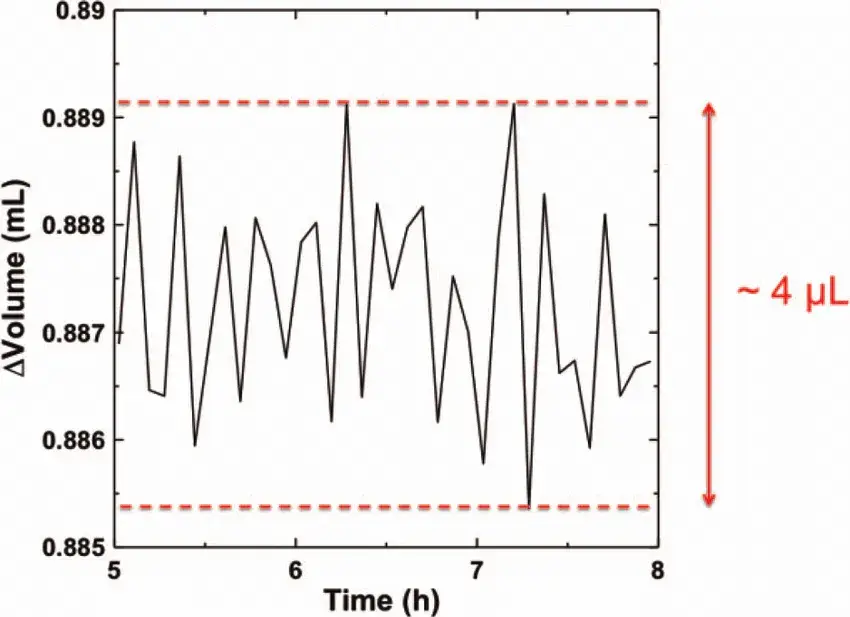
Figure 4. No-load noise of the in-situ gassing measurement equipment
Whether a fixture is present during cell formation affects both test repeatability and the trend of volume change over time:
| Condition | What Happens to Generated Gas | Observed Volume Trend |
|---|---|---|
| With fixture (clamped) | Gas is squeezed into the blank aluminum-plastic film bag on the side of the cell | No obvious downward trend in cell volume over time |
| Without fixture (unclamped) | Gas remains on the pole piece surface, where further reactions consume it | Cell volume decreases by approximately 0.1 mL as the gas is consumed |
Because fixture presence measurably changes the volume trend, its influence must be accounted for during experimental design — all subsequent tests in this study were conducted without a fixture.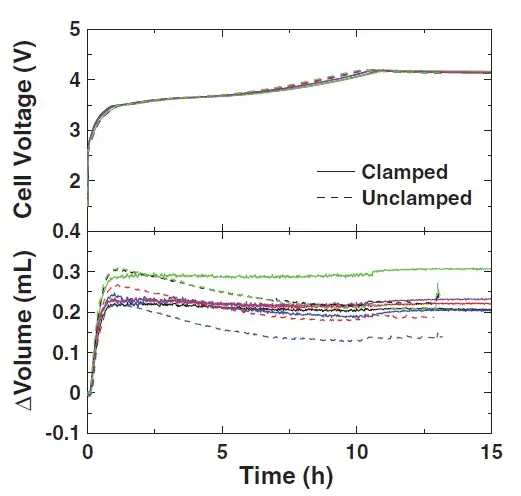
Figure 5. The effect of fixture presence on cell voltage and volume during formation
Comparing cell volume changes across four charge/discharge rate conditions during formation: cell volume reaches its maximum during the first charging process, then shows an overall decreasing trend as charge/discharge time increases — consistent with the first-generated gas reacting further and being consumed over time. A “sawtooth” pattern is also visible during charge/discharge cycling, mainly related to expansion and contraction of the pole piece as lithium is released and inserted. To capture more of this charge/discharge signal detail, the recommended cell C-rate for formation gassing tests is below C/3.
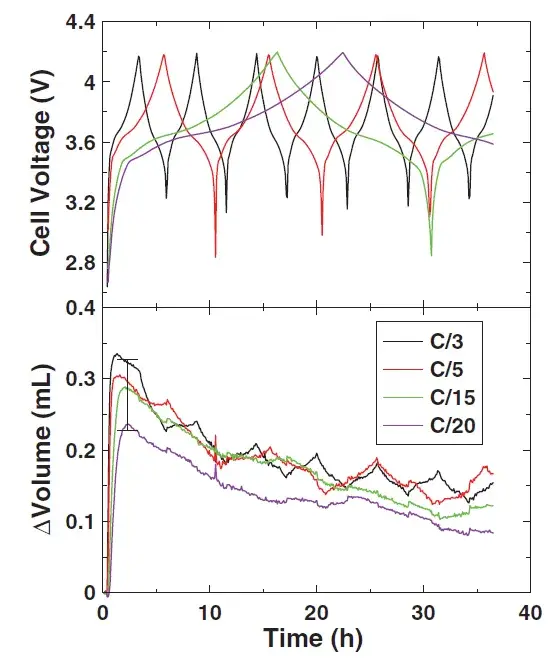
Figure 6. The influence of charge and discharge rate on cell voltage and volume
Whether the bare cell has been vacuum-dried for a sufficient time before electrolyte injection is a key factor affecting residual cell moisture. Comparing gas production between VC and VEC additive conditions, cells containing moisture (insufficient vacuum drying) show greater formation gas production than properly dried cells.
| Electrolyte Condition | Relative Formation Gas Production | Interpretation |
|---|---|---|
| VEC only | Highest | VEC produces significant gas when it reacts during formation |
| Blank electrolyte (no additive) | Moderate | Baseline gas production without additive influence |
| VC only | Lower than blank | VC actively suppresses gas production relative to no additive at all |
| VC + VEC combined | Lowest of the additive-containing conditions | VC inhibits the gas-producing reaction of VEC when added together |
| 2% VC + 2% PES (best combination) | Minimum among all 14 tested additives | The overall best-performing combination for minimizing formation gassing in this study |
By comparing gas production volume curves across additive types, this in-situ gassing methodology can also be used more broadly to screen suitable electrolyte additive combinations before committing to full-scale cell production.
Table 3. The additives and their abbreviations as used in this study
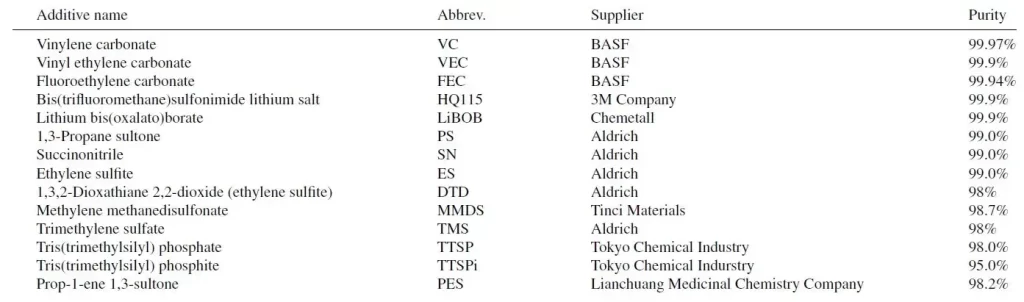
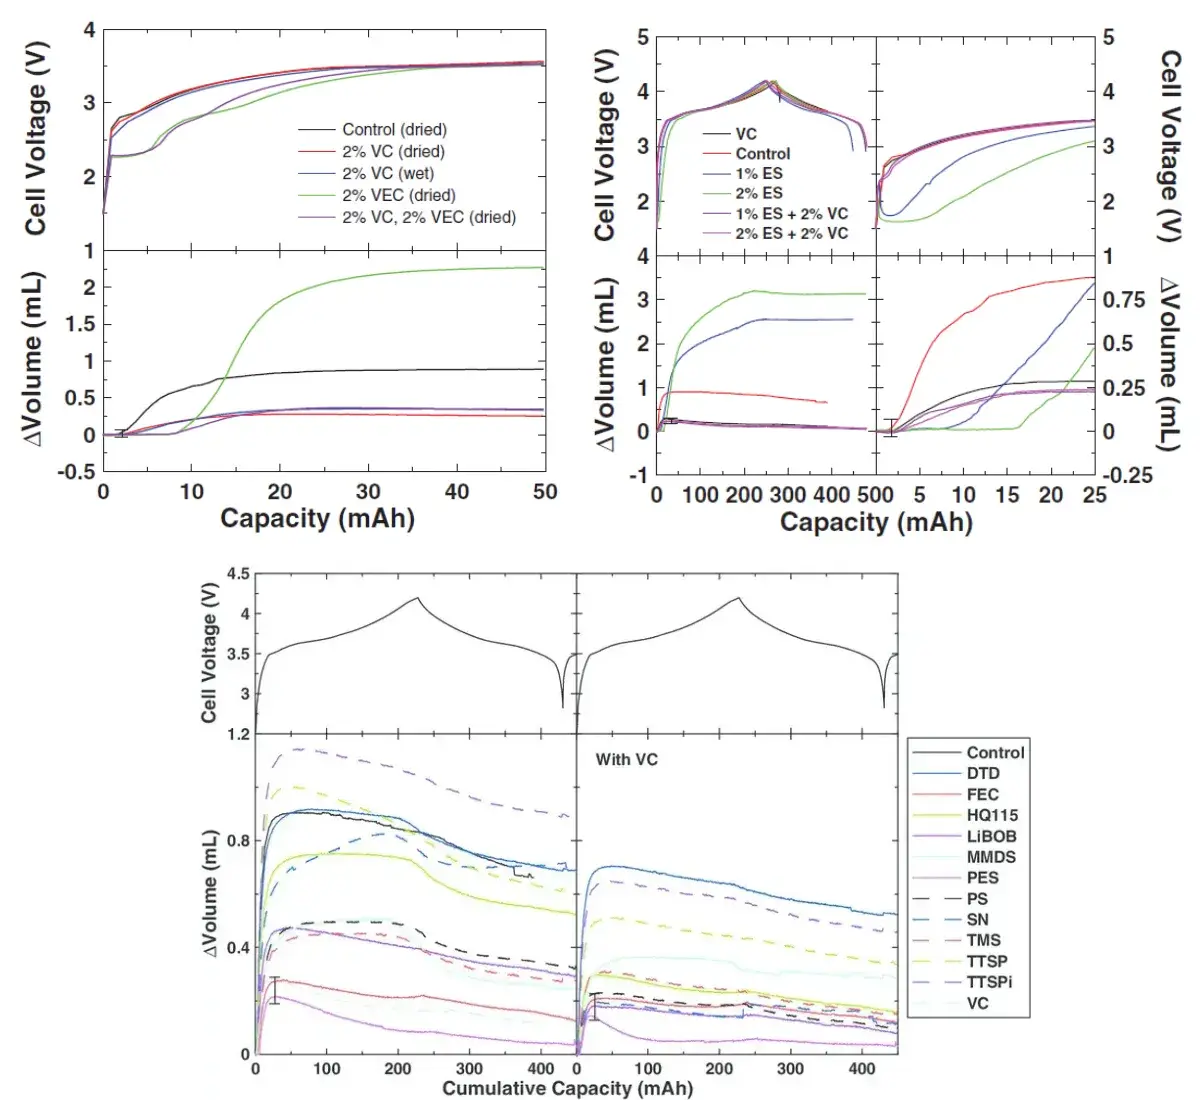
Figure 7. The effect of electrolyte additive type on cell voltage and volume
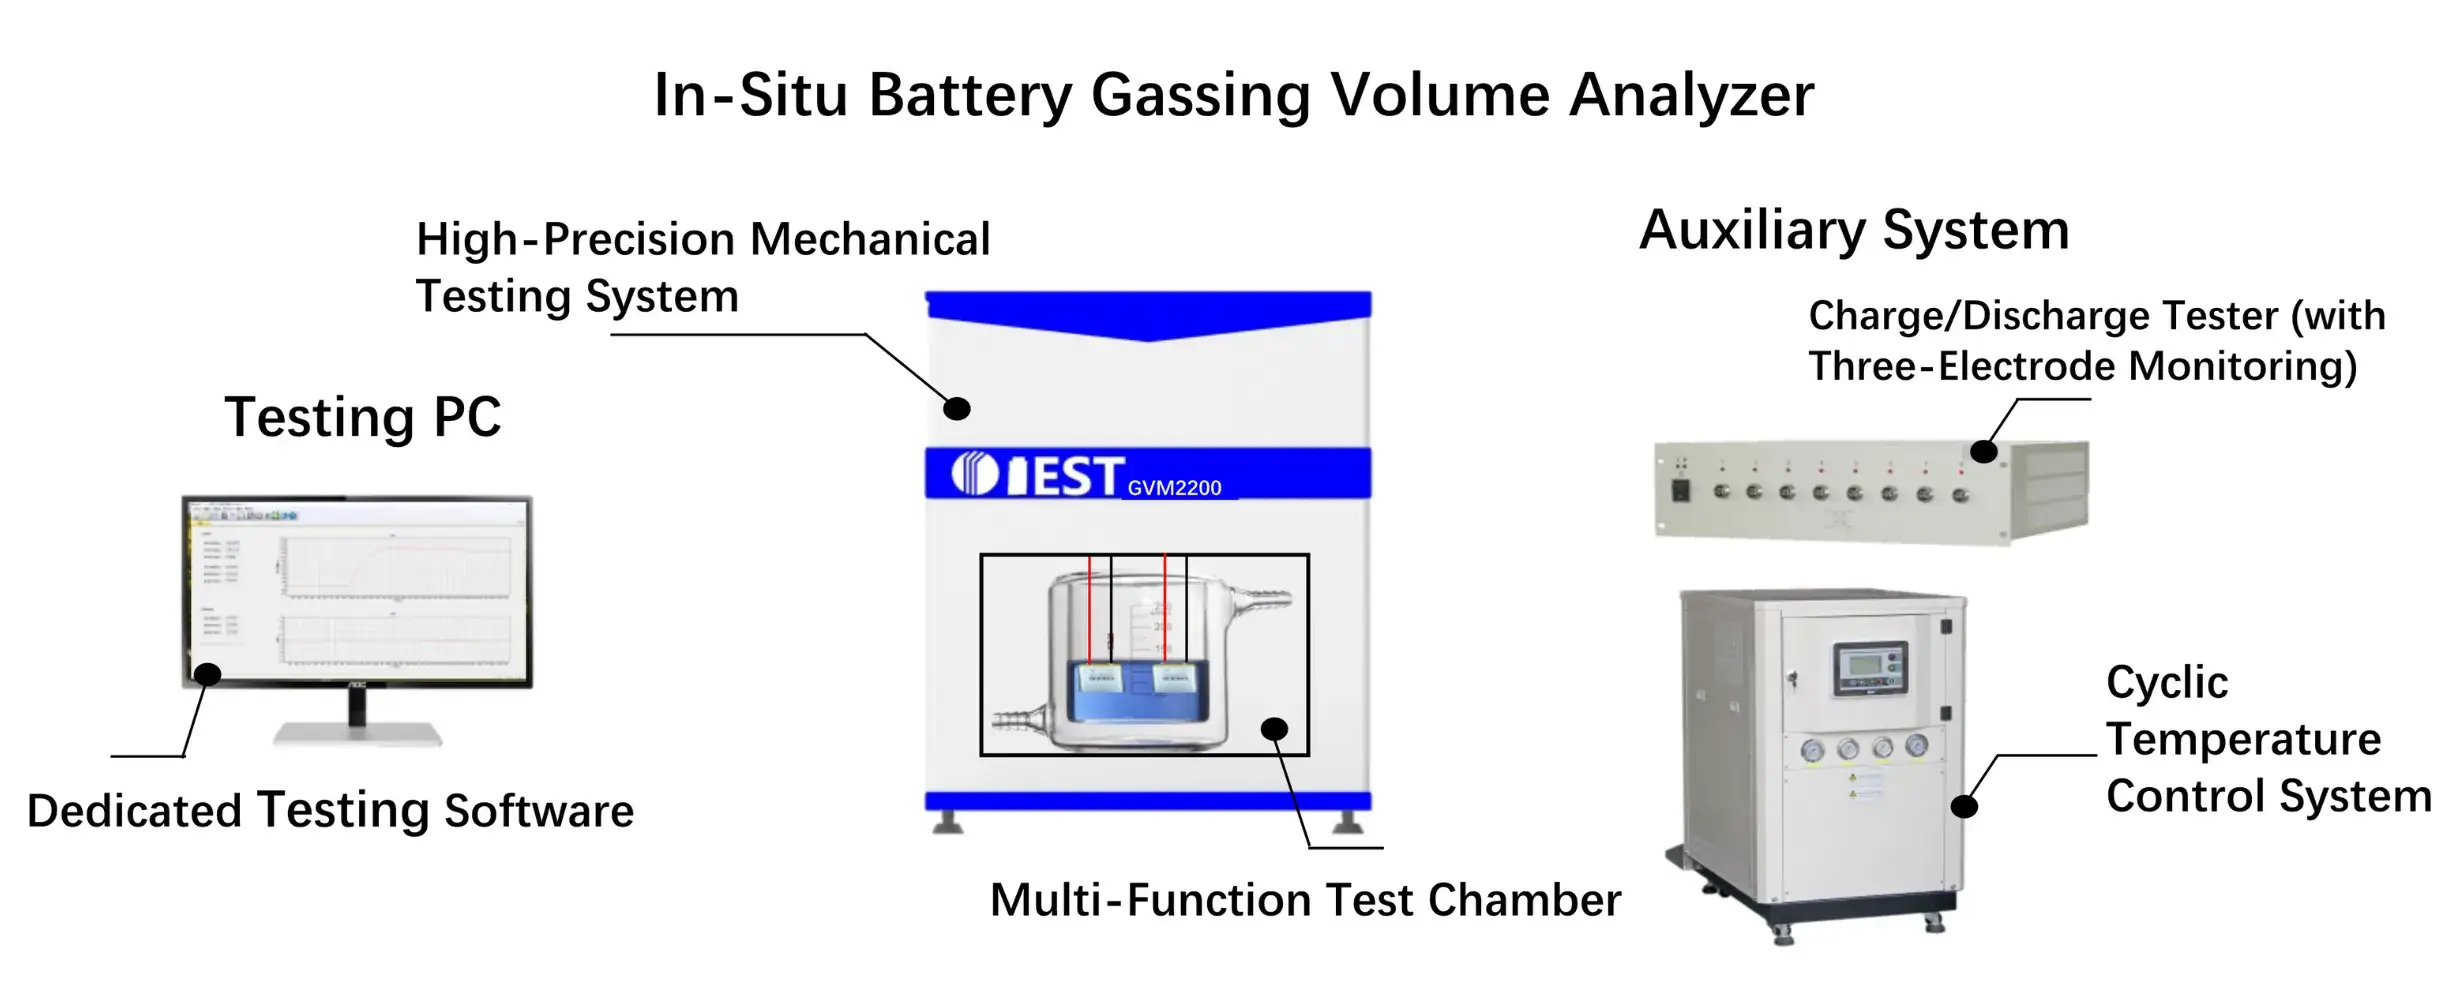
The IEST GVM2200 In-Situ Battery Gassing Volume Analyzer provides real-time, non-destructive gassing volume monitoring for formation, cycling, storage, overcharge, and over-discharge testing — the same underlying measurement approach demonstrated in the AISGA literature reviewed above.
The in-situ gas evolution monitoring device described in this article can track pouch cell volume change in real time during the formation stage, enabling comparison of gas production behavior across different electrolyte additives:
This literature’s core methodological contribution — non-destructive, real-time gassing volume monitoring based on the Archimedes buoyancy principle — validates in-situ gassing analysis as a practical tool for electrolyte additive screening rather than relying solely on post-hoc cell disassembly. This is the same measurement philosophy behind the IEST GVM2200, described below, which makes this class of real-time gassing volume monitoring available as standard laboratory equipment rather than a custom-built research apparatus.
C. P. Aiken, J. R. Dahn et al. An Apparatus for the study of In situ gas evolution in Li-Ion pouch cells. Journal of the Electrochemical Society, 161 (2014) A1548-A1554.
The IEST GVM2200 In-Situ Battery Gassing Volume Analyzer supports the same class of real-time, non-destructive gassing volume monitoring discussed above, with the following specifications:
These capabilities support both material and cell-level R&D, including the type of electrolyte additive screening demonstrated in Section 3.3 above.
In-situ gas evolution testing measures a pouch cell’s gas volume in real time during formation, cycling, or storage without disassembling the cell — typically by suspending the cell in a liquid and applying the Archimedes buoyancy principle to infer volume change from tension force, rather than periodically opening cells to measure accumulated gas directly.
In a comparison of 14 electrolyte additives by Aiken and Dahn (Dalhousie University), the combination of 2% VC (vinylene carbonate) and 2% PES produced the least total gas during formation. VC alone also suppressed gas production below that of a blank electrolyte with no additive, and inhibited the gas-producing effect of VEC when the two were combined.
With a fixture (clamp) present, gas generated during formation is squeezed into the blank section of the pouch, and cell volume shows no clear downward trend over time. Without a fixture, gas remains at the pole-piece surface where it reacts further, causing volume to decrease by roughly 0.1 mL. Because fixture presence changes the volume trend, formation gassing tests should account for and report whether a fixture was used.
A charge/discharge rate below C/3 is recommended for formation gassing tests, since lower rates make the “sawtooth” voltage and volume signal associated with pole-piece expansion and contraction during lithiation more visible, improving the resolution of gassing-behavior analysis.
Custom Archimedes-principle apparatuses like the AISGA system used in the referenced Dalhousie University study demonstrate the underlying measurement approach. The IEST GVM2200 In-Situ Battery Gassing Volume Analyzer provides a commercially available implementation with a 20°C–85°C test temperature range, dual-channel synchronous testing, and 1 μL resolution, supporting formation, cycling, storage, overcharge, and over-discharge gassing tests.
