-
iestinstrument
Promoting Surface Electric Conductivity of LCO Material For High-Rate Performance
1. Research Background
In lithium-ion batteries, the anode material, as the main part of lithium ion diffusion and electron transport, determines the performance of the battery to a large extent. The ion diffusion characteristics of cathode have been a hot research topic, but there are fewer studies on the electron transport characteristics. The specific capacity of the same type of cathode is significantly different when the same cutoff voltage is set, which is likely to be limited by the influence of the electron transport aspect. The rate performance is greatly influenced by the surface electric conductivity. Therefore, we can improve the rate performance of anode by increasing the surface electric conductivity of LCO material. Meanwhile, the detachment/embedding of lithium ions within individual particles is driven by the applied effective potential (Veff), where Veff is determined by the potential applied to each particle (Vo) and the potential drop (IR) caused by the surface resistance. If the R value increases, Veff decreases and fewer lithium ions are available.
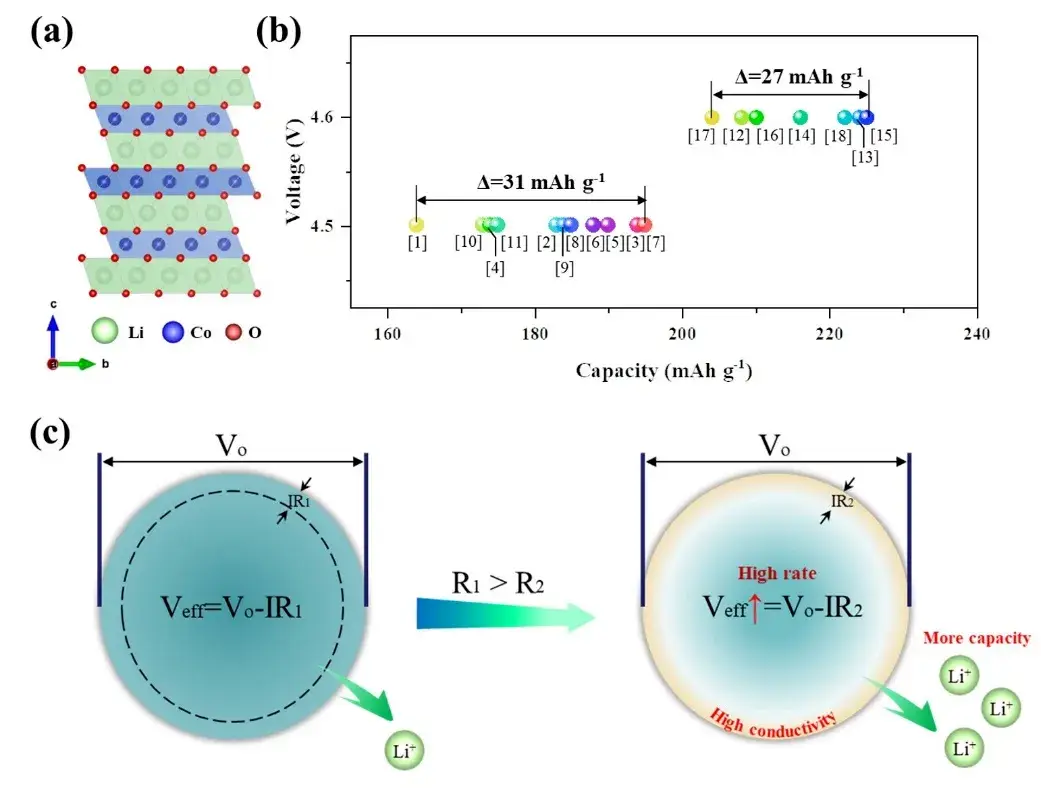
Figure 1.(a) Layered structure of LCO; (b) Initial discharge capacity of LCO discharged at 0.1C multiplicity with up to voltages of 4.5V and 4.6V, respectively, as reported in the literature; (c) Schematic diagram of the strategy to improve the multiplicity performance of cathode materials by adjusting surface conductivity
2. Article Summary
Dr. Shenyang Xu and Prof. Feng Pan’s team at Peking University and Prof. Mingjian Zhang at The Chinese University of Hong Kong (Shenzhen) have constructed a (Li/Co/Al)(O/F) surface layer with a unique disordered rock-salt structure on the surface of LCO material, which was shown by multiscale conductivity tests to significantly increase the surface conductivity of LCO material, generating abundant vacancies and fast electron transport on the surface, thus increasing the effective applied voltage Veff on the internal layered lattice.For the first time, the characteristics of Li⁺ de-embedding/embedding in the anode are related to the surface electron transport properties through the concept of effective voltage Veff.
Further, the authors comprehensively analyze the effects of the increase in electronic conductivity on electrochemical processes, structural phase transitions, chemical valence states, and surface reactions, and demonstrate the effects of the increase in electronic conductivity on ionic conductivity from both experimental and multiphysics field simulations. These findings deepen the understanding of electron/Li⁺ transport properties in cathode materials and open up new directions for the development of fast charge/discharge cathodes. The related results were published in the top international journal “Angew. Chem., Int. Ed.” under the title “Promoting Surface Electric Conductivity for High-Rate LiCoO2“.
3. Graphic Appreciation
As shown in Figure 2, due to the disordered rock salt (Li/Co/Al)(O,F) structure on the surface, the surface-treated LCO material(LCO-M1) becomes highly conductive, and various test methods are used to characterize the conductivity of the modified LCO material phase at different scales. The equipment used includes a four-probe powder resistance tester (PRCD2100, IEST), AFM, and EPR.
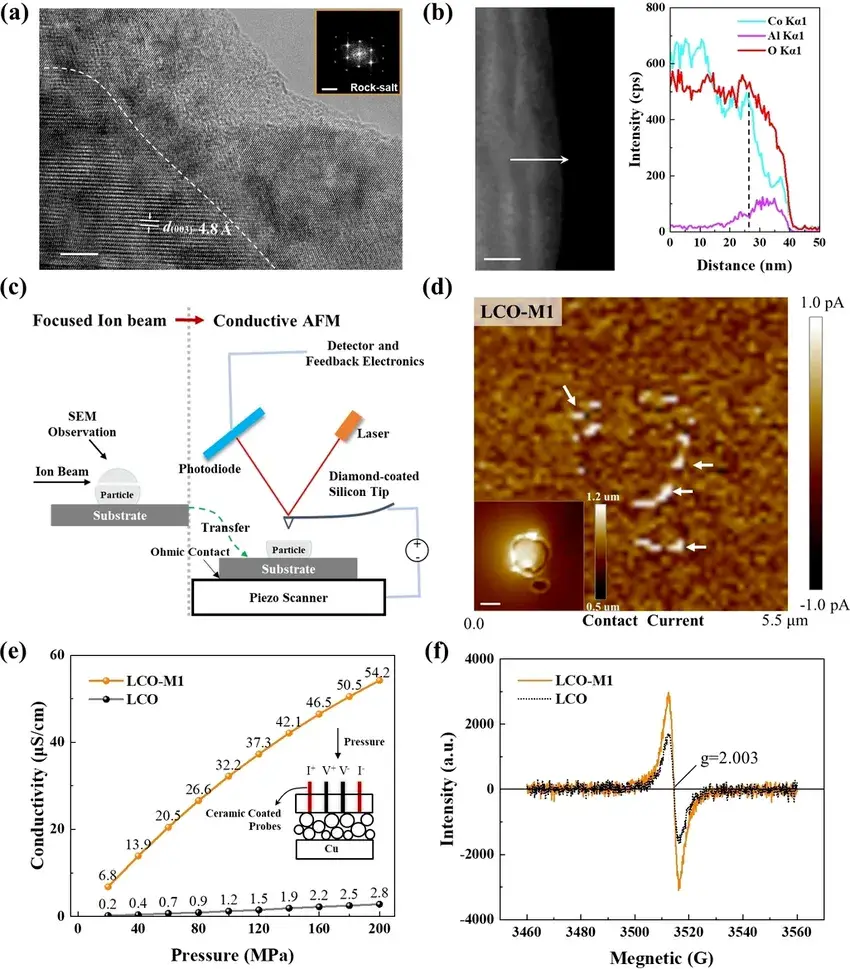
Figure 2. Characterization experiments of surface conductivity, where (a) HRTEM map of the LCO-M1 phase, and FFT transformations of selected regions. where the scale bars for the HRTEM and FFT maps are 5 (nm) and 5 (1/nm), respectively; (b) TEM maps of the LCO-M1 phase with corresponding EDX line sweeps along the direction of the arrows; (c) Schematic diagrams of individual particles subjected to an AFM conductivity test on a cross-section; and (d) AFM contact current maps of individual particles on a cross-section. where the insets are the corresponding height distribution images with a scale bar of 1 μm; (e) conductivity measurements of LCO and LCO-M1 powders at different pressures using the four-probe method (PRCD2100, IEST); and (f) EPR mapping of LCO and LCO-M1 powders.
As shown in Figure 3, thanks to the high surface conductivity and the intrinsically stable structure of the disordered rock salt phase, the modified LCO materials combines ultra-high rate performance and long cycling stability. In addition, it is shown by time-of-flight secondary ion mass spectrometry (ToF-SIMS) that the modified LCO materials has a more homogeneous cathode electrolyte interface (CEI) layer and is mainly composed of LiF₂- and other inorganic materials. This can effectively inhibit side reactions and lattice oxygen loss.
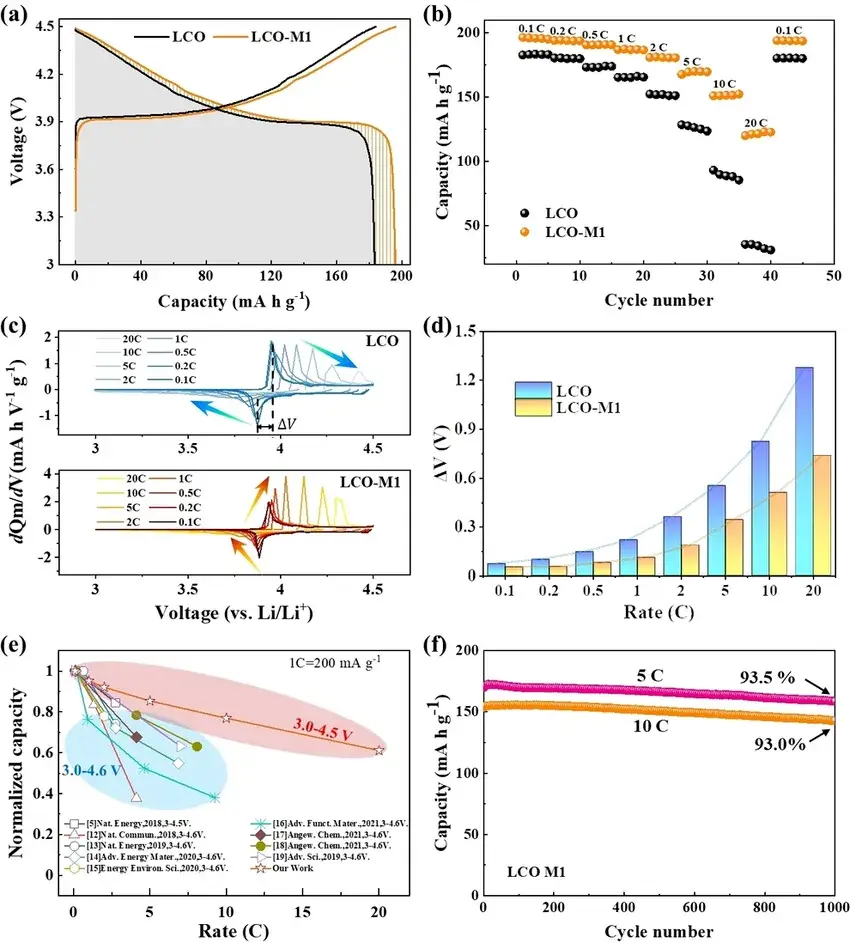
Figure 3. Enhanced rate performance. (a) Capacity-voltage curves of LCO and LCO-M1 phases at 0.1C multiplicity for the second lap when cycling in the voltage interval of 3.0-4.5 V; (b) multiplicity performance test of LCO and LCO-M1 phases in the voltage interval of 3.0-4.5 V at 25°C; (c) different multiplicity of LCO and LCO-M1 phases at different multiplicity of the dQm/dV curves, where the arrows demonstrate the trend of the redox peaks; (d) correlation between ΔV and multiplicity, where ΔV is defined as the voltage difference between the charging peak and the discharging peak in the dQm/dV curves, which is used to quantify the change of polarization; (e) comparison of multiplicity performances between the LCO-M1 phase and reported LCO phases; (f) comparison of the multiplicity performance of the LCO-M1 at 5C and 10C multiplicities Comparison of long cycling performance at 5C and 10C multiplication rates, where the voltage interval is 3.0-4.5V.
The results in Figure 4 indicate that the ordered Li⁺ transport channels formed in the LCO-M1 phase after cycling facilitates the rapid embedding or detachment of Li⁺. In addition, a combination of FIB-EDX/SEM (Fig. S23), ToF-SIMS (Fig. S24), and impedance spectral relaxation time distribution (DRT) analyses (Fig. S25) reveals that the increased Li⁺ diffusion capacity may come from the dense and stable CEI layer, which allows for the fast passage of Li⁺ and electrons.
LCO-M1 to have better surface conductivity and higher effective voltage, which allows the de-embedded lithium phase transition to occur at lower applied voltages. The authors used soft X-ray absorption spectroscopy (SXAS) of the L-edge of Co and the K-edge of O to follow the chemical state changes of LCO-M1 and found that the formation of the Co₂⁺ and spinel phases in LCO-M1 occurs earlier than that in conventional LCOs.In addition, LCO-M1 has a higher peak at 4.5 V than that of the conventional LCO material, which is consistent with the fact that LCO- M1 has a higher capacity is consistent.
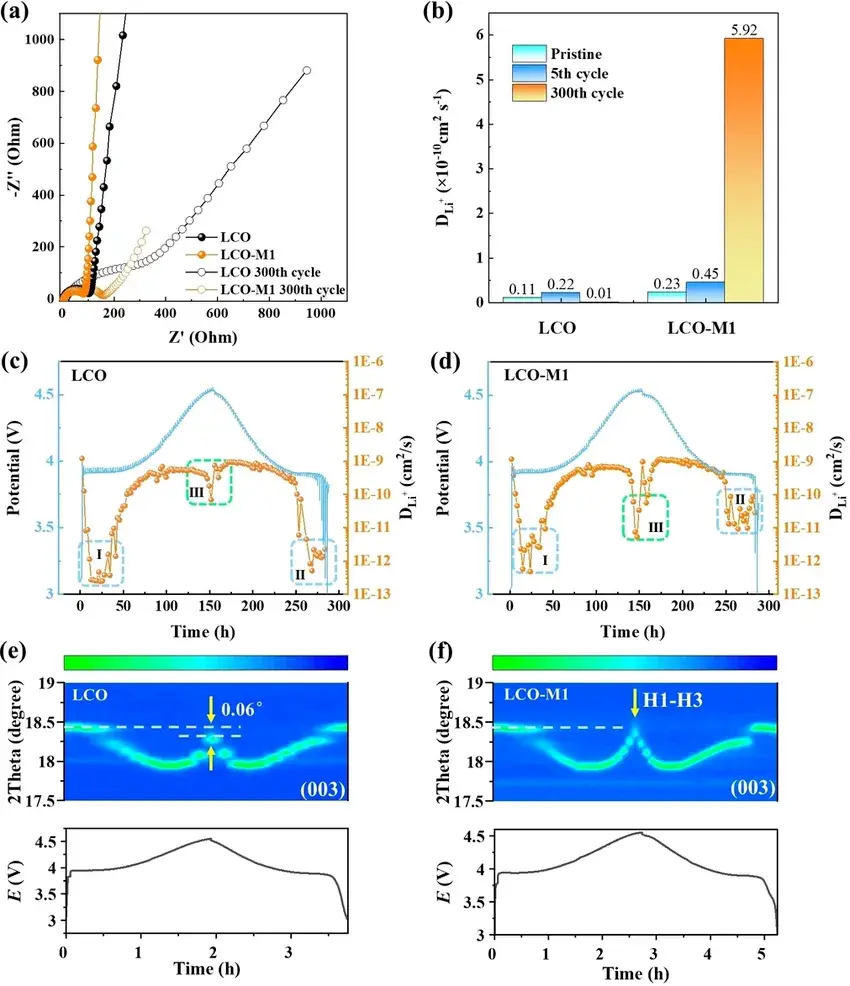
Figure 4. The impact of electron conductivity on Li⁺ diffusion and phase transition. (a) Electrochemical impedance spectra of LCO and LCO‐M1 before cycling and after 300 cycles in 3–4.5 V at 1 C. (b) The Li⁺ diffusion coefficients (DLi+) of LCO and LCO‐M1 derived from the fitting of EIS spectra in (a). GITT measurements of LCO (c) and LCO‐M1 (d) during the initial charge/discharge. In situ XRD evolution of bare LCO (e) and LCO‐M1 (f) at the (003) peak with the corresponding electrochemical curves.
In Figure 5, the authors describe the electrochemical mechanism of LCO-M1 after surface modification with a schematic diagram. The modified disordered rock salt phase surface is characterized by three features: i) a stable backbone, ii) a good Li⁺ percolation network, and iii) a high electric conductivity. The stable structure protects the internal layered lattice and ensures that it can be stabilized for prolonged cycling. In addition, the surface is capable of generating abundant vacancies that contribute to the rapid electron transport, thereby increasing the voltage effectively applied to the internal layered lattice and stimulating a deeper phase transition process, so that the LCO-M1 is able to embed or detach more Li⁺ within the same operating voltage range, i.e., improving the rate performance of the cell.
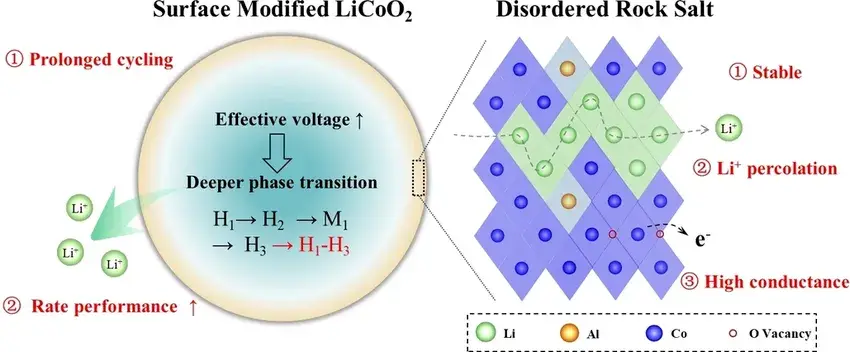
Figure 5. Schematic diagram of high‐rate material design. Surface structure with high stability and Li⁺ diffusion kinetics for stable long‐cycle and variable high‐rate electrochemical performance.
In Figure 6, the authors demonstrated through finite element simulations that LCO-M1 with higher surface conductivity has a longer discharge time, i.e., a larger specific capacity. And the LCO-M1 particles also exhibit a more uniform surface potential distribution and a higher end-of-discharge potential, which leads to a faster diffusion rate of Li⁺ inside the LCO-M1 particles. In addition, the authors also investigated the Li⁺ concentration distribution at different discharge times, which further confirmed that the high surface conductivity favors the rapid embedding of Li⁺ in LCO-M1 (which is consistent with the experimental results).
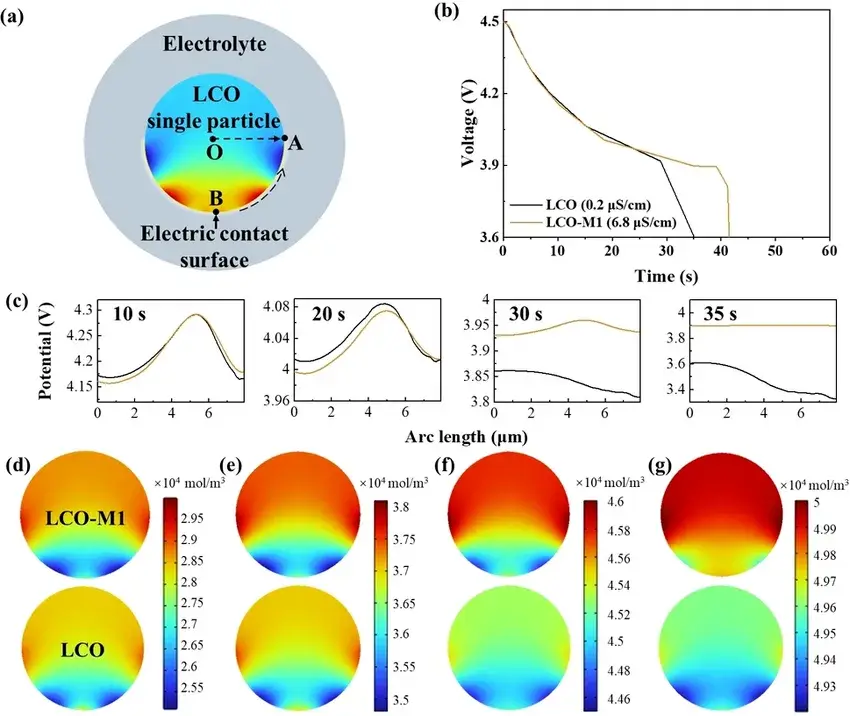
Figure 6. The impact of surface electric conductivity on the electrochemical performance by a finite‐element simulation. (a) The model for the finite element simulation. (b) The discharge curves of LCO with low and high surface conductivities. (c) Surface potential distribution along the BA^ ${\widehat{BA}}$ arc (marked in (a)) when discharging at 10, 20, 30 and 35 s. Li⁺ concentration distribution at 5 (d), 10 (e), 20 (f), and 30 (g) s.
4. Summary
The authors innovatively improved the rate performance of cathode materials by increasing the surface conductivity. To validate the strategy, the authors constructed a disordered rock salt-type (Li/Al/Co) (O/F) layer on the surface of LCO. Conductivity tests on individual particles, powders, and electrode samples showed that the surface-modified LCO-M1 improved the electronic conductivity by more than an order of magnitude compared to the conventional LCO material.The LCO-M1 significantly increased the effective voltage applied to a large number of individual particles and drove a greater amount of Li⁺ embedding/de-embedding at the same external voltage, ultimately achieving excellent multiplicity performance (154 mAh/g for gram capacity play at 10 C, 3.0-4.5 V), as well as excellent cycling performance thanks to the inherent structural stability (~93.0 % capacity retention after 1000 cycles at 10 C). In addition, the authors also for the first time correlated the Li⁺ embedding/de-embedding properties in the cathode with the surface electron transport properties through the concept of effective voltage Veff. All these findings deepen the understanding of the electron/Li⁺ transport properties in the cathode materials and open up a new direction in the development of cathode materials for fast charging and discharging.
5. Original Paper
S.Y. Xu, X.H. Tan, W.Y. Ding, W.J. Ren, Q. Zhao, W.Y. Huang, J.J. Liu, R. Qi, Y.X. Zhang, J.C. Yang, C.J. Zuo, H.C. Ji, H.Y. Ren, B. Cao, H.Y. Xue, Z.H. Gao, H.C. Yi, W.G. Zhao, Y.G. Xiao, Q.H. Zhao, M.J. Zhang* and F. Pan*. Promoting Surface Electric Conductivity for High-Rate LiCoO2. Angewandte Chemie International Edition.
6. Related Test Equipment Recommendation:
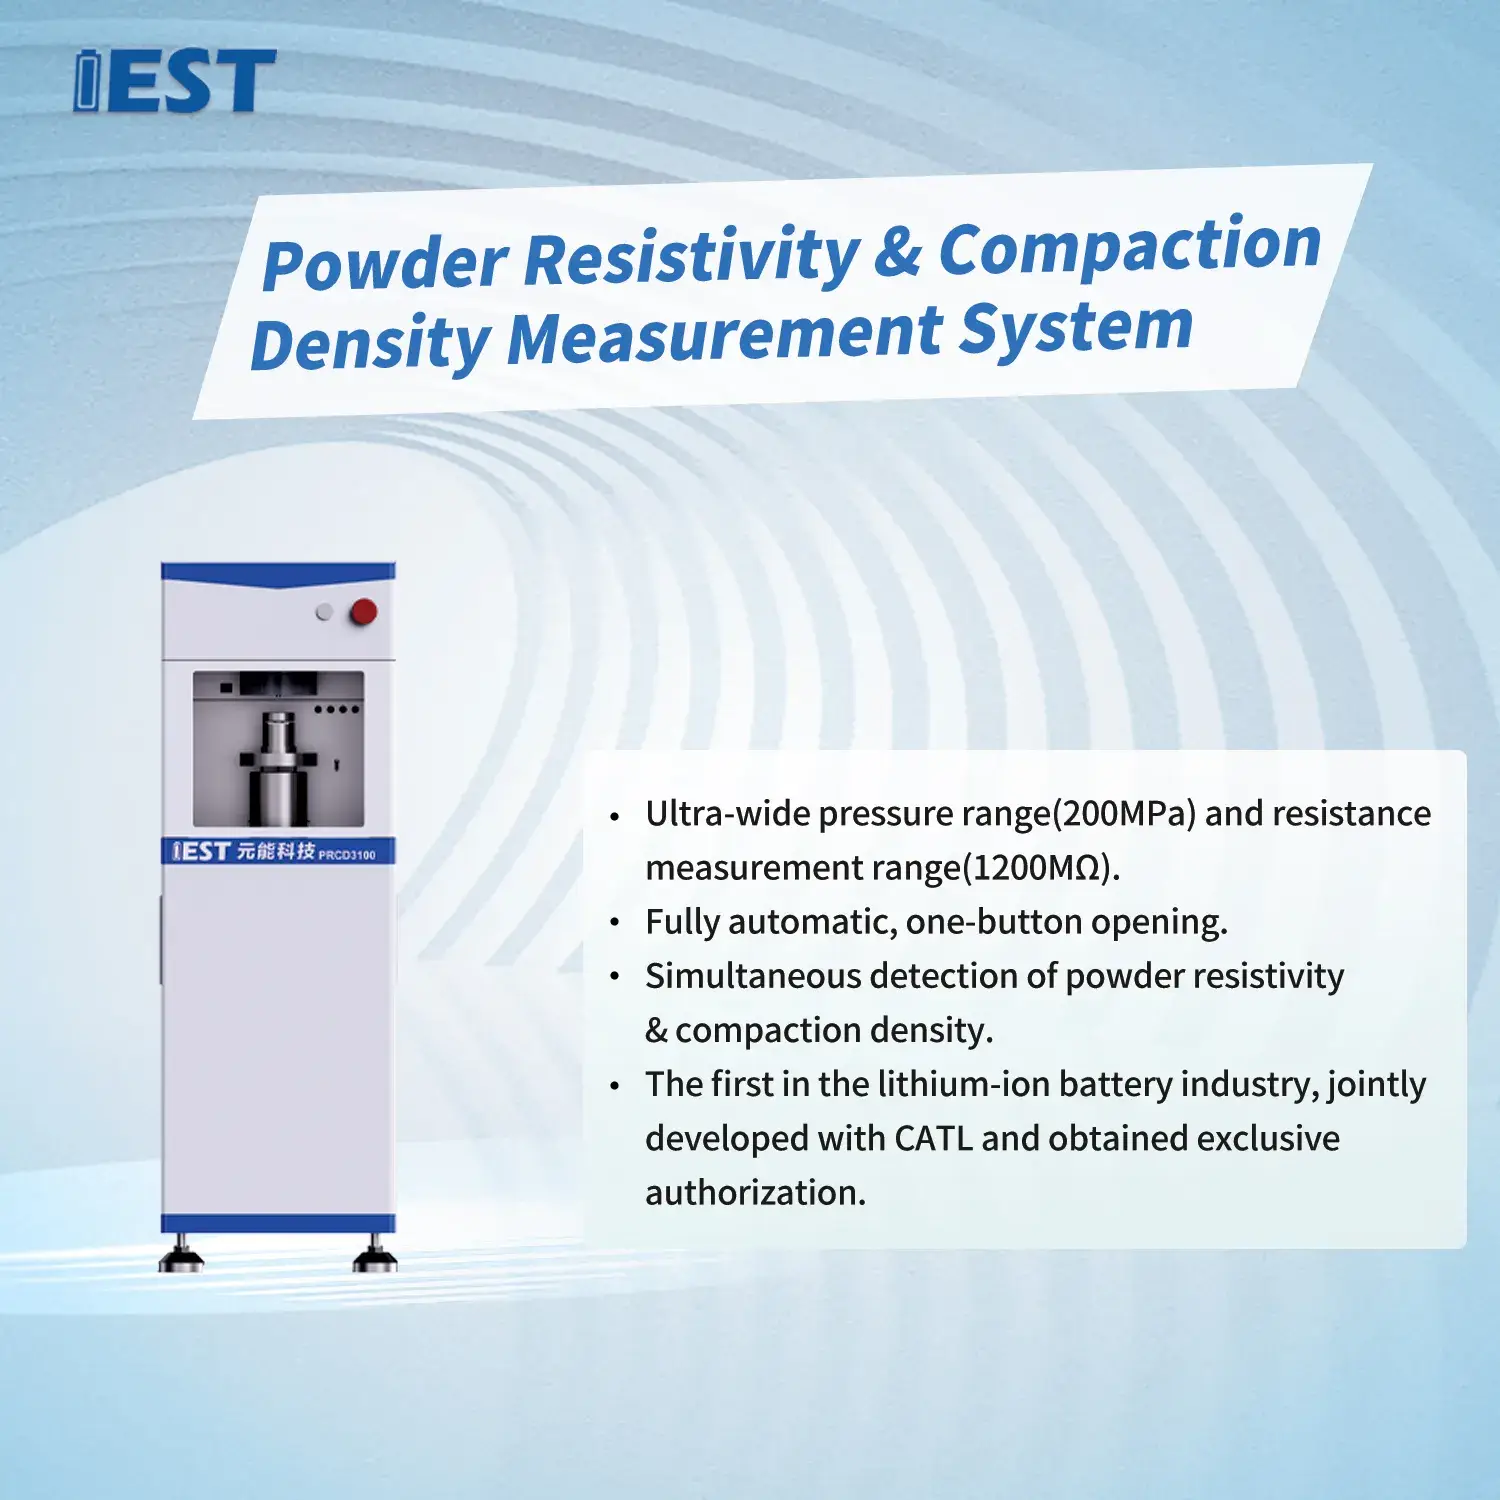
IEST Powder Resistivity & Compaction Density Measurement System (PRCD3100)
Contact Us
If you are interested in our products and want to know more details, please leave a message here, we will reply you as soon as we can.


