

Pouch cells are widely used in electric vehicles, portable electronics, and energy storage systems due to their high energy density and flexible packaging. During electrochemical cycling, electrode volume changes, gas evolution, and heat generation cause macroscopic deformation — most visibly as pouch cell swelling in the thickness direction. Uneven lithium distribution and internal structural features produce spatially non-uniform stresses across the pouch surface. Accurately monitoring these local changes is essential for understanding failure modes, improving safety, and optimizing cell and pack designs.
This study uses a Battery Pressure Mapping Sensor Measurement System(BPD) together with an in-situ swelling analyzer to measure pressure in pouch cell surfaces during charge–discharge, producing a high-resolution map of expansion force that reveals where the pouch expands most and why.
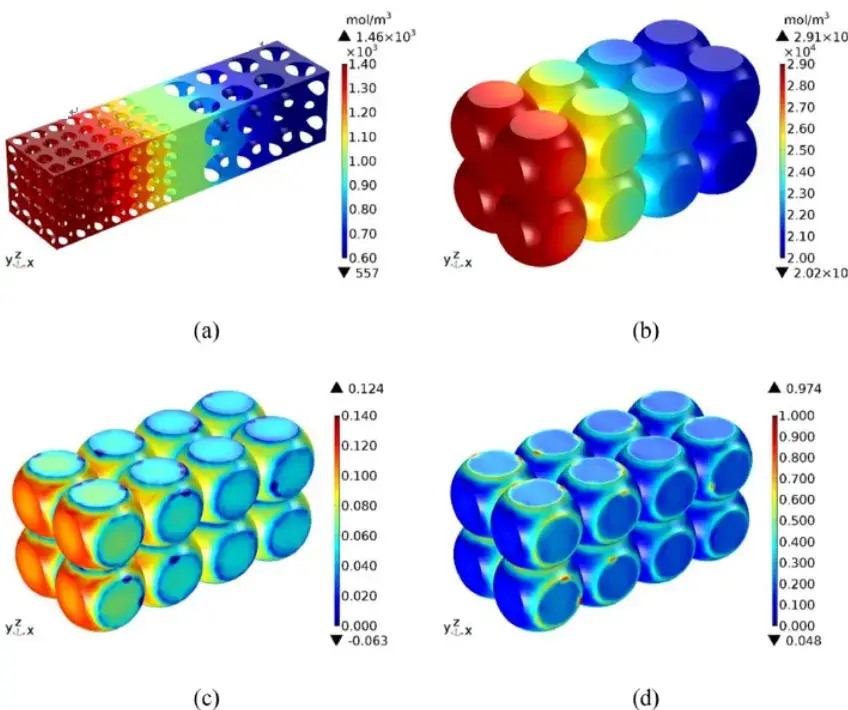
Figure 1. Simulation of lithium concentration and stress strain distribution corresponding to lithium-ion pouch cells when they are fully charged.
All measurements were performed using two complementary instruments:
Battery Pressure Mapping Sensor Measurement System(BPD) — a conformal pouch cell swelling pad consisting of a thin-film sensor array placed beneath the pouch cell. The pad divides the cell surface into multiple measurement zones; each sensor logs a synchronous local force trace, enabling spatially resolved expansion force mapping across the full cell surface.
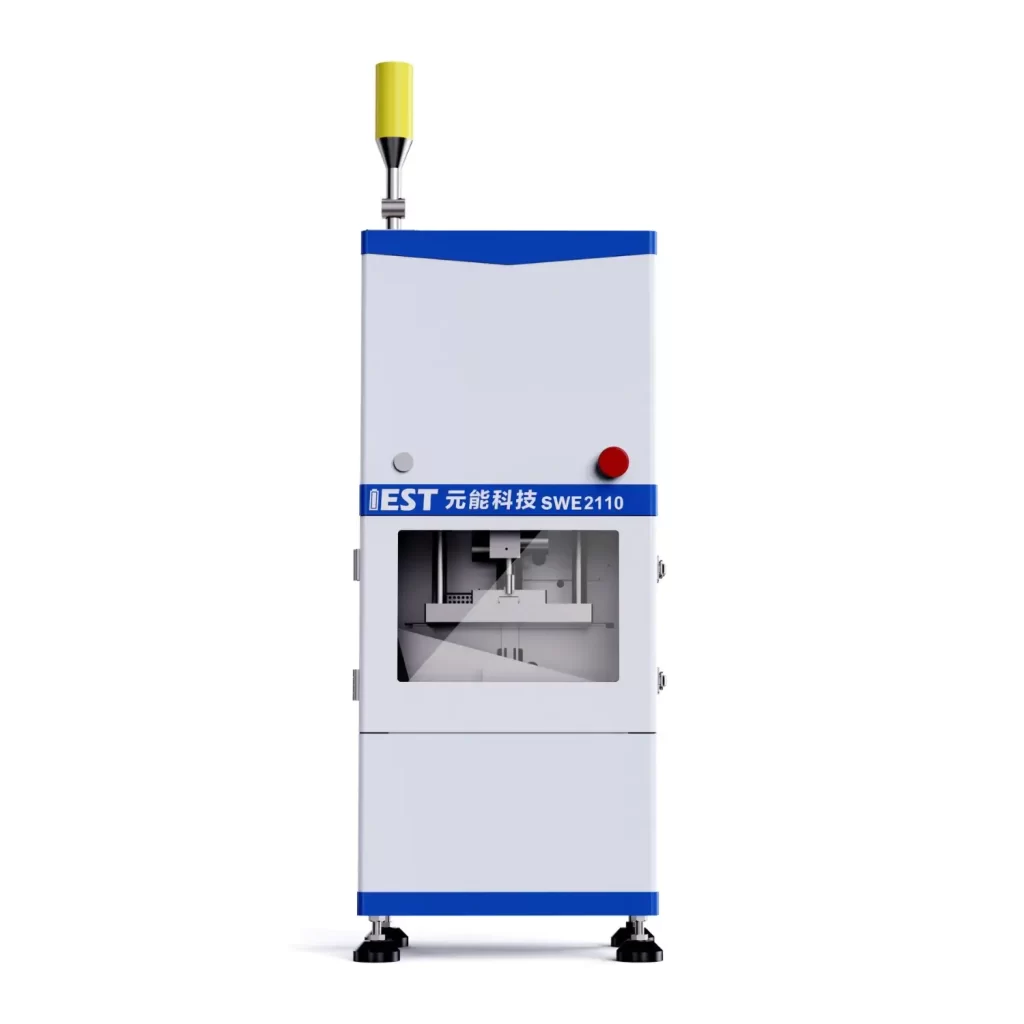
Figure 2. IEST SWE series in-situ swelling analyzer — the platform used to apply controlled clamping pressure and synchronously record pouch cell expansion force during cycling.
The Pouch Cells Information is Shown in Table 1
| Information of cell | |
|---|---|
| Cathode | NCM |
| Anode | Graphite |
| Capacity | 2000mAh |
| Voltage | 3.0~4.2V |
| Model | 3045105 |
Pouch cells were placed in the SWE2110 test chamber in constant-gap mode. The charge–discharge sequence was as follows: 60-minute rest → CC charge at 0.75C (cut-off current 0.05C) → 10-minute rest → CC discharge at 0.75C (cut-off voltage 3.0 V). The BPD swelling pad simultaneously recorded local expansion force at each sensor zone throughout three full cycles.
Figure 3 shows the maximum expansion force curve synchronized with cell voltage over three complete cycles. As lithium ions extract from the positive electrode and insert into the negative electrode during charging, the graphite anode expands and expansion force rises continuously. Peak expansion force at full charge reached 125.3 kg. During discharge, lithium ions return to the positive electrode, the anode structure contracts, and pressure falls progressively to 56.9 kg at end of discharge. The force profile is highly repeatable across all three cycles, confirming measurement stability under constant-gap clamping conditions.
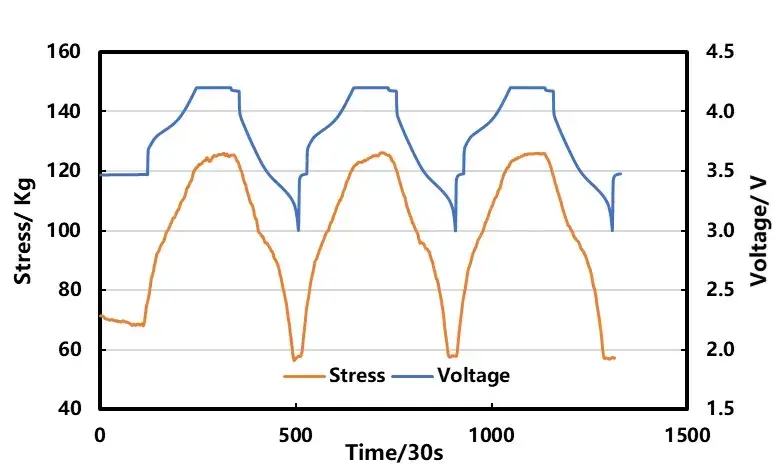
Figure 3. Cell voltage and expansion force variation curve over three charge–discharge cycles (0.75C). Peak force: 125.3 kg (full charge); end-of-discharge force: 56.9 kg.
| Parameter | Value | Condition |
|---|---|---|
| Peak expansion force | 125.3 kg | Full charge (SOC 100%), 0.75C |
| End-of-discharge force | 56.9 kg | Cut-off voltage 3.0 V |
| Clamping pressure range | 50 – 10,000 N | SWE2110 operating range |
| Charge rate | 0.75C | CC, cut-off current 0.05C |
| Discharge rate | 0.75C | CC, cut-off voltage 3.0 V |
| Number of cycles | 3 | Constant-gap mode |
To analyze expansion force variation across the cell surface, the pouch is divided into a grid of small sensor zones as shown in Figure 4. Each zone corresponds to one thin-film sensor in the pouch cell swelling pad, and all zones log synchronous force traces throughout cycling.
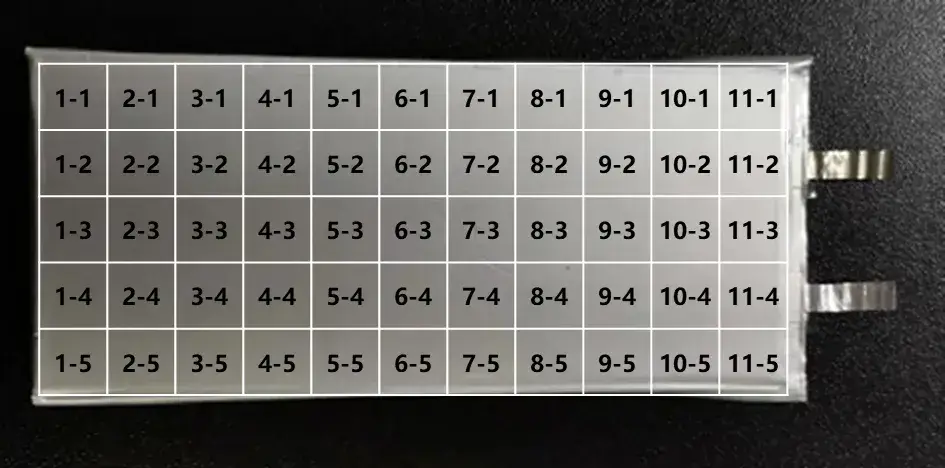
Figure 4. Grid subdivision of the pouch cell surface into individual sensor zones for spatially resolved expansion force measurement.
Figure 5 presents heatmap visualizations of expansion force across all zones as SOC increases during charge and decreases during discharge. The color scale correlates directly with local expansion force magnitude — darker regions indicate higher force. As SOC rises, expansion force increases substantially in the center region of the cell, while edge zones remain comparatively weaker. This center-heavy stress distribution is attributable to two factors: (1) the heat-sealed edge of the aluminum-plastic pouch film itself acts as a mechanical constraint, limiting thickness expansion at the periphery; and (2) the geometry of the wound electrode stack concentrates lithiation-induced strain in the central electrode layers. At the same time, the change of expansion force will also be affected by the glue at the end of the pouch cells and the thickness of the tab.
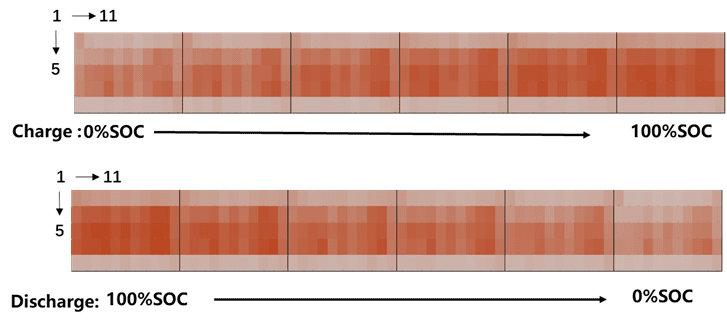
Figure 5. Expansion force heatmap across pouch cell surface zones as a function of SOC. Darker color = higher local expansion force. Center zones dominate; edge zones remain consistently lower in absolute force.
Figure 6 compares the spatially resolved expansion force distribution in the zero-charge and full-charge states of the second cycle. While absolute expansion force is lower at the edges than in the center, the rate of expansion change — the increase from zero-charge to full-charge — is highest at edge and corner positions. This elevated rate-of-change at corners is consistent with stress accumulation associated with the wound electrode geometry, where electrode layers are bent through tighter radii at the corners, increasing local mechanical strain. This is also a location associated with elevated lithium plating risk during fast charging, and the expansion force signature provides a non-destructive indicator of that risk.
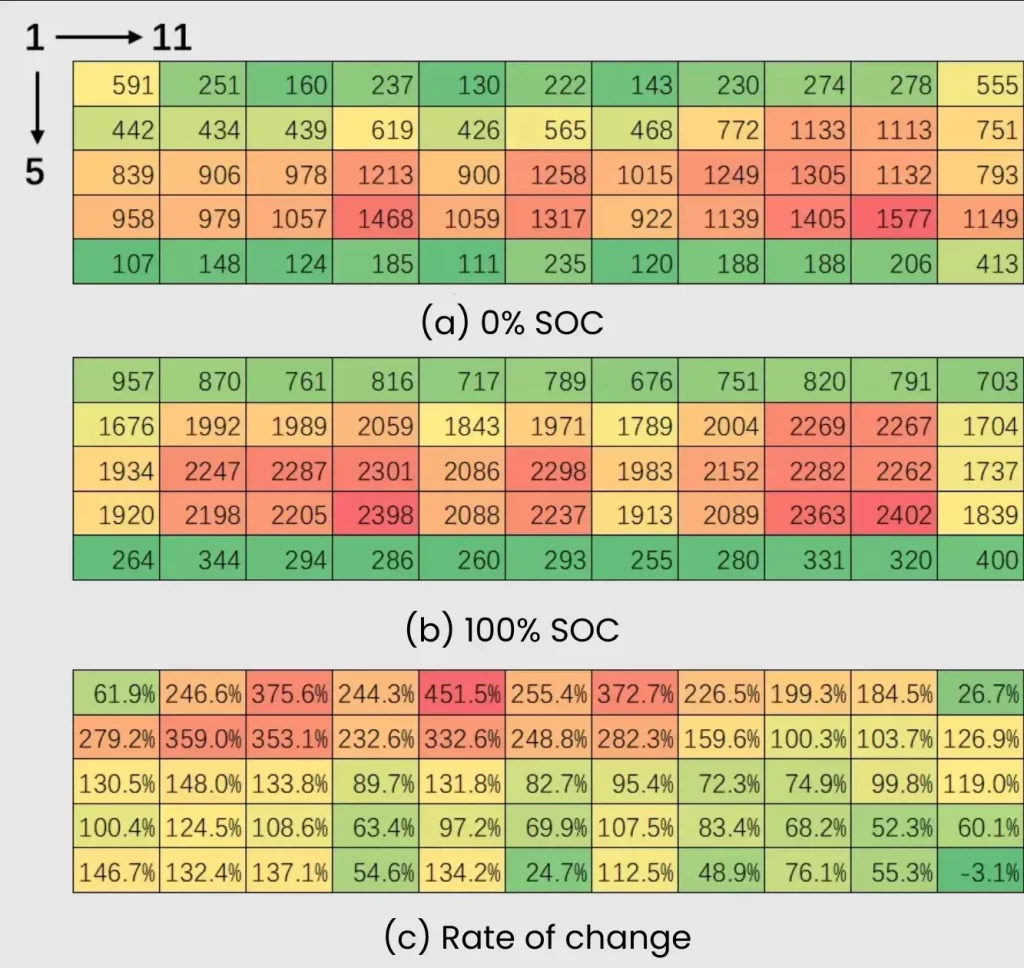
Figure 6. Relative expansion force distribution in zero-charge and full-charge states (second cycle). Edge and corner zones show the highest rate of expansion change despite lower absolute force values.
Figure 7 shows the expansion force curve of some selected small area units. Judging from the absolute value of the expansion force curves at different positions, the absolute value of the expansion force is the smallest at edge positions 1, 5, and 11,This may not be flat with the initial surface of the cell, so the initial force is less at the edge, Especially at the position 11 close to the tab, there is basically no obvious change in expansion force detected during the charging and discharging process, indicating that this position is basically not in contact with the pressure sensor. The uneven stress distribution in each area of the battery may also be related to the deformation process inside the winding cell. In the constant gap mode, the thickness of the battery expands during charging, and the expansion of the thickness forms a force on the clamp. Maintaining a constant gap between the clamps is equivalent to exerting a certain pressure on the battery. Under the pressure, wrinkles and curls may occur inside the cell. As shown in Figure 8, the stress on each area is not uniform.
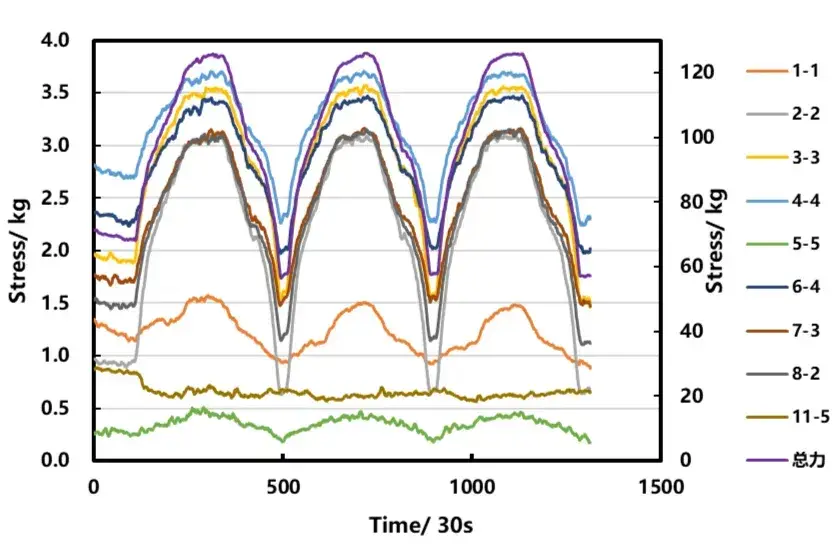
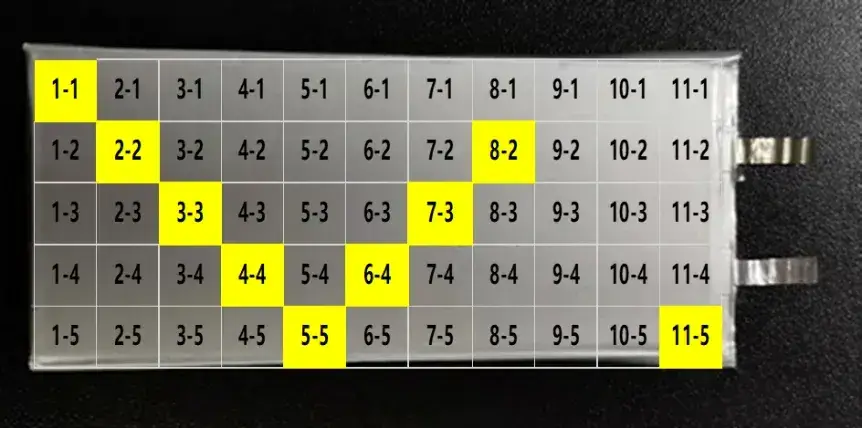
Figure 7. Expansion force traces for selected individual sensor zones. Edge positions 1, 5, and 11 show lowest absolute values; position 11 (tab-adjacent) registers near-zero force change throughout cycling.
The non-uniform stress distribution observed across zones also reflects the internal deformation mechanics of the wound cell. Under constant-gap clamping, cell thickness increases during charging exert a reaction force on the clamps. The resulting compressive load can induce internal wrinkles and electrode curling, particularly where the electrode stack lacks lateral support — further redistributing local stress in a pattern that deviates from simple center-to-edge gradients.
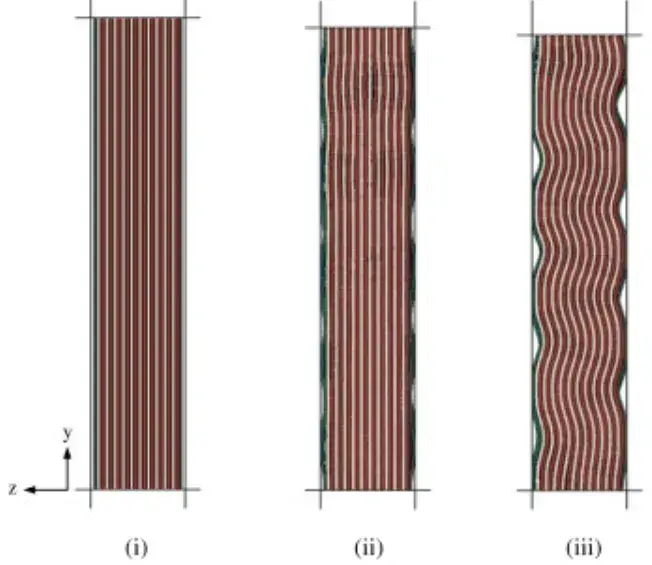
Figure 8. Schematic of internal deformation in a wound pouch cell under constant-gap clamping, illustrating electrode wrinkle and curl formation that drives non-uniform surface stress distribution.
Calibrate pad sensors under known loads and conduct repeatability checks before each test campaign to remove baseline offsets caused by initial gaps, surface creases, or pouch film non-uniformities.
Combine swelling heatmaps with thermal imaging data to correlate localized heat generation with mechanical expansion — corner zones showing high rate-of-change in expansion force alongside elevated temperature are candidate lithium plating sites.
For production-line screening, a fast BPD pad measurement stage can flag units exhibiting abnormal local stress patterns — such as asymmetric center–edge ratios or anomalous tab-zone signals — before final assembly.
Using the IEST SWE series in-situ swelling analyzer together with the BPD Battery Pressure Distribution Measurement System, this study demonstrates how to measure pressure in pouch cell surfaces with full spatial resolution during cycling. The pouch cell swelling pad approach quantitatively maps local expansion force across the entire cell surface in real time, revealing three consistent findings: (1) expansion force peaks in the center at 125.3 kg and falls to 56.9 kg at end of discharge; (2) absolute force is lower at the heat-sealed edges, but the rate of expansion change is highest at corners — indicating stress accumulation and potential lithium plating risk; and (3) the tab-adjacent zone shows near-zero force change, reflecting a mechanical contact gap rather than true zero expansion. This non-destructive characterization approach provides battery engineers with a direct, spatially resolved tool for stress analysis, failure investigation, and cell design optimization.
[1] Yanan Wang, Hua Li, Zheng Kun Wang, Chen Lian, Zongfa Xie. Factors affecting stress in anode particles during charging process of lithium-ion battery, Journal of Energy Storage, 43(2021)103214.
[2] Anna Tomaszewska, Zhengyu Chu, Xuning Feng, et al. Lithium-ion battery fast charging: A review, eTransportation, 1 (2019) 100011.
[3] Yong Kun Li, Chuang Wei, Yumao Sheng, Fei Peng Jiao, and Kai Wu. Swelling Force in Lithium-Ion Power Batteries,Ind. Eng. CHem. Res,2020, 59, 27, 12313–12318.
[4] Ali M Y, Lai W J, Pan J. Computational models for simulations of lithium-ion battery cells under constrained compression tests, Journal of Power Sources, 2013, 242:325-340.
Non-uniform pouch cell swelling results from three primary factors: the heat-sealed edge of the aluminum-plastic film constrains lateral expansion at the periphery; the wound electrode geometry concentrates lithiation-induced strain in the central layers; and the tab reinforcement at the electrode tab edge alters local mechanical stiffness. The combined effect is a center-heavy expansion force distribution, with higher absolute force at the center and elevated rate-of-change at corners — the latter correlating with stress accumulation zones and elevated lithium plating risk.
To measure pressure in a pouch cell surface, a conformal thin-film sensor array — the pouch cell swelling pad — is placed beneath the cell within an in-situ swelling analyzer. The pad subdivides the cell surface into a grid of individual measurement zones, with each sensor logging a synchronous local force trace throughout charge and discharge. Combined with the clamping force control of a swelling analyzer such as the IEST SWE2110 (50–10,000 N range), this approach produces a spatially resolved expansion force map at any SOC point during the cycle.
A pouch cell swelling pad is a flexible, conformal thin-film pressure sensor array designed to conform to the surface of a pouch cell and record spatially distributed normal forces during electrochemical cycling. The pad is placed beneath the cell inside a clamped test fixture; as the cell expands during charging, the increasing thickness presses against the pad and each sensor zone records its local force independently and synchronously. The result is a real-time, multi-zone expansion force map that reveals where the pouch expands most — typically the center — and where structural anomalies such as corner stress accumulation or tab-zone gaps occur.
In a representative wound lithium-ion pouch cell cycled at 0.75C under constant-gap clamping conditions, peak expansion force at full charge (SOC 100%) reached 125.3 kg, while end-of-discharge force at the 3.0 V cut-off was 56.9 kg. These values reflect the net force exerted on the clamp by cell thickness increase and will vary with cell chemistry, capacity, C-rate, electrode formulation, and clamping pressure — highlighting the importance of measuring expansion force directly for each cell design rather than relying on generalized estimates.
Spatially resolved pouch cell swelling data from a BPD sensor array provides two categories of design input. For pack structural design, the center-heavy expansion force distribution and corner stress accumulation profile define the mechanical load envelope that pack housing, thermal management layers, and compression pads must accommodate across the SOC range. For production quality screening, abnormal local stress patterns — asymmetric center–edge ratios, elevated corner force rates, or anomalous tab-zone signals — serve as non-destructive indicators of internal structural defects or electrode misalignment that would compromise cell reliability and cycle life.
