-
iestinstrument
Single Particle Force Properties Test System
1. Background
1.1 Correlation between single particle compressive strength and material/electrode/cell performance
On the microscopic scale, electrodes consist of nano- or micrometer-sized particles. Therefore, the inherent particle properties of electrode materials play a decisive role in the electrochemical performance of batteries. In order to obtain electrode materials with ideal electrochemical performance, extensive and in-depth research has been conducted on the crystal structure, morphology, mechanical properties, and particle modification methods of particulate materials. We can improve the electrochemical properties of particulate materials through composition adjustment, microstructure optimization and surface modification.
In terms of mechanical properties, testing the compressive strength of individual particles of battery materials can be used to assess the compressive resistance of the materials and guide the roll pressing process. Materials with high mechanical strength will have better subsequent cycling stability, as shown in Figure 1.

Figure 1. correlation between the compressive properties of lithium material particles and the application of different layers of material
On the one hand, the high compressive strength of the particles indicates that the particles can withstand higher intensity external forces and are less likely to be crushed; corresponding to the pole piece pressing process, it can make the materials or pole pieces have a higher compaction density and can load more positive or negative electrode materials per unit space, which helps to increase the battery capacity density, on the other hand, there is also a certain relationship between the overall compressive strength of the particles and the performance of the final cell. Materials with high compressive strength will improve the overall electrochemical performance of the battery. During the cycle of the cell, as lithium ions are deintercalated and the internal stress of the particles accumulates to a certain extent, cracks or breakage will occur, and the mechanical strength of the particles gradually decreases, thereby shortening the service life of the cell1-3.
For example, research by Parkb1 et al. shows that Mg doping can increase the hardness of NCM622 particles, thereby improving the cycle performance of the NCM622 cathode. Therefore, the authors believe that particle hardness is a key factor that directly affects the long-term cycle stability of the NCM622 cathode. The mechanical strength (pressure resistance) of the battery’s positive and negative electrode materials affects the electrochemical performance of the positive and negative electrode materials. This correlation provides new ideas for the study of positive and negative electrode materials.
In addition, we often need to optimize electrode manufacturing process parameters through simulation, such as the rolling process, or predict the evolution of the microstructure during battery charging and discharging. When performing refined structural simulation of electrodes, the model requires detailed performance parameters of the granular material, including mechanical property parameters, such as elastic model and fracture strength. Single-particle mechanical properties can quickly and accurately obtain these parameters, thereby helping to build more accurate models.Therefore, the testing of single particle mechanical properties of lithium battery materials can not only provide key material performance parameters, but also help to deeply understand the relationship between material properties and battery performance, thereby guiding the battery design and manufacturing process and improving battery performance and life.
2. Limitations of existing characterization methods
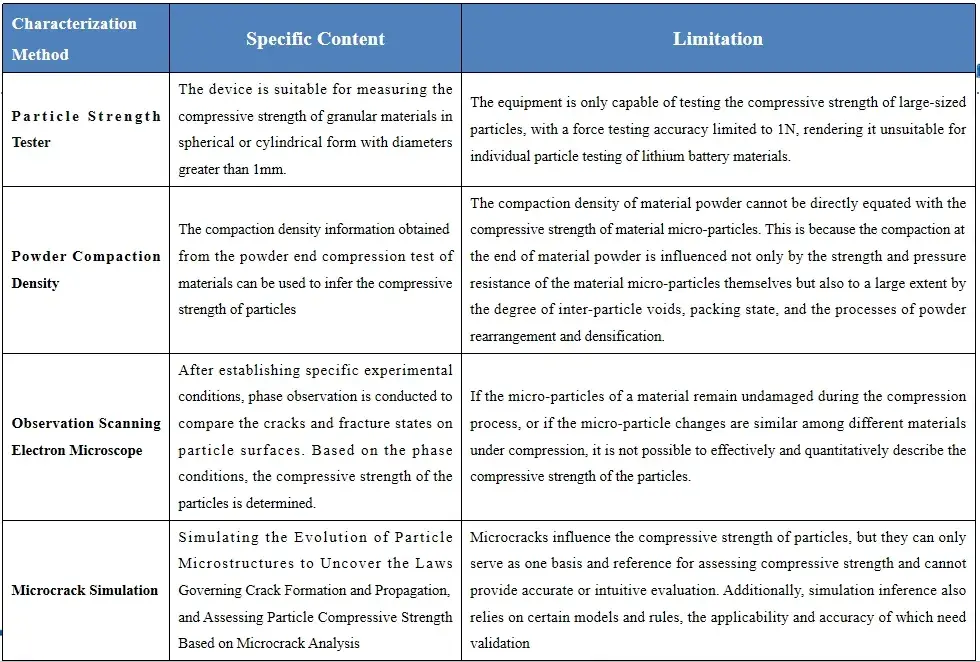
Some of the existing methods for characterizing the microscopic mechanical properties of the material surface, such as the force curve test of atomic force microscope and the hardness test of nanoindentation instrument, are mainly for testing the mechanical properties of thin film or coating substrate, which are not applicable to the micron-level battery particles, and it is difficult to reflect the compression resistance of the particles themselves. Other characterization methods, as shown in Table 1, also have certain limitations, and cannot visually and quantitatively describe the compressive properties of particles.
Table 1. Lithium battery particle strength characterization methods and their limitations
2. Lithium Battery Single Particle Force Properties Testing System(SPFT)
2.1 Basic Product Information
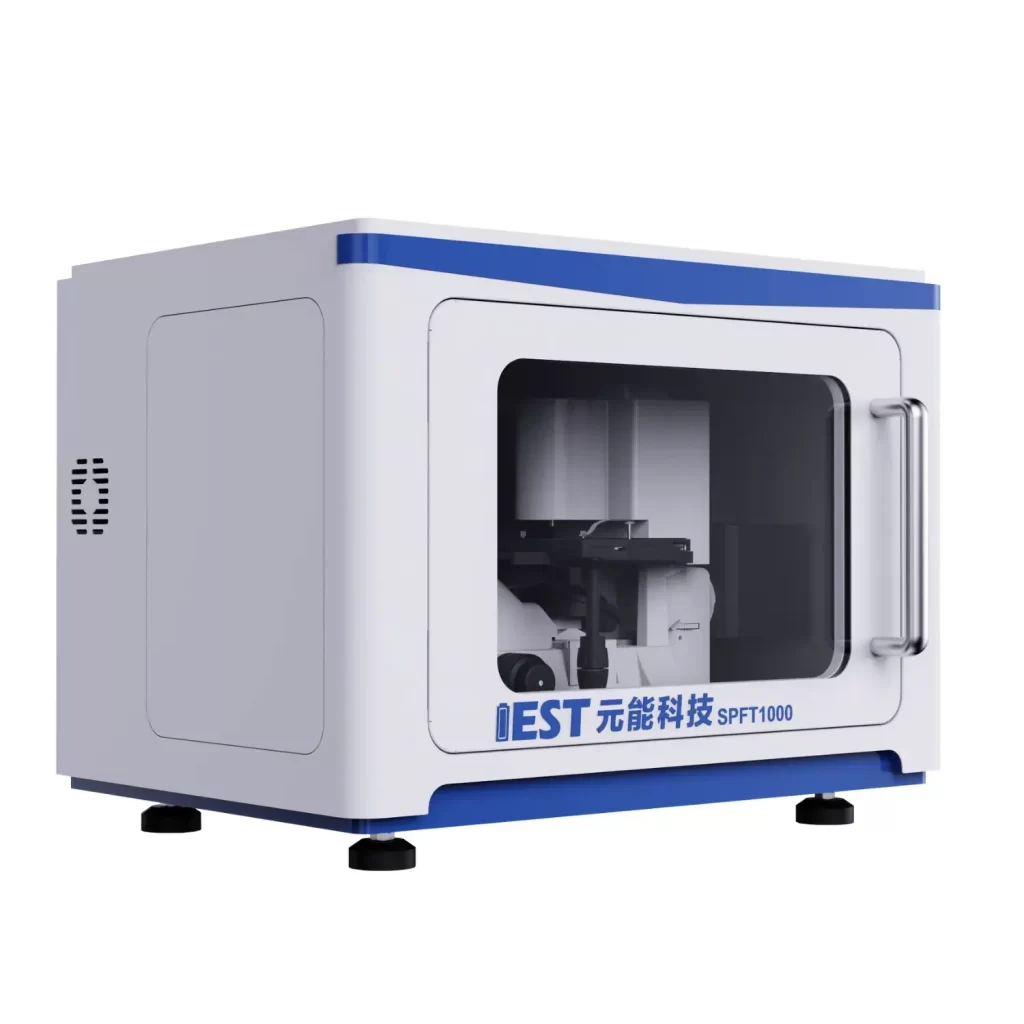
Figure 2. IEST single particle force property testing system (SPFT)
Based on the importance of the single particle mechanical properties of lithium battery materials and the urgent need for single particle characterization by many lithium battery industry R&D personnel, IEST launched the single particle force properties test system (SPFT), as shown in Figure 2.
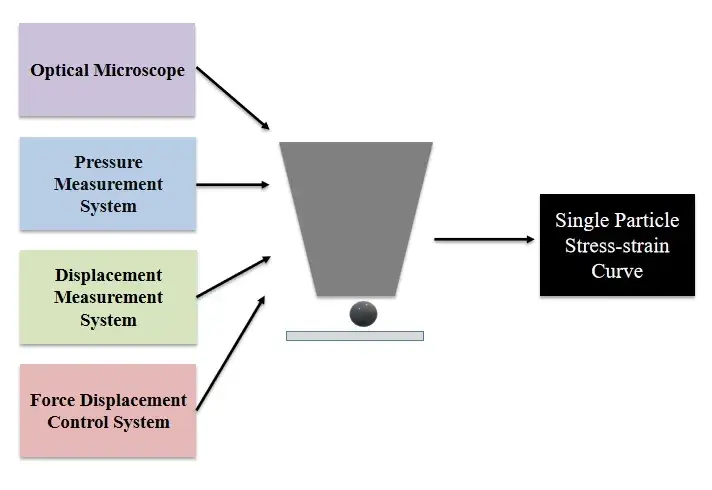
Figure 3. Single particle force properties testing system SPFT functional module
SPFT consists of optical microscope, pressure measurement system, displacement measurement system and force-displacement control system. Through high-precision displacement and pressure control, it can collect the stress-strain curve after the indenter is loaded onto individual particles, and analyze the particle compression and collapse force from the sudden change point of the curve. During the testing process, the morphology of the particles before and after the indentation and the size information of the test particles can be observed with the help of optical microscope.
2.2 Product Functional Characteristics
SPFT is a single particle mechanical property test equipment developed specifically for lithium materials, capable of customized test mode design according to the characteristics of lithium particles, with good specialization, complete basic functions and high cost performance. The structural design is bold and innovative, using the bottom of the optical system, so that the relative position of the indenter and the particles can be observed during the particle testing process, the operation of the personnel is more direct and simple, reducing the pressure bias, the particles are pressed away, or pressed to the multiple particles of the risk, but also from the bottom of the particles before and after the collapse of the collapsed state of the observation of the collapse of the particles before and after the collapse of the specific features of the SPFT as shown in Figure 4.
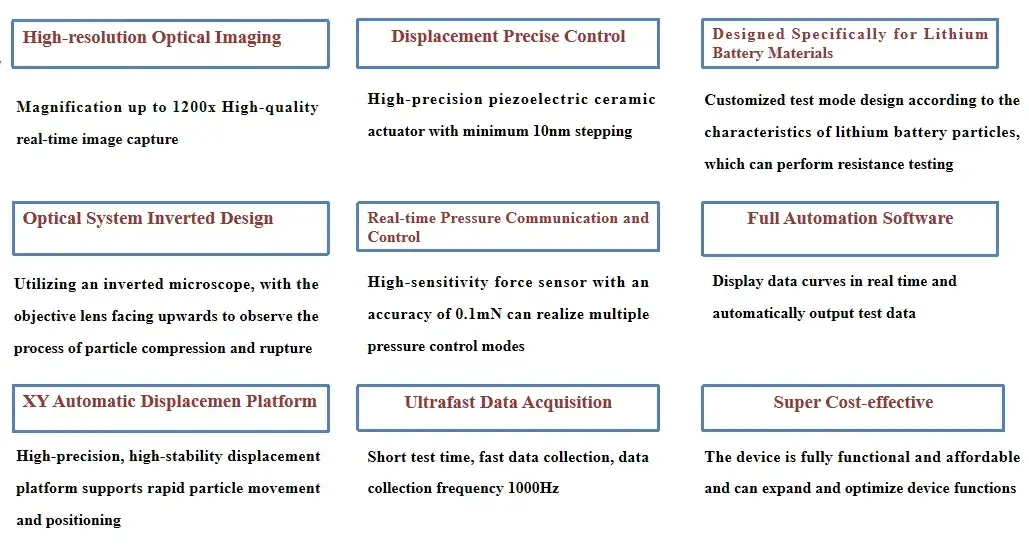
Figure 4. Functional features of single particle force property testing system
2.3 Test methods
(1) Refer to GB/T 43091-2023 Powder Compressive Strength Test Method Execution⁴.
(2) The sample testing steps include: sample making, positioning, mode selection, and test start, and the whole process takes only a few minutes.
(3) The test process, before and after the particles were crushed pictures, as in Figure 5.
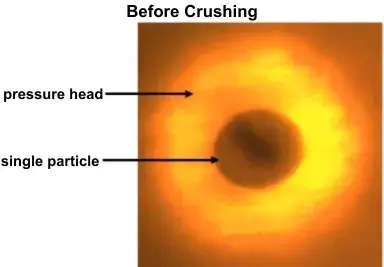
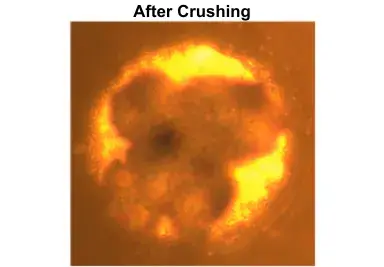
Figure 5. Single particle test process morphology
3. Application Cases
SPFT provides a variety of test modes, testers can choose the appropriate test mode according to the type of sample or different testing needs. In the following case, the controlled displacement stress test mode (Figure 6) is used, i.e., the particles are pressed down at a constant displacement rate to test the change of particle stress during the compression of the particles.
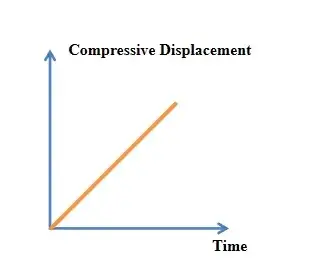
Figure 6. Test pattern to control displacement
The unit of displacement rate is μm/s, the usual range is (0.1~0.5μm/s), and the displacement stability is controlled within ±0.01μm. When the indenter is pressed down to the upper limit of the displacement stroke or the upper limit of the set pressure, the software automatically stops the test and saves the data.
3.1 Ternary particles A1 and A2
The two ternary materials A1 and A2 are sintered from the same precursor, but the sintering process is different, and the particle size D50 is 18 μm.We test the different particles of the two materials by using SPFT2000, and the results are shown in Figure 7. The average crushing force of A1 is 31.2 mN, and the average crushing force of A2 is 35.8 mN.And the amount of change in the displacement (the horizontal coordinates corresponding to the point of crush) of A2 is slightly larger than that of A1, which suggests that A2 is pressed deeper before crushing, with an average of 0.8 μm more.The above results indicate that A2 is pressed deeper before crushing. horizontal coordinate) is slightly larger than that of A1, which indicates that A2 is crushed when it is pressed deeper, with an average of 0.8 μm more.The above results indicate that the compressive resistance of A2 is better than that of A1, and that the hardness of the material can be improved to some extent by changing the sintering process. The method of characterizing the mechanical properties of single particles can provide guidance for the sintering process of the material.
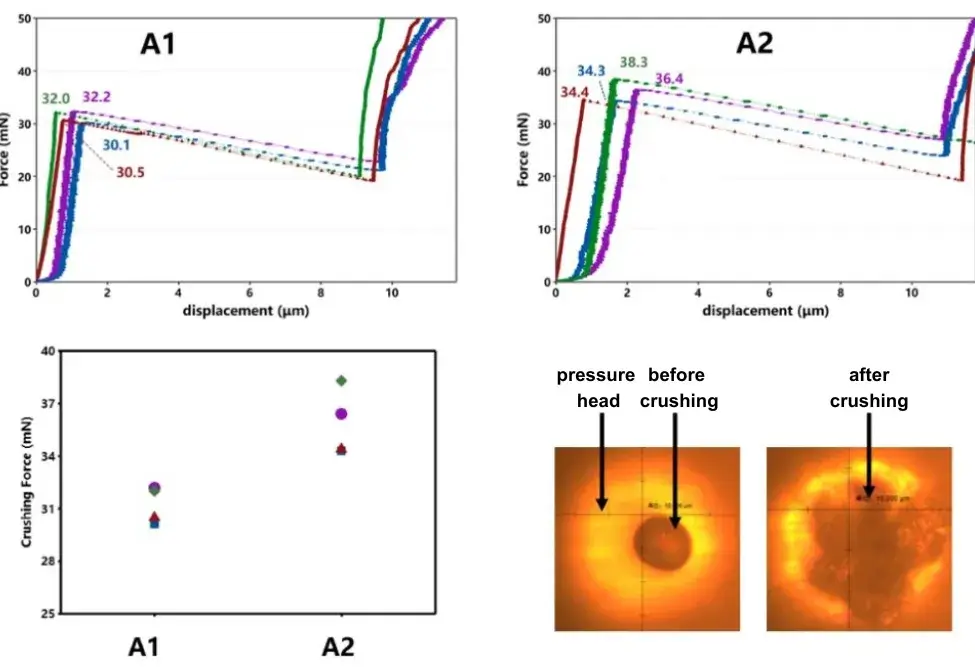
Figure 7. Comparison of the stress-strain curves and crushing forces of A1 and A2
3.2 Ternary particles B1 and B2
Two ternary materials, B1 and B2, are sintered from different precursors, and the particle size D50 is 9.5 μm.We used SPFT2000 to test the single-particle mechanical properties of the two materials, and the results are shown in Fig. 8.The average compression-crushing force of B1 is 4.4 mN, and that of B2 is 9 mN, and B2’s compression-crushing force is larger than that of B1.From the curves, the stress decreases to the zero point after the compression-crushing of B1 , while the force after B2 is crushed drops to 2mN, and there are multiple plateaus in the force-displacement curve as the indenter continues to press down after B1 particles are crushed. This suggests that there may be a faster process of structural crushing of B1 particles, with less material elasticity than B2, and that when the indenter is pressed down after primary crushing, there may be a partially crushed particle that is crushed by secondary crushing.
After these two materials were assembled into a half-cell according to the same process and cycled at 45°C for 30 cycles, the capacity retention of the cell corresponding to B1 was 84%, while the capacity retention of B2 was 94%, and the cycling stability of B2 was better, which was also correlated with the higher hardness of the single particles of B2 in the material layer.
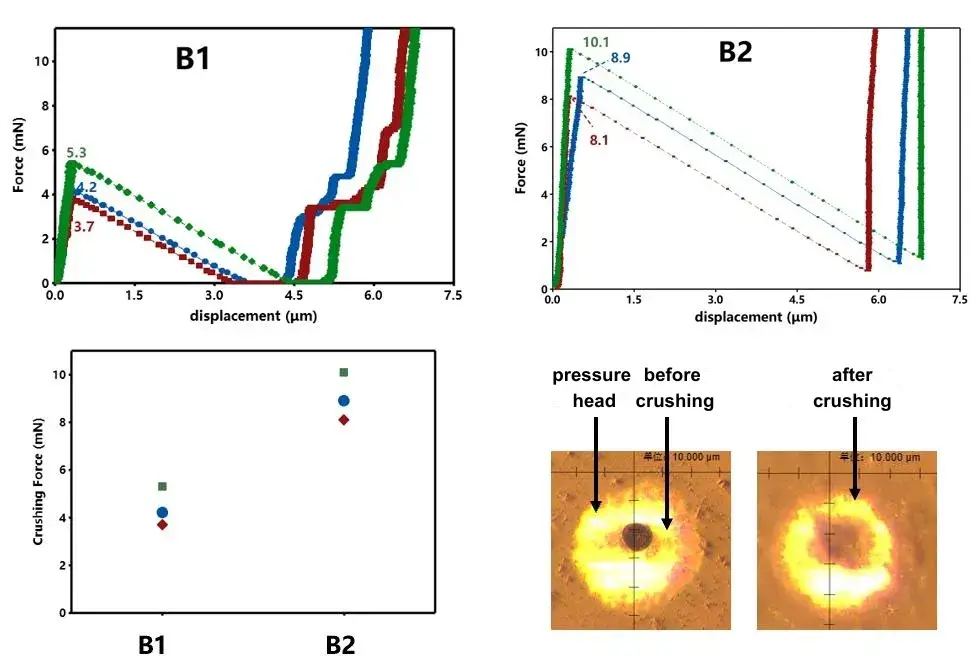
Figure 8. Comparison of the stress-strain curves and crushing forces of B1 and B2
4. More Information on Single Particle Mechanical Testing System SPFT
4.1 Test Object
In addition to the ternary cathode materials for lithium batteries shown in the above cases, other positive and negative electrode materials for lithium batteries, including cathode ternary single crystals, lithium-rich materials, negative electrode graphite, silicon-based, solid electrolytes, etc., can be tested. It should be noted that due to the complex external environmental conditions during particle formation, the internal structures of some material particles have great differences. Therefore, even particles with similar shapes and sizes can exhibit significant variability in their compressive strength.
4.2 Test Particle Size
Single particle size: 5~50um, spherical or cylindrical particles have better testing results.
4.3 Application Scenario
Material R&D departments, quality control departments of material companies, battery cell companies, and material development research groups in universities can be used for material design and optimization verification.
In short, the compressive strength (crush strength) test of single particles of lithium battery materials can be used to evaluate the compressive resistance of the material and can help guide R&D personnel in material optimization, process design, and battery cell development.
5. References
[1] Janghyuk Moona, Jae Yup Jungb, Trung Dinh Hoanga, Dong Young Rheeb, Hyo Bin Leeb, Min-Sik Parkb,*, Ji-Sang Yuc,** The correlation between particle hardness and cycle performance of layered cathode materials for lithium-ion batteries,Journal of Power Sources 486(2021)229359.
[2] Sergiy Antonyuka, Jürgen Tomasa, Stefan Heinrichb, Lothar Mörlb, Breakage behaviour of spherical granulates by compression, Chemical Engineering Science 60 (2005) 4031 – 4044.
[3] Zhang Yusheng, You Xiaoming, He Qing. Study on Crushing Strength of 8YSZ Agglomerated Powders and its Effect on PS-PVD Deposition Behavior[J]. Thermal Spray Technology, 2022, 14(3): 46-57.
[4]GB/T 43091-2023 “Powder Compressive Strength Test Method”
Contact Us
If you are interested in our products and want to know more details, please leave a message here, we will reply you as soon as we can.


