-
iestinstrument
Entering Electrochemistry | An Overview of Electrochemical Impedance Spectroscopy (EIS) for Lithium ion Battery
1. Preface
Electrochemical measurement methods, which assess electrical quantities such as potential, conductivity, and current, explore the relationship between these measurements and the system being analyzed to achieve qualitative and quantitative analysis of system components. Common electrochemical measurement methods include constant current/potential methods, chronoamperometry/chronopotentiometry, voltammetry, and electrochemical impedance spectroscopy.
Compared to other electrochemical techniques, EIS imposes minimal disturbance on the system being studied and provides comprehensive insight into internal electrochemical processes across a wide frequency range. EIS has been widely applied in the lithium-ion battery field, where accurate measurements and analysis of EIS data have led to significant advancements in understanding battery behavior. This article presents an analysis of EIS, using lithium-ion batteries as an example.
2. Basic Principles of Electrochemical Impedance Spectroscopy
Electrochemical impedance spectroscopy, also known as electrochemical AC impedance spectroscopy, is a crucial method for studying the electrochemical performance of lithium-ion batteries. In EIS, a small-amplitude sinusoidal electrical signal is applied across the system, and the resulting output signal is measured. By comparing the input and output signals, the impedance spectrum of the system is obtained. EIS is a frequency-domain measurement technique. Given that lithium-ion batteries are linear, stable, and causal systems, applying a series of sinusoidal voltage signals (with amplitudes of 5 mV, and frequencies ranging from 0.1 Hz to 100 kHz) generates corresponding sinusoidal current responses. The frequency-domain response function Z(ω) = X/Y represents the impedance value at the corresponding frequency, and this series of impedance values constitutes the battery’s impedance spectrum.
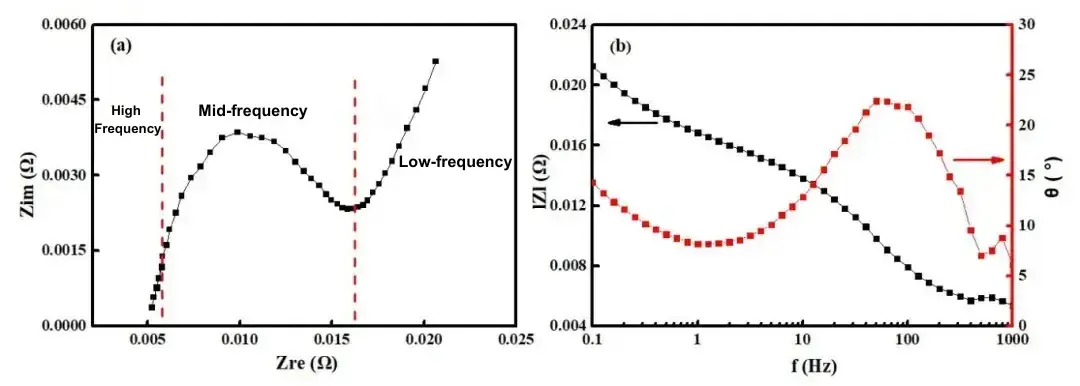
EIS data is typically presented in Bode plots and Nyquist plots. The Nyquist plot uses the real part of the impedance (ZRe) as the x-axis and the negative imaginary part (-ZIm) as the y-axis. This plot provides a clear representation of the time constants for various processes within the electrochemical system. The Bode plot displays the phase shift and magnitude as functions of the applied frequency, often used to assess the performance and stability of electronic circuits. Figure 1 shows Nyquist and Bode plots for a 2500mAh lithium iron phosphate (LiFePO4) battery. The impedance spectrum ranges from 0.1 Hz to 1 kHz, with frequency decreasing from left to right. At 1 kHz, the imaginary part of the impedance is nearly zero. As the frequency decreases, the real part of the impedance increases, and the negative imaginary part exhibits an initial increase, followed by a decrease, and then another increase. The EIS curve comprises three segments: two irregular semicircles in the high and mid-frequency regions, and a straight line in the low-frequency region. By analyzing the electrochemical processes within the lithium-ion battery, it is evident that different processes correspond to distinct curves: the high-frequency region represents the migration and diffusion of lithium ions through the SEI layer, the mid-frequency region reflects the charge transfer process, and the low-frequency region depicts the solid-state diffusion of lithium ions within the active electrode material.

Figure 1. Nyquist Plot (a) and Bode Plot (b) of Electrochemical Impedance Spectroscopy
3. Analysis of Electrochemical Impedance Spectroscopy
3.1 Components of Electrochemical Impedance Spectroscopy
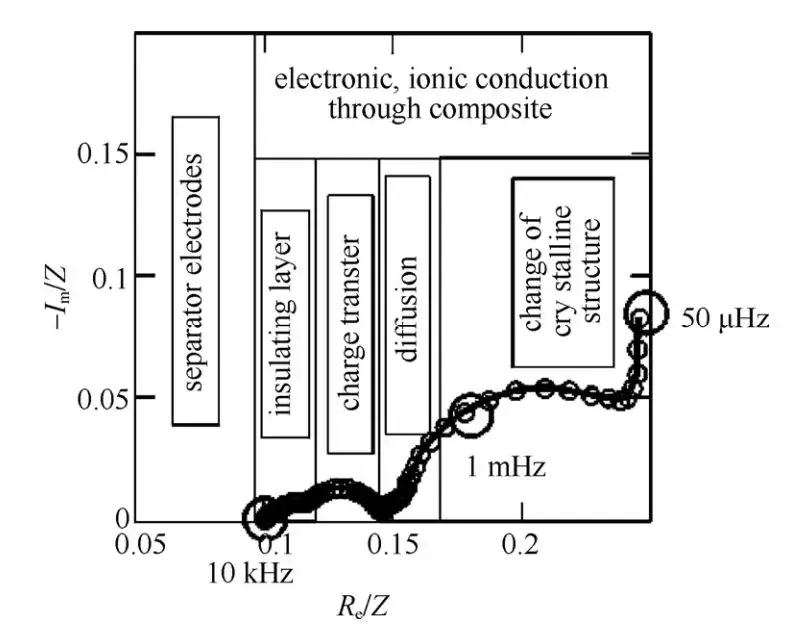
A typical EIS for a lithium-ion battery can be divided into five regions, as shown in Figure 2:
- Ultrahigh-Frequency Region (>10 kHz): This region corresponds to the ohmic resistance associated with the transport of Li+ and electrons through the electrolyte, porous separator, conductors, and active material particles. It appears as a single point in the EIS spectrum and can be represented by a resistance Rs.
- High-Frequency Region: This semicircle corresponds to the diffusion and migration of Li+ through the insulating layer on the surface of active material particles and is represented by an Rsei/Csei parallel circuit, where Rsei represents the resistance of Li+ diffusion through the SEI layer.
- Mid-Frequency Region: This semicircle is associated with the charge transfer process and is represented by an Rct/Cdl parallel circuit. Rct denotes the charge transfer resistance (also known as electrochemical reaction resistance), while Cdl represents the double-layer capacitance.
- Low-Frequency Region: This straight line corresponds to the solid-state diffusion of Li+ within the active material particles and is described by the Warburg impedance Zw.
- Extremely Low-Frequency Region (<0.01 Hz): This region comprises a semicircle associated with changes in the crystal structure of active material particles or the formation of new phases, and a vertical line related to the accumulation and consumption of Li+ within the active material. It is represented by an Rb/Cb parallel circuit in series with an integration capacitance Cint, where Rb and Cb characterize the resistance and capacitance associated with changes in the bulk structure of active material particles, and Cint reflects the intercalation capacitance associated with the accumulation or consumption of Li+.

Figure 2. Typical Electrochemical Impedance Spectroscopy of Li+ Intercalation and Deintercalation Processes in Compound Electrodes
3.2 Equivalent Circuit Model
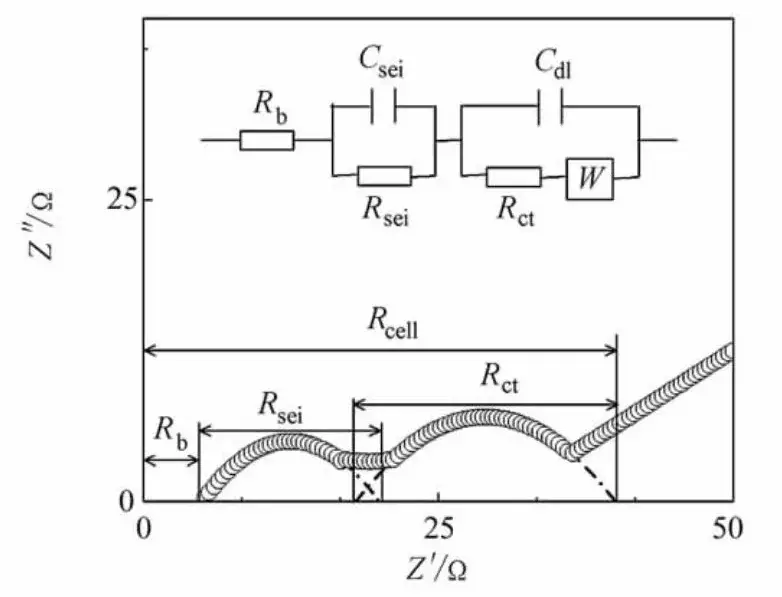
A lithium-ion battery can be modeled as an electrical circuit comprising resistors, inductors, and capacitors. The equivalent model simplifies the battery into a circuit system, allowing the simulation of electrochemical processes. A common equivalent circuit model for lithium-ion batteries is shown in Figure 3. The model components correspond to various impedance contributions across different frequency ranges in the impedance spectrum: Rs represents the ohmic resistance; Rsei and Csei denote the SEI layer resistance and capacitance, corresponding to the high-frequency semicircle; Rct and Cdl represent the charge transfer resistance and double-layer capacitance, corresponding to the mid-frequency semicircle; and W represents the Warburg impedance, associated with Li+ diffusion within the electrode material, depicted as a 45° line relative to the real axis in the complex plane. Common data processing software such as Zview, ZSimpWin, EIS300, LEVMW, Impedance Spectroscopy, and Autolab Nova can be used to select appropriate equivalent circuit models and fit the battery’s EIS data, yielding impedance values for each stage.

Figure 3. Lithium-Ion Battery Impedance Spectrum and Equivalent Circuit Model
4. Application Scenarios
EIS is a vital method for investigating electrochemical interface processes, with extensive applications in the electrochemical field, particularly in lithium-ion batteries. EIS can be used to dynamically measure conductivity, apparent chemical diffusion coefficients, SEI growth and evolution, charge transfer, and mass transport processes. Specific applications include:
- Characterization of Electrode Materials: Testing the EIS of electrode materials in different electrolytes allows for the assessment of conductivity and reaction activity, aiding in the optimization of electrode material design and fabrication.
- Study of Electrochemical Processes in Lithium-Ion Batteries: EIS provides insights into the internal electrochemical processes of batteries, such as ion migration in electrolytes, charge transfer between electrode materials and electrolytes, and electrochemical reaction kinetics, facilitating performance and lifespan optimization.
- Battery State Diagnosis and Fault Diagnosis: EIS can monitor changes in internal electrochemical processes, such as electrode material degradation and variations in electrolyte concentration and temperature, enabling the diagnosis of battery states and faults.
- Assessment of Battery Cycle Life: EIS can evaluate cycle life and degradation mechanisms by measuring impedance changes during battery cycling, helping to formulate battery usage and maintenance strategies.
- Study of Battery Thermal Runaway Characteristics: EIS can be used to investigate battery thermal runaway characteristics, such as the effects of temperature, current density, and capacity on battery impedance, enabling the assessment of battery safety and the design of safer batteries.
- Study of Electrolyte Properties: EIS can measure the conductivity and ion migration characteristics of electrolytes to study their chemical and physical properties, such as ion concentration, mobility, and diffusion coefficients.
In summary, the reasonable use of EIS can help researchers better understand batteries, enhance battery research and development, and has significant practical implications for battery performance research, battery system management, and applications.
5. Conclusion
Given the widespread application of EIS in lithium-ion batteries, Yuneng Technology has developed an electrochemical performance analyzer (Figure 4). In addition to conventional charge-discharge functions, this device integrates CV (cyclic voltammetry) and EIS modules, allowing for EIS testing during battery cycling, as shown in Figure 5. As depicted in Figure 4(b), EIS can be positioned as an independent test module at any step, enabling EIS testing after every N cycles or after the battery reaches a specific state of charge (SOC) during charging/discharging. This process does not require battery disassembly or transportation, improving testing efficiency and accuracy.
Figure 4. IEST Electrochemical Performance Analyzer ERT7008 (a) and Cyclic EIS Testing Steps (b)

Figure 5. EIS Data During Cell Cycling
6. References
[1] Ning B,Cao B,Wang B,et al. Adaptive Sliding Mode Observers for Lithium-ion Battery State Estimation Based on Parameters Identified Online[J].
[2] Zhang Jinlong, Tong Wei, Qi Hanhong, et al. Application of Square Root Sigma Point Kalman Filter to SOC Estimation of Li FePO_4 Battery Pack[J].Proceedings of the CSEE,2016,36(22):6246-6253.
[3] Barsoukov E , Macdonald R J .Impedance Spectroscopy: Theory, Experiment, and Applications[M].Wiley-Interscience, 2005.
[4] Zhang S S, Xu K, Jow T R. Electrochemical impedance study on the low temperature of Li-ion batteries[J]. Electro-chim Acta, 2004, 49 ( 7) : 1057-1061.
Subscribe Us
Contact Us
If you are interested in our products and want to know more details, please leave a message here, we will reply you as soon as we can.


