-
iestinstrument

Abstract
📄 Source Paper
Jan-Patrick Schmiegel, Marco Leißing, Franz Weddeling, Fabian Horsthemke
DOI: 10.1149/1945-7111/ab8409
| Journal: Journal of The Electrochemical Society
| Institutions: University of Münster, BMW Group
1. Author Information and Article Summary
In 2020, Jan-Patrick Schmiegel et al. installed a a gas sampling port (GSP) on the lithium-ion pouch cell, in-situ to realize the battery gas composition analysis of different charging times, different voltage states, different SOC, etc.
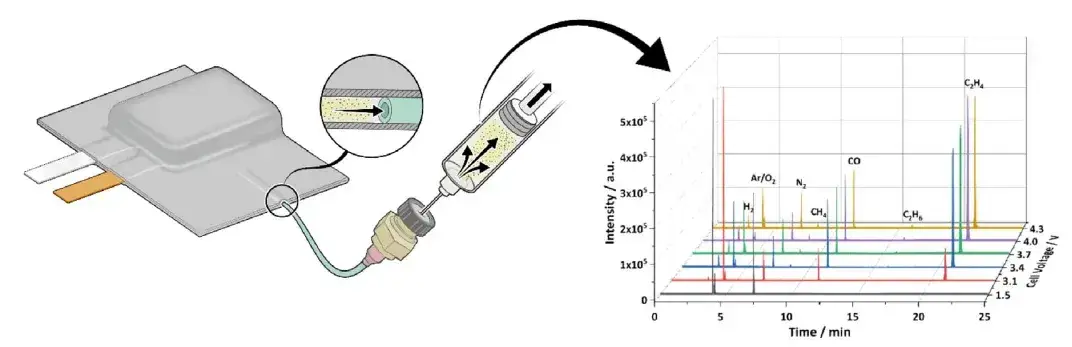 Figure 1. Gas sampling process and voltage-dependent gas chromatograms measured by GC-BID, demonstrating how battery gas composition was tracked across the formation cycle.
2. Sample Preparation and Testing Device
2.1 Cell Information
The study used an NCM-811 / artificial graphite pouch cell system, with a GSP device added to the aluminum-plastic film packaging, as shown in Figure 2.
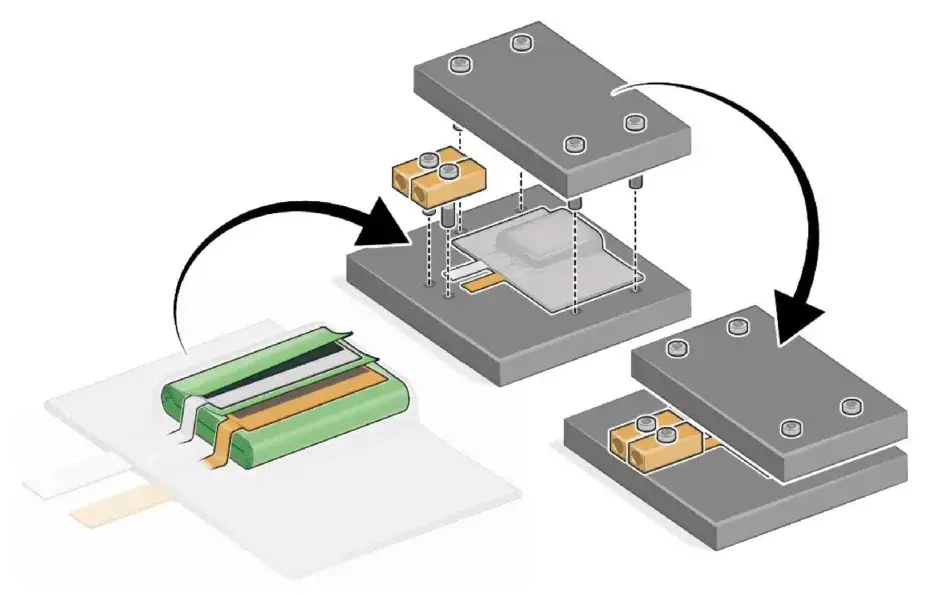
Figure 2. NCM-811/artificial graphite pouch cell measured with a gas sampling port device, demonstrating the mounting flow of the GSP into the aluminum-plastic film bag.
2.2 Electrochemical Test Process
The battery was first held at 1.5V constant voltage for 20 hours (the formation hold step), followed by the transformation step. The gas in the gas bag was then recycled and cycled, with gas composition analyzed regularly throughout the process.
2.3 Introduction of the In-situ Gas Sampling Port
As shown in Figure 3, the gas sampling port (GSP) device is sealed by thermal pressure at the edge of the aluminum-plastic film bag on the side of the battery.
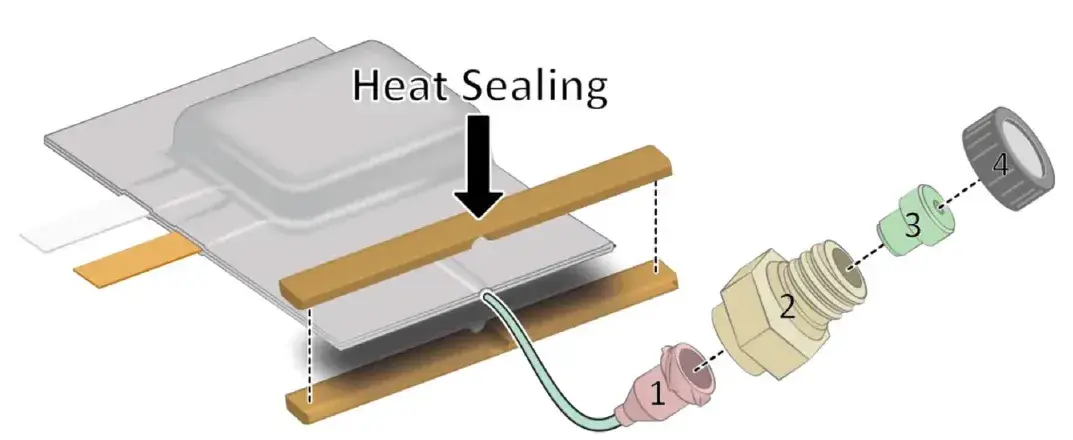
Figure 3. Gas sampling port (GSP) device measured on a pouch cell, demonstrating heat-sealed placement at the film edge for repeated gas extraction.
2.4 In-situ Battery Gassing Composition Analysis
GC-BID equipment was mixed with 200 L of high-purity argon, and 5 L of gas was removed at each CV step for component analysis. The schematic diagram of the gas extraction process is shown in Figure 4.
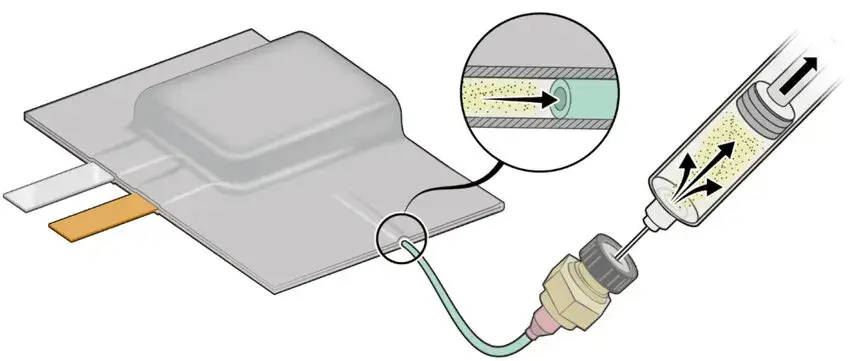
Figure 4. Battery gas extraction process measured with GC-BID equipment, demonstrating 5 L gas removal per CV step against a 200 L high-purity argon background.
2.5 In-situ Cell Volume Measurement
Volume changes of the battery were monitored in real time by measuring the buoyant pull of the cell while submerged in liquid.
2.6 Gas Tightness Verification of the Soft-Pack Battery with Gas Sampling Port
As shown in Figure 5, cycle capacity monitoring was carried out for both the GSP battery and a blank control group. The capacity curves of the two differed by only 1 mAh, indicating good gas tightness of the GSP-modified battery.
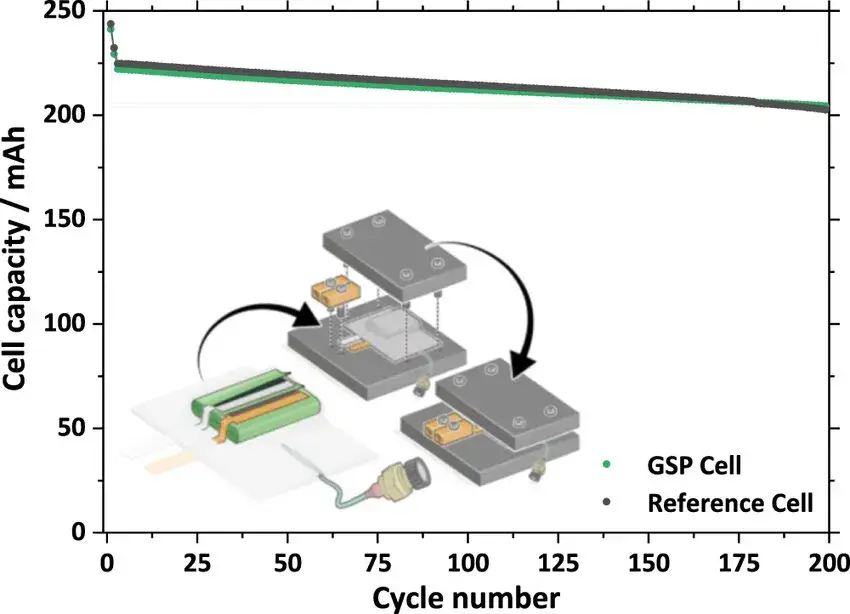
Figure 5. Cycle capacity measured for the GSP-modified cell versus a blank control cell, demonstrating only a 1 mAh difference and confirming the GSP does not compromise gas tightness.
3. Interpretation of Result
3.1 Electrochemical Performance Analysis
Figure 6 compares the differential capacity curves of both battery cycles, showing a reaction peak at approximately 3V corresponding to the reduction of ethylene carbonate (EC) forming the SEI layer on the negative electrode surface. Figure 7 monitors the volume change of a cell initially filled with 1 mL of argon over four consecutive days, finding only about 22 μL of variation — an error attributed to noise signal rather than actual volume change, further confirming good gas tightness of the cell.
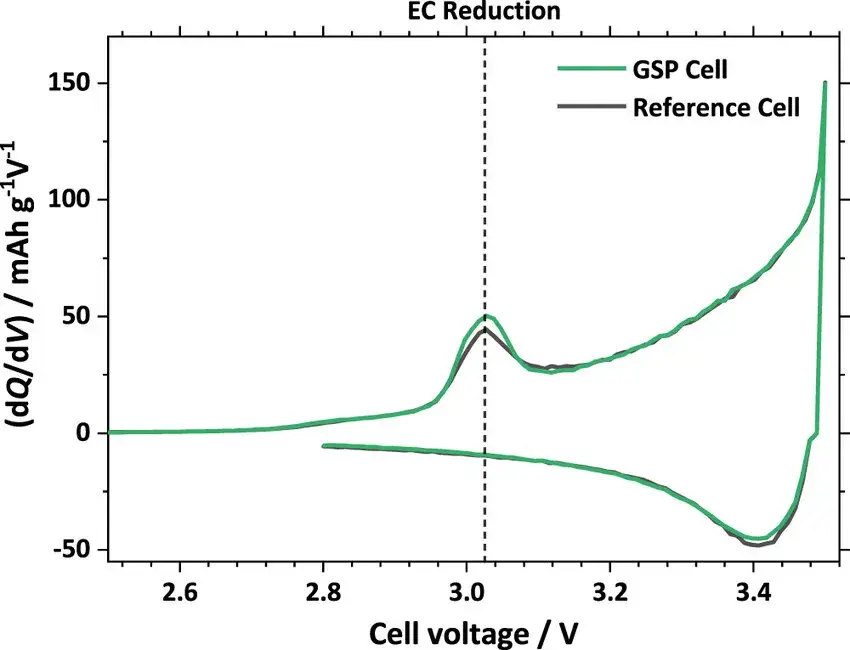
Figure 6. Differential capacity curves measured across two battery cycles, demonstrating a reaction peak near 3V associated with SEI-forming EC reduction.
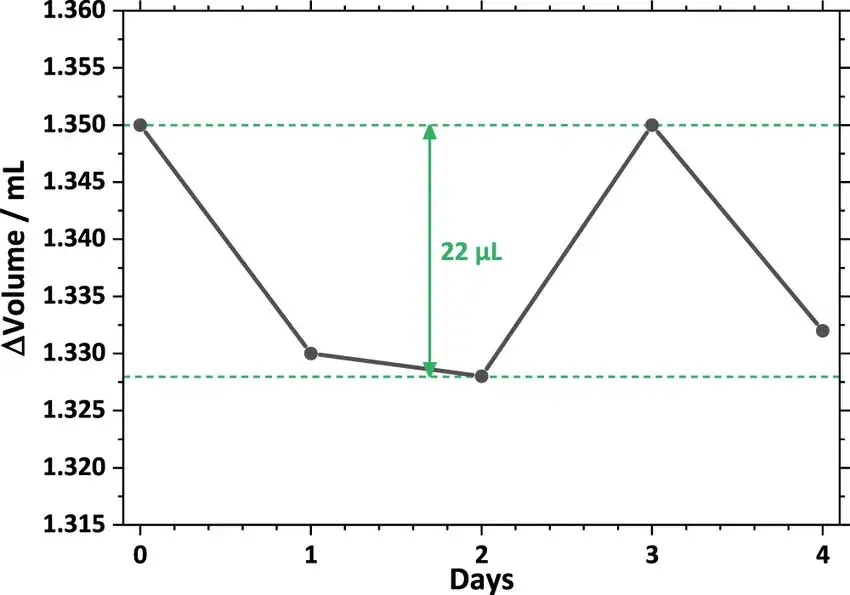
Figure 7. Cell volume change measured over a four-day storage process with GSP, demonstrating minimal drift consistent with good gas tightness.
3.2 Analysis of the Gas Production Mechanism in the Transformation Capacity Stage
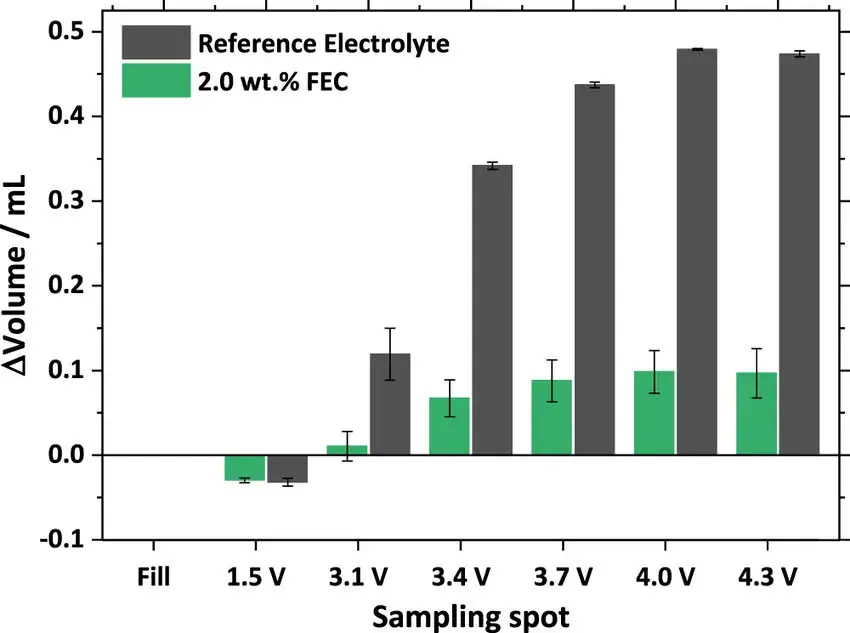
The study compared gas components at different voltage positions during the capacity (transformation) stage for electrolyte systems with and without FEC additive, as shown in Figure 8. The differential capacity curve shows that after FEC addition, the reaction peak near 3V decreases. Comparing gas components at different charging voltages, CO, C2H4, and C2H6 all decreased in the FEC-containing cell, and the total gas volume produced was lower than in the reference electrolyte cell.
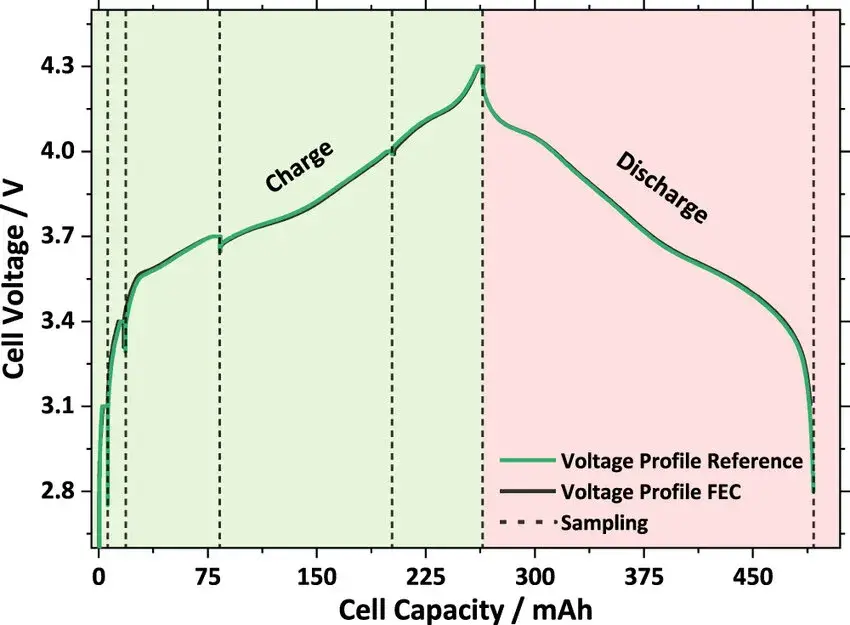
Figure 8. Cell voltage vs. cell capacity measured for the modified formation cycle of NCM-811, demonstrating the FEC-additive comparison against the reference electrolyte.
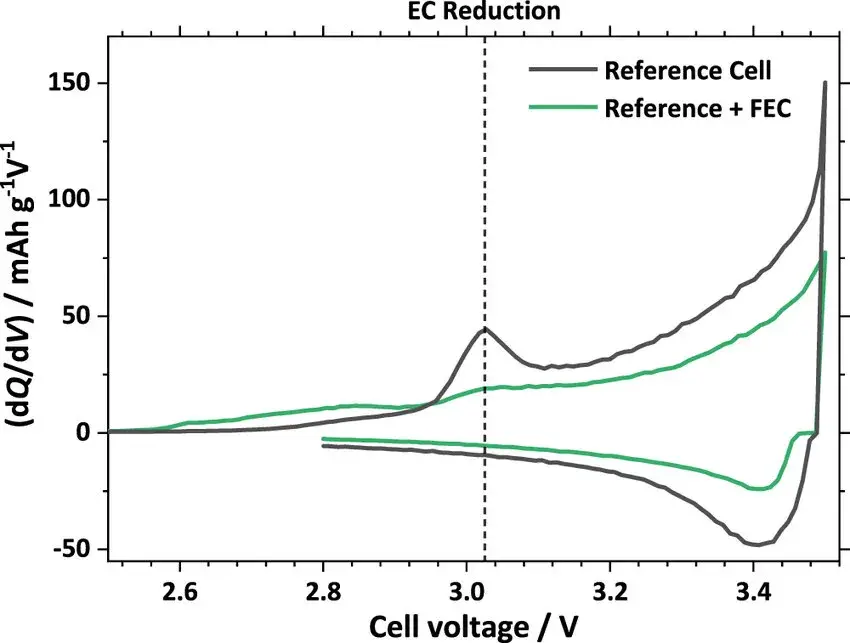
Figure 9. Differential cell capacity vs. cell voltage measured for the first formation cycle of NCM-811, demonstrating the voltage positions selected for gas sampling.
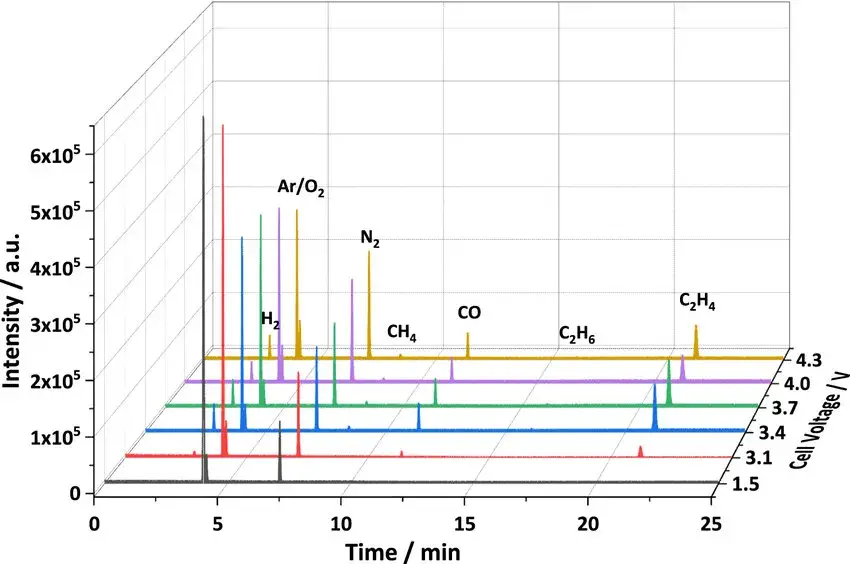
Figure 10. Gas composition measured by GC-BID chromatogram during the formation procedure at different cell voltages, using the reference electrolyte (1 M LiPF6 in EC:EMC, 3:7 by wt.) plus 2.0 wt% FEC.
4. Summary
In this study, a GSP-based gas extraction device was assembled into a lithium-ion pouch cell to realize in-situ battery gas composition analysis, enabling real-time monitoring of gas production components at different voltage positions throughout the capacity process. The approach supports in-depth analysis of the underlying battery gas production mechanism.
The GSP-based method demonstrated above requires manually cycling a gas bag and running offline GC-BID analysis at each sampling point — effective for detailed composition studies, but labor-intensive for routine, continuous gassing monitoring across many cells or long test durations. For labs seeking a continuous, single-instrument alternative to this offline workflow, an in-situ gas volume monitoring instrument addresses the same underlying measurement goal — real-time gas production tracking — without repeated manual gas extraction.
5. IEST In-Situ Battery Gassing Tester: A Continuous Alternative to Manual Gas Sampling
IEST’s in-situ gas production volume monitoring instrument, model GVM2200, is built to track gas production continuously rather than at discrete manually-sampled points. It supports a test temperature range of 20°C to 85°C, dual-channel (2-cell) synchronous testing, and 1 μL resolution, with good long-term stability. It can synchronously monitor gas production volume changes of cells under cycling, storage, overcharge, and discharge conditions, supporting materials and cell R&D.
| Testing Matrix | GSP + Offline GC-BID (This Study) | IEST GVM2200 In-Situ Monitoring | Implication for Battery R&D |
|---|---|---|---|
| Measurement type | Gas composition (chemical species) via periodic manual extraction | Gas production volume, continuous and automated | Choose GSP/GC-BID for species-level mechanism studies; choose GVM2200 for continuous production-volume trend monitoring |
| Sampling workflow | Manual gas bag cycling and extraction at each CV step (5 L per step) | No manual extraction — synchronous, real-time volume tracking | Reduces operator time for long-duration cycling, storage, or overcharge tests |
| Resolution / range | Species-specific (CO, C2H4, C2H6, etc.) | 1 μL volume resolution; 20°C–85°C; dual-channel | Enables fine-grained detection of gassing onset across temperature-controlled conditions |
| Test conditions supported | Formation cycling at controlled CV steps | Cycling, storage, overcharge, and discharge conditions | Supports broader abuse and aging test coverage beyond formation alone |
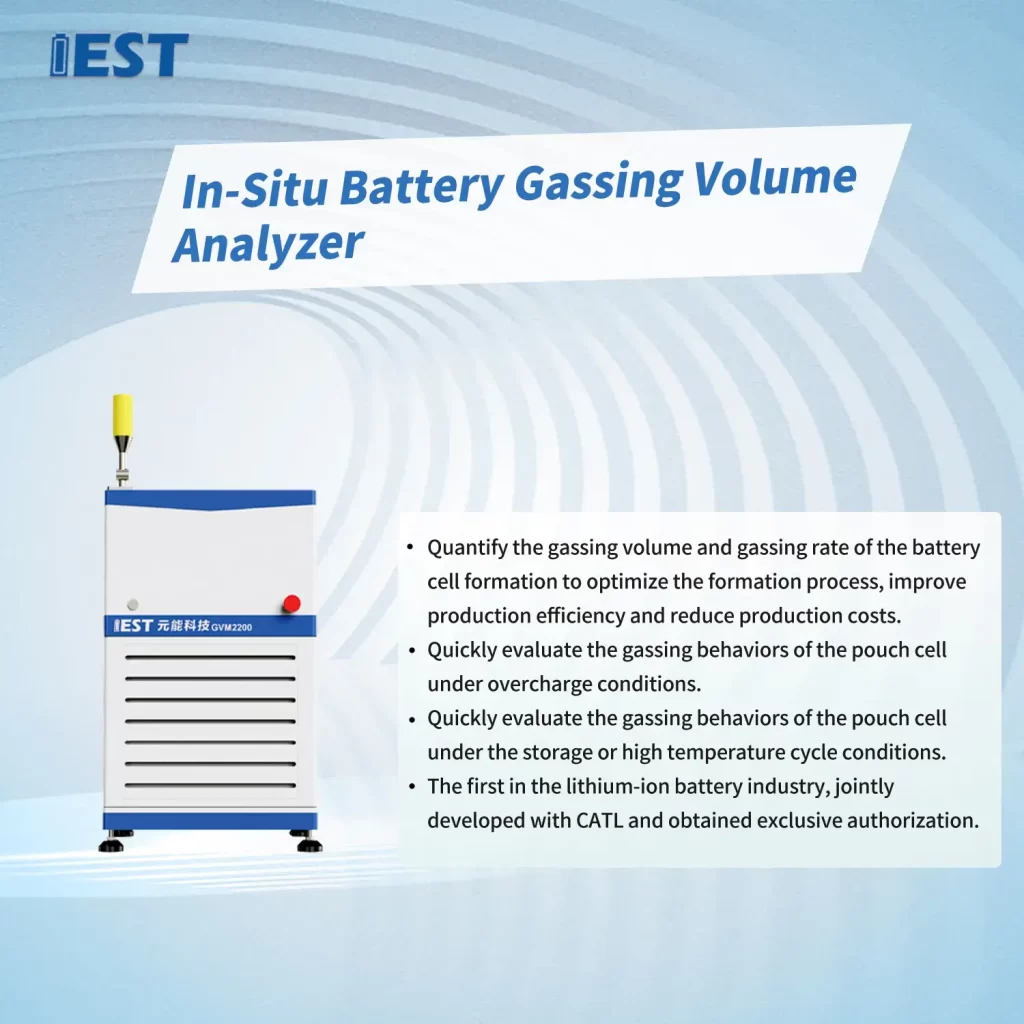
Figure 12. IEST In-Situ Battery Gassing Volume Analyzer (GVM Series), demonstrating dual-channel, 1 μL-resolution gas production volume monitoring across 20°C–85°C.
7. FAQs
7.1 What is in-situ battery gas analysis?
In-situ battery gas analysis is a method for measuring the composition or volume of gases generated inside a lithium-ion cell in real time, without disassembling or destroying the cell after each measurement. It allows gas production to be tracked at specific voltages, states of charge, or over extended cycling and storage periods.
7.2 What is a gas sampling port (GSP) on a pouch cell?
A gas sampling port (GSP) is a small, heat-sealed access point built into the aluminum-plastic film packaging of a pouch cell. It allows internal gas to be extracted periodically for external composition analysis, such as gas chromatography, while the rest of the cell remains sealed.
7.3 How is battery gas composition analysed in the lab?
Battery gas composition is typically analysed by extracting a fixed volume of gas from the cell — for example, through a gas sampling port — and injecting it into a gas chromatograph with a barrier discharge ionization detector (GC-BID) to identify and quantify individual gas species such as CO, C2H4, and C2H6.
7.4 What causes gas production in lithium-ion batteries?
Gas production in lithium-ion batteries is primarily driven by electrolyte decomposition reactions, such as ethylene carbonate (EC) reduction during SEI formation on the negative electrode. Electrolyte additives such as FEC can reduce gas production by modifying the SEI formation reaction pathway, as shown by the CO, C2H4, and C2H6 reductions observed in FEC-containing cells.
7.5 How do I choose between offline GC-BID gas analysis and in-situ gas volume monitoring?
Selecting a method depends on whether the research goal is chemical species identification or continuous production-volume tracking. Offline GC-BID gas sampling identifies specific gas species at discrete voltage or SOC points, while an in-situ gas volume monitor such as the IEST GVM2200 continuously tracks total gas production across cycling, storage, or abuse conditions with 1 μL resolution and dual-channel testing from 20°C to 85°C, without manual extraction.
