1. Research Background: LLZO Solid Electrolytes for Solid-State Batteries
Metallic lithium attracts significant attention due to its exceptionally high capacity (3860 mAh/g). Solid-state lithium batteries (SSLBs) are considered strong contenders against commercial liquid electrolyte lithium-ion batteries (LiBs) due to their safety and potential energy density advantages. Among solid-state batteries, garnet-type Li₇La₃Zr₂O₁₂ (LLZO), a type of oxide solid electrolyte, is regarded as a promising solid electrolyte candidate for high-safety lithium metal-based solid-state batteries because of its electrochemical stability against lithium metal and high lithium-ion conductivity.
Conventional LLZO synthesis typically uses isopropanol (IPA) as a solvent. However, during preparation, moisture absorbed by LLZO and IPA can lead to proton exchange issues and lithium-enriched contamination problems during mixing and forming, potentially affecting LLZO performance. To address this, Dr. Huang Xiao and team members developed a novel solvent-free process for preparing LLZO electrolytes using highly hydrophobic polytetrafluoroethylene (PTFE) and polyurethane (PU). They conducted an in-depth comparison with the wet process, examining differences in microstructure, phase composition, ionic/electronic conductivity, and other electrochemical properties.
2. Experimental Methods: Comparing Solvent-Based and Solvent-Free LLZO Preparation
Four processing pathways were evaluated using LiOH·H₂O, La₂O₃, Ta₂O₅, and ZrO₂ precursors:
-
1WW – Wet mixing / Wet forming
-
2WD – Wet mixing / Dry forming
-
3DW – Dry mixing / Wet forming
-
4DD – Dry mixing / Dry forming
The preparation process is illustrated in Figure 1; detailed preparation parameters are listed in Table 1.
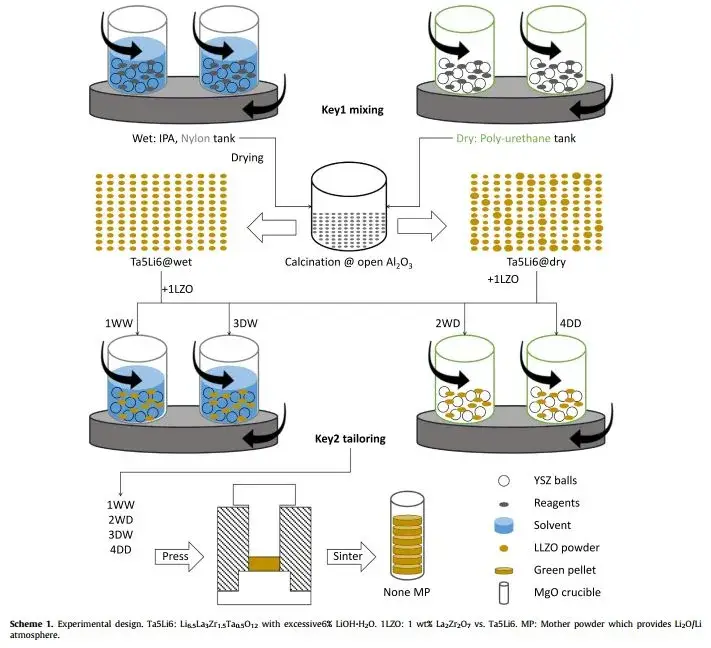
Figure 1. LLZO orthogonal experimental preparation scheme
Table 1. LLZO preparation process parameters

For testing, a laser particle size analyzer was used for powder particle size testing, SEM & EDS for morphological characterization, and the Toyo-developed LN-Z2-HF ultra-high-frequency impedance testing system was used to measure the material’s ionic conductivity at different temperatures. Lithium-lithium symmetric cell tests for critical current density and long-term stability were also performed.
3. Results & Characterization: LLZO Powder Morphology and Phase Composition
3.1 Powder Morphology & Surface Chemistry
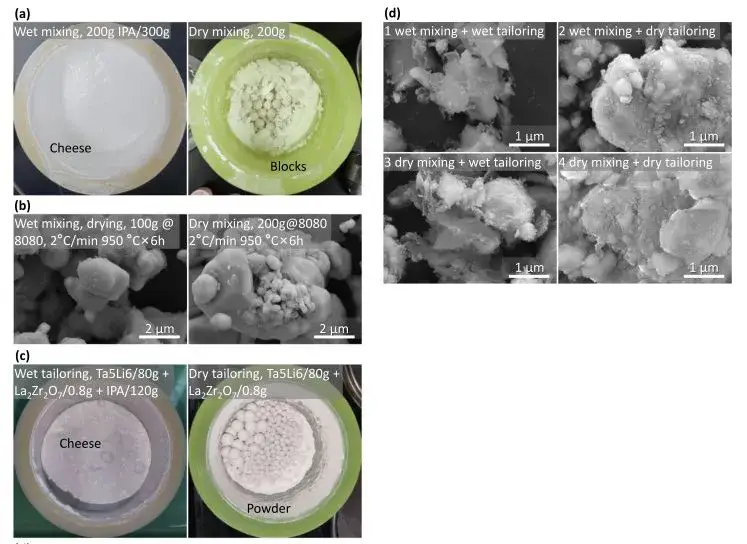
Figure 2. LLZO preparation process
The slurry after wet preparation using IPA as the solvent exhibited a viscous, cheese-like consistency, leading to significant processing difficulties. However, the sintered particles were smaller, with good uniformity, though the tap density was lower. In contrast, dry-mixed powders showed larger, flake-like structures with poorer mixing uniformity. After sintering, the powder particle size was larger, and the tap density was twice that of the wet method. Particle size test results (Figure 3a) for Ta-doped Li₆.₅La₃Zr₁.₅Ta₀.₅O₁₂ (Ta-LLZO) powders immediately after calcination from wet and dry methods align with the morphological results in Figure 2(b). The trimodal distribution for wet-processed 1WW and 3DW samples also corresponds to the morphology in SEM images. The unimodal distribution for dry-processed 2WD and 4DD samples deviates significantly from the actual morphology. SEM reveals flake-like substances surrounding large particles in wet-prepared LLZO, whereas dry-prepared powder surfaces are relatively clean. This indicates that dry-prepared particles exhibit lower levels of protonation compared to the severe surface contamination in wet-prepared samples. In short, the wet method offers advantages in mixing and forming uniformity, effectively reducing particle size with the aid of IPA. The dry method’s advantages include less time consumption, easier handling, and a tap density twice that of the wet method.
3.2 Phase Analysis (XRD)
From XRD patterns (Figure 3b), the calcined Ta-LLZO powders primarily consist of the cubic LLZO phase. Dry-mixed powders after calcination contain noticeable tetragonal phase and La₂O₃ impurities. Furthermore, the reduction in XRD peak intensity for dry-prepared samples is greater than for wet methods, potentially related to Full Width at Half Maximum (FWHM) broadening and the degree of amorphization of crystallized particles. The results suggest that solvent wetting and interactions between grinding media and LLZO particles generate soft, lithium-enriched contamination. The solvent-free dry route, lacking solvent, effectively disrupts the LLZO lattice. On the other hand, the c-LLZO lattice expands significantly after wet grinding, primarily attributed to protonation. The LLZO lattice expansion after dry route preparation is smaller, likely stemming mainly from the amorphization of LLZO particles.
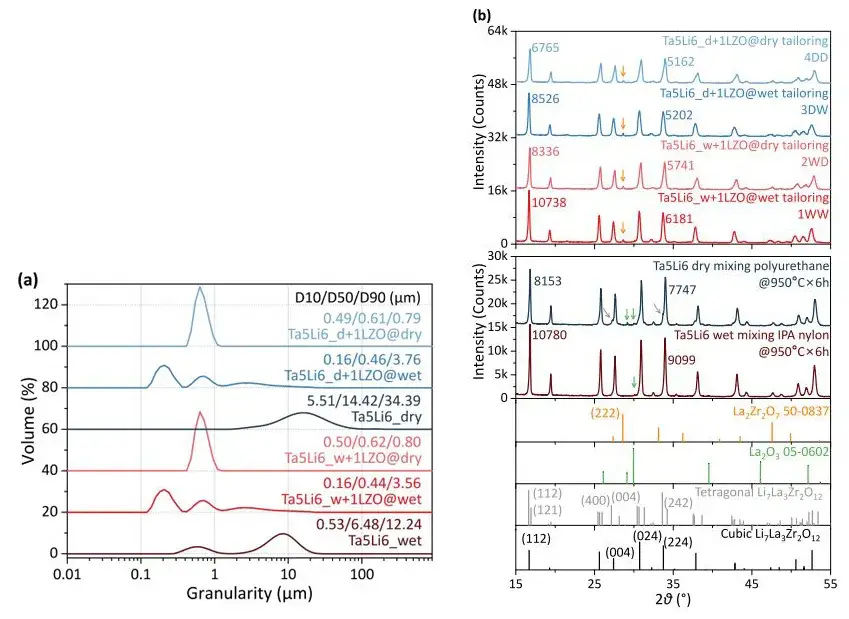
Figure 3. Experimental particle size results and XRD test results
Table 2. LLZO XRD test results

3.3 Protonation and Contamination
From FTIR and TG-DSC tests (Figure 4), the total weight loss for 1WW and 3DW powders, excluding IPA, is greater than for 2WD and 4DD, indicating significant protonation in wet-formed powders. The dry method holds the key advantage of avoiding protonation. Simultaneously, SEM examination of the cross-sections of green pellets pressed from 1WW & 3DW powders clearly shows contaminated areas, whereas 2WD & 4DD show no obvious dark regions, suggesting lesser or no contamination.

Figure 4. FTIR, TG and SEM results
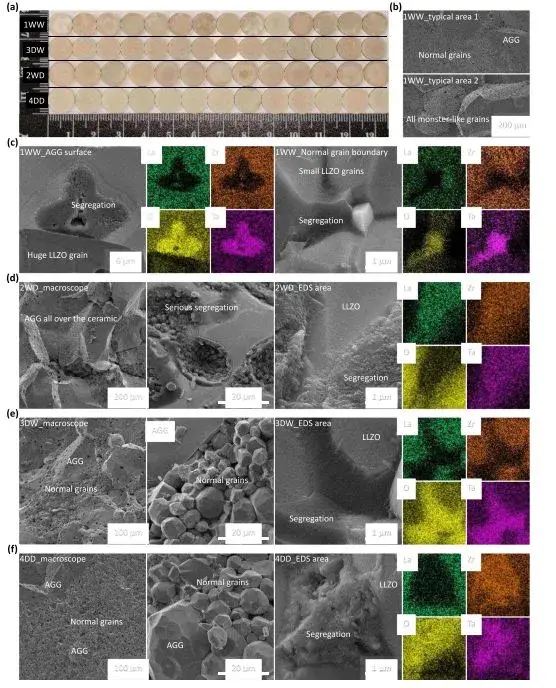
Figure 5. Ceramic pellet and SEM-EDS test results
4. Grain and Grain Boundary Impedance Analysis of LLZO Electrolytes
Impedance analysis up to 100 MHz (Toyo LN-Z2-HF) at temperatures as low as -55°C was used to distinguish grain and grain boundary contributions. Because the typical relaxation times for grains and grain boundaries are very close, Nyquist plots for solid electrolytes from all four processes did not show distinct semicircles at any temperature. The Nyquist plots were consistent with results measured at ambient temperature from 3 GHz to 1 MHz using a Keysight E4991B instrument (Figure 6).
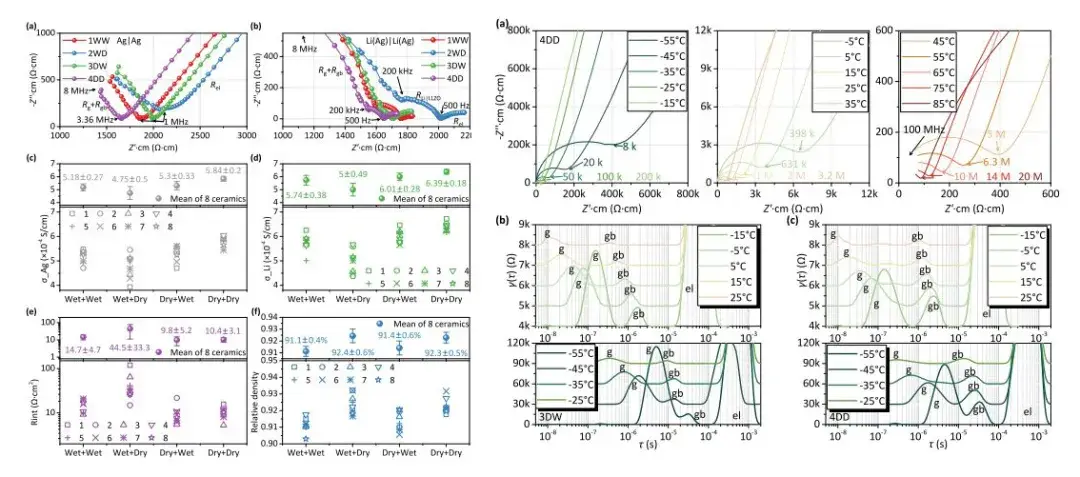
Figure 6. Experimental impedance and high-frequency Keysight test results
Ionic resistance was measured at different temperatures using high-frequency testing (100MHz-1kHz) and fitted. The calculated grain boundary resistance from DRT results was fitted separately for the low-temperature region (-55 to 25°C) and the mid-temperature region (-15 to 25°C) to calculate activation energy. The activation energy data (Figure 7) shows that the interfacial activation energy for 1WW, 2WD, 3DW, and 4DD is approximately 0.3 eV. This exceptionally low activation energy indicates very fast lithium-ion transport between the Li anode and the LLZO solid electrolyte. The activation energies obtained in this test are higher than those previously reported in literature, primarily because previous equipment could not achieve frequencies above 1 MHz, leading to lower fitted activation energy values. This demonstrates the significant impact of impedance test frequency on ionic conductivity and activation energy results.
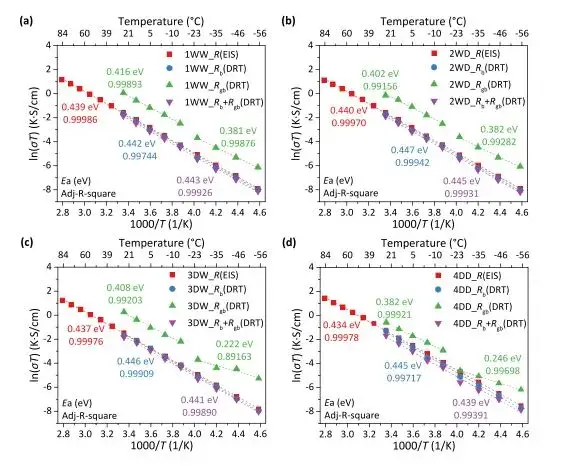
Figure 7. Activation energy test results
5. Electrochemical Performance: Symmetric Cell Cycling and Critical Current Density
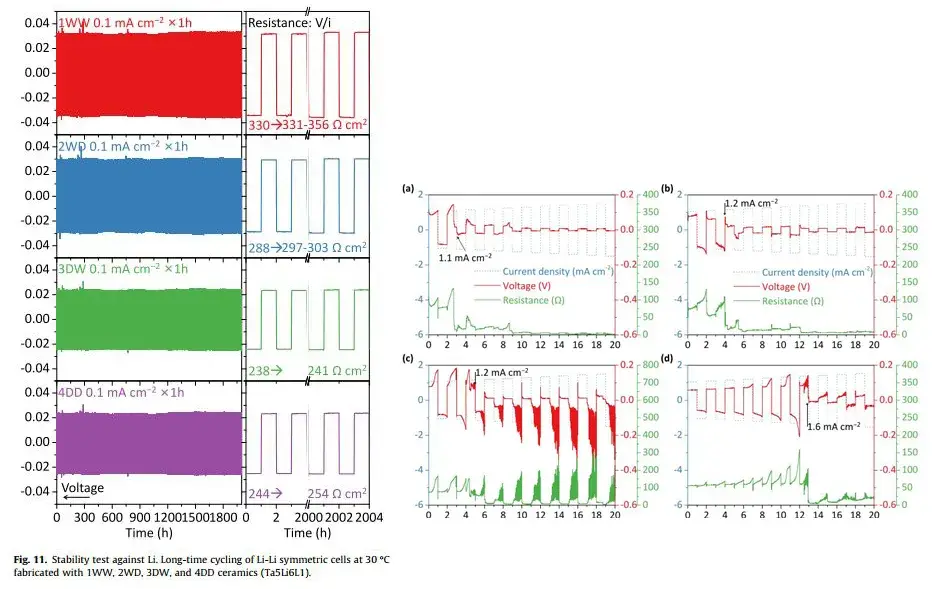
As shown in Figure 8, long-term cycling tests used a current density of 0.1 mA/cm² and an areal capacity of 0.1 mAh/cm². The polarization voltage barely increased over 2000 hours. Pellets from 1WW, 2WD, 3DW, and 4DD were stable against the metallic Li anode, proving no side reactions between the Li anode and the solid electrolyte. Critical Current Density (CCD) tests at 60°C assessed stability against lithium dendrites. The 4DD sample exhibited a high CCD of 1.6 mA/cm² at 1.6 mAh/cm², while the other three samples short-circuited at 1.1-1.2 mA/cm².
Figure 8. Lithium-Lithium symmetric cell long-term cycling and critical current density tests
6. Summary: Advantages of Solvent-Free Processing for LLZO Electrolytes
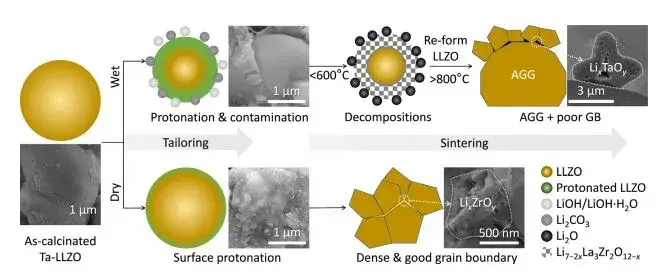
As summarized in Figure 9, this study compared the differences between wet processes using isopropanol as a solvent and dry processes involving direct powder mixing for LLZO preparation. The wet process led to severe protonation-induced surface contamination. LLZO prepared via the dry process, despite facing challenges like poorer homogeneity during grinding, reduced the degree of protonation and side reactions, favored ceramic sintering, and demonstrated excellent performance. Concurrently, the dry route significantly reduces time and cost consumption, offering the industry an efficient and environmentally friendly strategy for the industrial production of LLZO powders and ceramics.
Figure 9. Changes in the molding process of different preparation processes
7. Technical Insight: High-Frequency Impedance Testing for Solid Electrolytes
In the measurement of ionic conductivity for solid electrolytes, an alternating electric field is typically applied to the electrolyte. Under this field perturbation, Li⁺ ions migrate within the grains, leading to the accumulation of cathode and anode charges on either side of the grain boundaries, thereby forming an electrical double layer. By applying sinusoidal AC signals at varying frequencies, the impedance of the solid electrolyte can be determined across different frequencies due to the interplay of resistive and capacitive effects.
For solid electrolytes, distinguishing between grain and grain boundary impedance contributions requires testing frequencies exceeding 7 MHz. However, at frequencies above 7 MHz, parasitic resistance and inductance from instrument circuitry and connections significantly distort measurement results. Consequently, commercially available electrochemical workstations rarely support frequencies above 7 MHz.
Building on this, IEST Instrument offers an ultra–high‑frequency impedance measurement system that, thanks to optimized circuitry, can perform impedance tests up to 100 MHz over a wide temperature range from 90 K (–183 °C) to 873 K (600 °C). This system enables the separation of grain and grain‑boundary impedance in solid electrolytes and other materials for independent characterization, and it also allows calculation of the ionic‑transport activation energy.
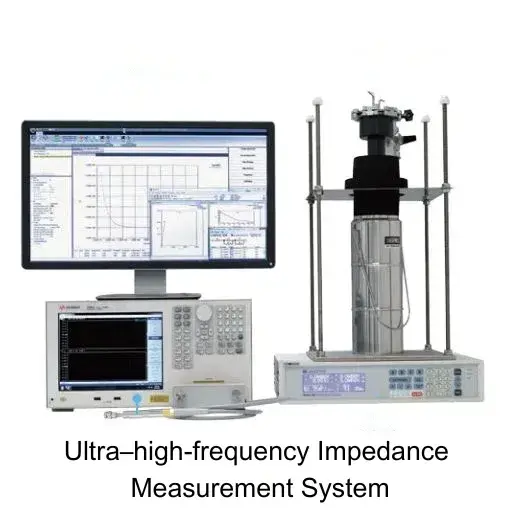
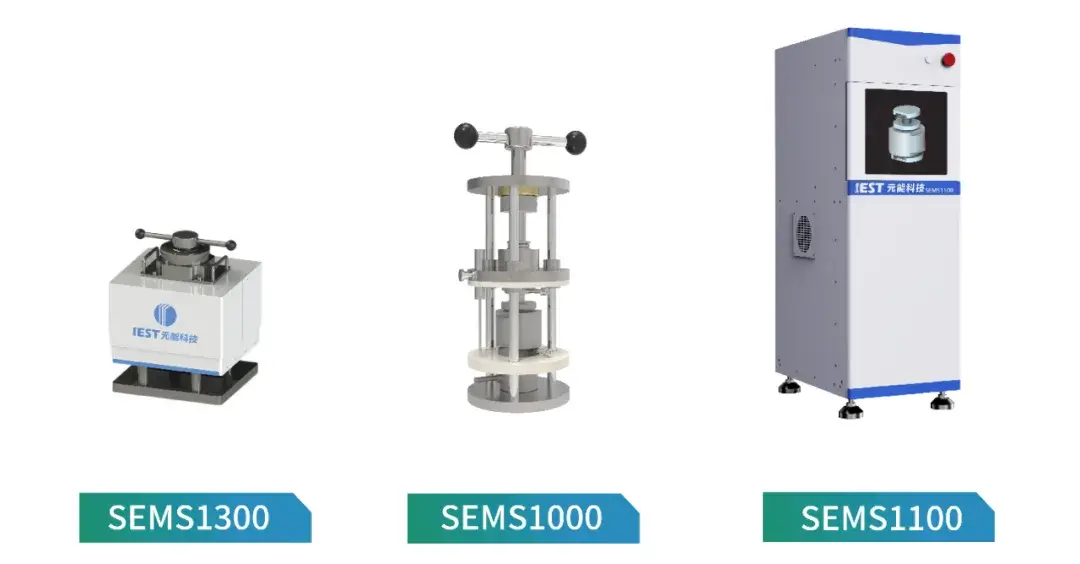
Additionally, IEST Instrument has pioneered a multifunctional Solid Electrolyte Test System(SEMS Series) specifically for solid electrolyte samples. This fully automated platform integrates pellet pressing, electrochemical measurement, and data analysis into one unit. Its all‑in‑one design includes a pressure‑application module, an electrochemical test module, a density‑measurement module, and a ceramic‑disc pressing and clamping module. SEMS is suitable for in situ EIS testing of various oxide, sulfide, and polymer electrolytes under different applied pressures.
