-
iestinstrument

Abstract
📄 Source Paper
A. J. Louli, Jing Li, S. Trussler, Christopher R. Fell, and J. R. Dahn.
DOI: 10.1021/jacs.6c03598
| Journal: Journal of The Electrochemical Society
✓ IEST GVM2200 Gassing Volume Analyzer and IEST SWE2110 In-Situ Cell Swelling Testing System used in this research
1. Introduction
Silicon anodes offer a substantially higher specific capacity than graphite, but their practical use is limited by dramatic volume changes during lithiation/delithiation. Silicon anode volume expansion refers to the dimensional increase of the silicon-containing negative electrode as lithium ions are incorporated into the silicon lattice during charging — a process that can reach ~280% volumetric change for pure silicon and causes significant mechanical stress on the electrode structure and cell housing.
Understanding and quantifying these changes at the electrode and cell level is essential for designing durable silicon anodes and reliable battery packs. Here we synthesize experimental in-situ measurements and component-level analysis to quantify how silicon, graphite, and cathode materials each contribute to net pouch-cell expansion and mechanical stress. Throughout this article we highlight techniques for accurate anode thickness measurement and tracking silicon anode volume expansion percentage in operating cells.
2. Experimental Procedure
2.1 Fabrication of Three Types of Pouch Cells:
-
Cell A — Li(Ni₁₋ₓ₋ᵧCoₓAlᵧ)O₂ (NCA)/SiO-graphite (Supplier A). Fully charged to 4.20 V, nominal capacity 260 mAh.
-
Cell B — LiCoO₂ (LCO)/Si Alloy-graphite (Supplier B). Fully charged to 4.35 V, nominal capacity 230 mAh.
-
Cell C — Li(Ni₁₋ₓ₋ᵧCoₓAlᵧ)O₂ (NCA)/nano Si-C (Supplier C). Fully charged to 4.40 V, nominal capacity 165 mAh.
These combinations provide a range of silicon morphologies and cathode chemistries to compare expansion behavior and cycling stability.
| Cell | Cathode | Anode | Charge cutoff | Capacity |
|---|---|---|---|---|
| A | NCA | SiO-graphite | 4.20 V | 260 mAh |
| B | LCO | Si alloy-graphite | 4.35 V | 230 mAh |
| C | NCA | Nano Si-C | 4.40 V | 165 mAh |
2.2 Testing Equipment and Procedures:
All tests combined electrochemical cycling with simultaneous in-situ characterization using four complementary measurement methods:
-
In-situ X-ray diffraction (XRD) to determine phase changes and volume trends of cathode active material during charge/discharge.
-
In-situ total cell volume measurement— performed using IEST’s GVM2200 gas/volume analyzer, capturing net cell swelling at 1 µL resolution over a 20–85°C operating range.
-
In-situ force/stress measurement — performed using the IEST SWE Series swelling testing system, recording expansion force under both constant-gap and constant-pressure conditions.
-
In-situ thickness sensors — monitoring electrode stack and anode surface displacement over cycling, enabling precise anode thickness measurement and silicon anode swelling quantification without cell disassembly.
Schematic setups for stress and thickness measurement are shown in Figure 1. (See the original study for full experimental drawings and calibration details.)
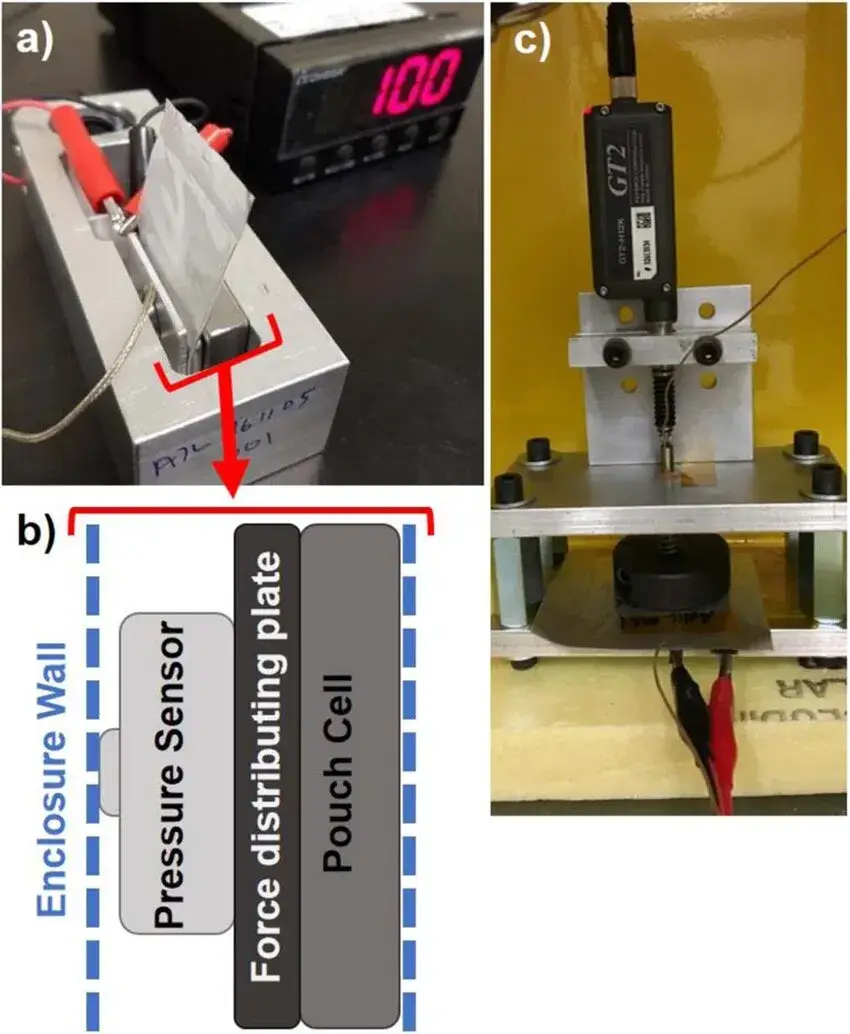
Figure 1. Stress and thickness expansion testing apparatus.
3. Results and Analysis
3.1 Net Cell Expansion, Stress, and Thickness Trends
Net cell expansion, stress, and thickness profiles differ substantially across the three silicon anode chemistries, and these differences persist throughout charge/discharge cycles. Figure 2 summarizes the measured volume, stress, and thickness profiles for Cells A–C:
-
Cells A and B: similar magnitudes of net volume increase and stress; both are significantly larger than Cell C.
-
Cell C (nano Si-C): consistently lower expansion and stress, suggesting improved mechanical buffering by the carbon matrix surrounding the nano-silicon particles.
-
Voltage-range behavior: Cells A and C show plateau regions in expansion at high voltages, whereas Cell B exhibits sharper expansion/contraction in the same SOC window.
Because these measurements reflect contributions from both electrodes simultaneously, further decomposition is necessary to isolate the true silicon anode volume expansion percentage.
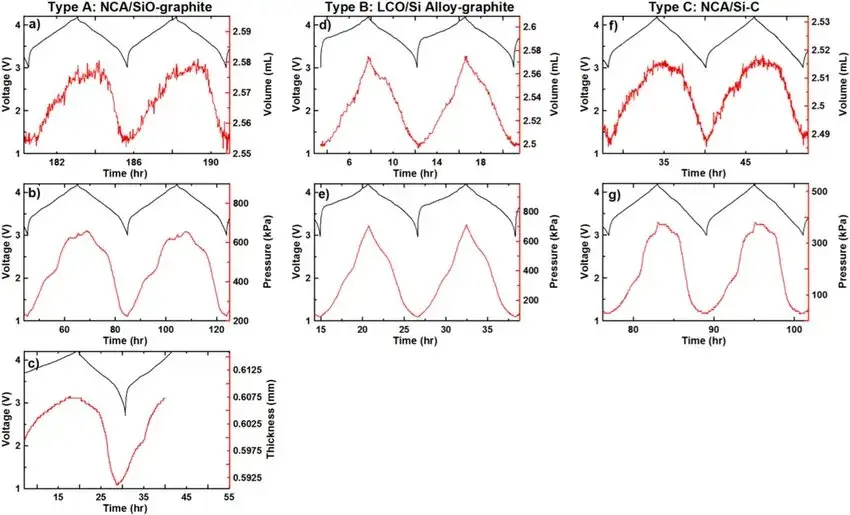
Figure 2. Volume, stress, and thickness expansion curves of the three cell types during charge/discharge.
3.2 Component Decomposition: Pure Silicon vs SiO vs Graphite vs NCA
Component-level decomposition using literature expansion ratios and in-situ XRD data reveals the true silicon anode volume expansion percentage for each electrode material independently. Key reference values from the literature, coupled with in-situ XRD measurements of NCA volume change:
-
Pure Silicon: ~280% volume expansion during full lithiation. This is the widely referenced silicon anode volume expansion percentage for bulk or pure-silicon electrodes; the expansion scales approximately linearly with SOC. (This figure is the basis of “silicon anode volume expansion 300%” queries — the actual measured value from Dahn et al. 2017 is ~280%.)
-
Graphite: ~10% overall expansion; expansion shows step changes associated with the 2L→stage 2 phase transition but limited net volume growth.
- SiO (silicon monoxide): lower net expansion percentage than pure Si, because SiO lithiation partly forms irreversible Li₂O and lithium silicates — these phases buffer expansion at the cost of first-cycle capacity loss. The SiO anode volume expansion percentage is therefore materially lower than the 280% pure-Si reference.
-
NCA: exhibits ~4.5% contraction during charge (most contraction at high SOC), partially offsetting anode swelling in the full-cell volume curve.
Using dV/dQ fitting of the composite electrode response (Figure 4), the relative contributions of Si and graphite in composite electrodes were resolved, and the anode-only expansion curve was reconstructed.
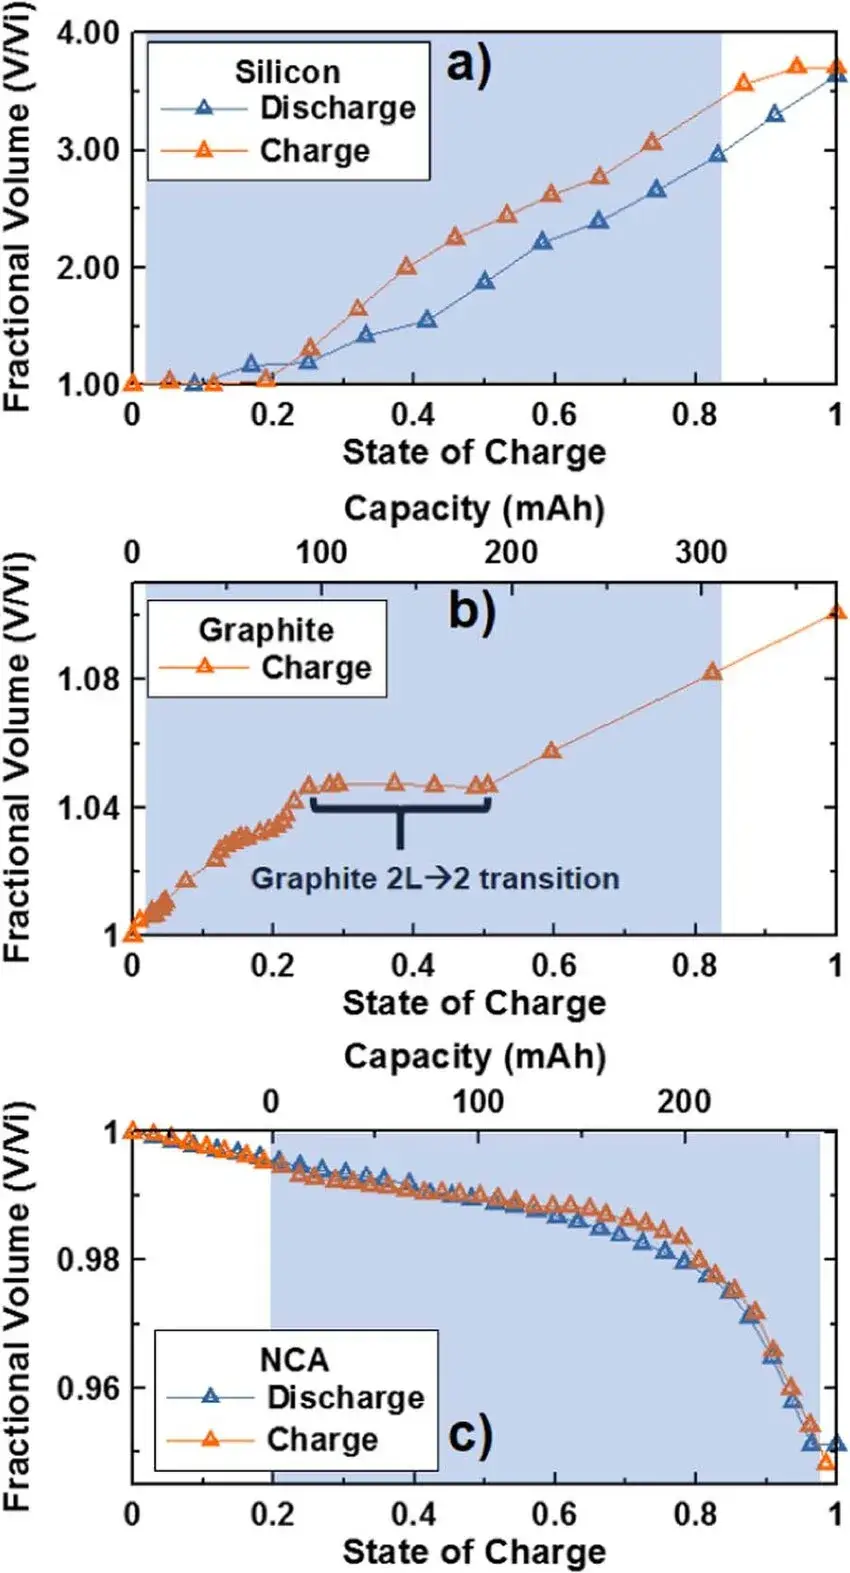
Figure 3. Volume Change Ratio Curves of Three Pure Electrode Materials during Charge/Discharge
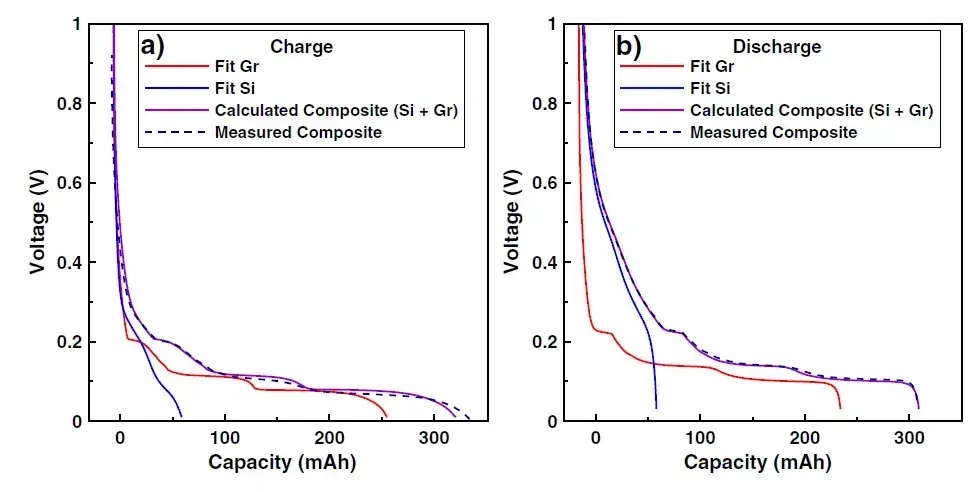
Figure 4. Voltage-capacity curve fitting for Si and graphite composites — dV/dQ analysis resolves individual component contributions to anode volume expansion.
| Electrode Material | Volume Expansion % | Mechanism | Net Effect in Full Cell |
|---|---|---|---|
| Pure Silicon (Si) | ~280% | Li-Si alloying (amorphous → Li15Si4) | Dominant swelling driver |
| SiO (silicon monoxide) | Lower than pure Si | Partial Li2O + silicate formation buffers expansion | Reduced but still significant |
| Graphite | ~10% | Li intercalation between layers | Minor contributor |
| NCA (cathode) | ~-4.5% (contraction) |
Lattice contraction at high SOC | Partially masks anode swelling |
| Nano Si-C composite | Reduced vs bulk Si | Carbon matrix buffers Si expansion mechanically | Best cycle stability |
3.3 How Cathode Contraction Masks Silicon Anode Swelling
Cathode volume changes systematically distort full-cell expansion measurements, causing the true silicon anode volume expansion percentage to be underestimated if only total cell volume is monitored. Decomposition of the full-cell expansion (Figure 5) shows that in Cell A (NCA / SiO-graphite), the NCA cathode contraction (~4.5%) at high SOC creates a net plateau in the overall volume curve — NCA contraction partially cancels SiO expansion, making the anode’s true swelling appear smaller than it is. In contrast, Cell B (LCO / Si-alloy-graphite) — which does not exhibit the same cathode contraction profile — shows steeper net expansion, higher mechanical stress, and greater irreversible deformation over cycles.
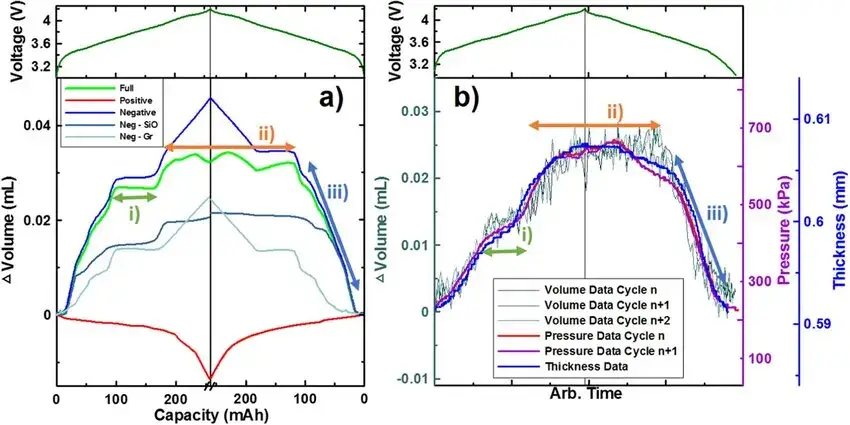
Figure 5. Decomposed Component Volume Expansion Curves for the Full Cell of the SiO/Graphite Composite Electrode and NCA Electrode
3.4 Long-Term Cycling: Expansion Force and Capacity Decay
Irreversible expansion force accumulation over long-term cycling directly predicts capacity fade in silicon-composite cells, and nano-Si-C architecture significantly outperforms bulk Si-alloy designs. Figure 6 reports long cycle tests comparing Cells B and C:
-
LCO / Si-alloy-carbon (Cell B): higher irreversible expansion forces and accelerated capacity fade — indicating that bulk Si-alloy particles generate larger, non-recoverable mechanical stress on the electrode structure.
-
NCA / nano Si-C (Cell C): lower irreversible forces and slower capacity decay, demonstrating the benefit of carbon-buffered nano-silicon architecture and optimized electrode design.
These findings reinforce that controlling silicon anode volume expansion — both through material architecture selection and through accurate anode thickness measurement during development — correlates strongly with improved cycle life and reduced capacity fade.
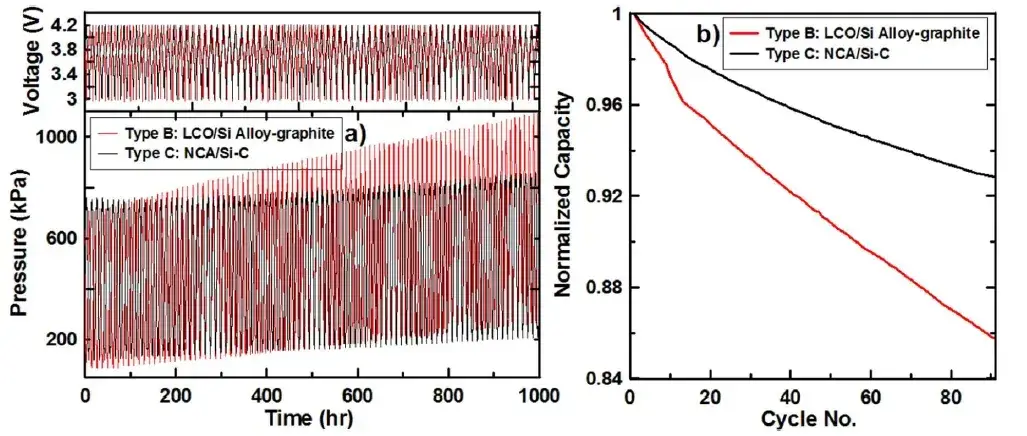
Figure 6. Long Cycle-Life Expansion Force and Capacity Change Curves for Pouch Cells B and C
4. Discussion — Practical Implications for Silicon Anode Design
-
Material selection and composite design matter. Nano-Si embedded in carbon matrices reduces net silicon anode volume expansion percentage and mechanical stress compared with bulk SiO or Si-alloy particles, because the carbon matrix accommodates volume change locally before it propagates to the electrode level.
-
Cathode behavior must be accounted for. NCA cathode contraction (~4.5% at high SOC) can temporarily mask anode swelling in total cell volume measurements; electrode designs that ignore this masking effect risk underestimating anode mechanical demands and over-estimating cell stability.
- Precision anode thickness measurement is essential. High-resolution in-situ thickness sensors enable identification of small, irreversible per-cycle thickness increments that predict long-term mechanical failure modes including electrode delamination and current-collector buckling. Integrating anode thickness measurement into qualification testing accelerates early detection of problematic formulations before full cycle-life data is available.
-
Testing under realistic constraints. Measuring expansion force and thickness under both constant-gap and constant-pressure conditions yields complementary insights: force data characterize mechanical loading on pack components, while thickness data report dimensional changes relevant to cell stacking and tab integrity.
5. Conclusion and Practical Takeaways
This combined in-situ experimental and quantitative analysis demonstrates that:
-
The silicon anode volume expansion percentage for pure Si is ~280% at full lithiation, roughly 28× graphite’s ~10% — confirming silicon as the dominant mechanical driver in composite anodes.
-
SiO anodes exhibit a lower net expansion percentage than pure Si due to irreversible lithium consumption forming Li₂O and lithium silicate phases.
-
Cathode volume changes (e.g., NCA ~4.5% contraction) can offset apparent anode expansion at specific SOC windows, producing misleading plateau behavior in total cell volume curves.
-
Accurate anode thickness measurement and expansion force monitoring are critical diagnostic tools for assessing mechanical reliability and forecasting capacity fade in silicon-composite cells.
- Nano-Si architectures in carbon matrices achieve lower irreversible forces and better cycle stability than bulk SiO or Si-alloy designs.
Practical next steps for developers and QC teams: incorporate synchronized in-situ volume, force, and thickness measurement during formulation screening; prioritize composite designs that minimize incremental thickness change per unit capacity; and validate that cathode selection and operating voltage windows do not inadvertently amplify mechanical stress on the silicon anode.
6. Original Article
A. J. Louli, Jing Li, S. Trussler, Christopher R. Fell, and J. R. Dahn. Volume, Pressure and Thickness Evolution of Li-Ion Pouch Cells with Silicon-Composite Negative Electrodes. Journal of The Electrochemical Society, 164 (12) A2689-A2696 (2017).
7. IEST Recommended Testing Equipment
7.1 IEST GVM2200 In-Situ Battery Gassing Volume Analyzer
The GVM2200 captures net cell volume change in real time throughout charge, discharge, and rest — at 1 µL resolution — enabling quantification of total silicon anode volume expansion percentage at the full-cell level without disassembly.
- Volume resolution: 1 µL — sufficient to detect early-stage gassing and swelling in silicon-composite cells
- Temperature range: 20–85°C controlled oil-bath environment
- Synchronized acquisition: Real-time volume curves plotted alongside voltage, current, and capacity data
7.2 IEST SWE Series In-Situ Cell Swelling Testing System
The SWE Series integrates a high-precision thickness sensor with automated pressure-displacement control, enabling accurate anode thickness measurement and expansion force monitoring under realistic pack-loading conditions throughout the full charge/discharge cycle.
-
Expansion thickness curve under constant pressure (simulates pack preload)
-
Expansion force curve under constant gap (simulates rigid module clamping)
-
Compression testing: stress–strain curves and compression modulus
-
Stepwise expansion force testing at defined SOC intervals
- Temperature range: −20 to 80°C
8. FAQs
8.1 What is the silicon anode volume expansion percentage during lithiation, and why does it matter?
Pure silicon undergoes approximately 280% volumetric expansion during full lithiation — a silicon anode volume expansion percentage roughly 28 times greater than graphite’s ~10%. This expansion occurs because lithium alloying transforms crystalline silicon into an amorphous Li-Si phase and ultimately into crystalline Li₁₅Si₄ near full charge, each transformation adding substantial atomic volume. This extreme expansion generates large mechanical stresses within the electrode, causing SEI fracture, particle cracking, and capacity fade — making silicon anode volume expansion management the central engineering challenge for high-capacity silicon-composite battery design.
8.2 What is the SiO anode volume expansion percentage, and how does it differ from pure silicon?
SiO (silicon monoxide) anodes exhibit a lower net volume expansion percentage than pure silicon because part of the lithiation reaction forms electrochemically inactive Li₂O and lithium silicate phases, which consume lithium irreversibly but buffer volumetric change. The SiO anode volume expansion percentage is therefore materially lower than the ~280% reference for pure Si, though still significantly higher than graphite’s ~10%. The trade-off is a larger first-cycle irreversible capacity loss compared to pure silicon. This study uses in-situ XRD and dV/dQ fitting to separately quantify SiO and graphite contributions to total anode expansion in NCA/SiO-graphite composite cells.
8.3 How is anode thickness measurement performed in-situ during cycling?
In-situ anode thickness measurement uses high-resolution displacement sensors integrated into a controlled-pressure or controlled-gap fixture that holds the pouch cell throughout the charge/discharge cycle, recording anode surface displacement continuously without disassembly. The IEST SWE Series cell swelling testing system performs anode thickness measurement at sub-micron resolution under either constant pressure (simulating pack preload) or constant gap (simulating rigid module clamping), operating across −20 to 80°C. Continuous anode thickness measurement detects small irreversible per-cycle thickness increments — early predictors of delamination, current-collector buckling, and capacity fade — that a single teardown measurement would miss entirely.
8.4 Why does NCA cathode contraction mask the true silicon anode volume expansion in full-cell measurements?
During charging, NCA cathodes contract by approximately 4.5% at high SOC as lithium is extracted from the layered oxide structure. Because the cathode is contracting while the silicon anode is expanding, their volume changes partially cancel in total cell volume measurements — creating a plateau in the net expansion curve that makes the anode’s true silicon anode volume expansion percentage appear smaller than it actually is. This masking effect is particularly pronounced in NCA/SiO-graphite cells (Cell A in this study) and can lead designers to underestimate anode mechanical demands. Component-level decomposition using in-situ XRD and dV/dQ fitting is required to separate cathode and anode contributions and recover the true anode expansion curve.
8.5 What is the original source for the “silicon anode volume expansion ~280–300%” figure?
The widely cited silicon anode volume expansion percentage of approximately 280% for pure silicon at full lithiation derives from crystallographic measurements of the Li₁₅Si₄ phase volume relative to crystalline Si. The specific in-situ measurement and pouch-cell quantification methodology referenced in this article is from: A. J. Louli, Jing Li, S. Trussler, Christopher R. Fell, and J. R. Dahn, “Volume, Pressure and Thickness Evolution of Li-Ion Pouch Cells with Silicon-Composite Negative Electrodes,” Journal of The Electrochemical Society, 164(12) A2689-A2696 (2017). The “300%” figure sometimes cited in other sources reflects rounding or different lithiation state assumptions; the Dahn group’s carefully measured value is ~280%.
