

The rapid advancement of the lithium-ion battery industry has heightened focus on safety, performance consistency, and manufacturing efficiency. Performance degradation in batteries often stems from loss of active lithium, active material degradation, and polarization effects. Understanding and correlating properties across different production stages — from raw powder and slurry to finished electrode and cell — is essential for improving battery quality and accelerating R&D cycles.
As electrode resistivity tests manufacturers, IEST Instruments presents a validated methodology to correlate powder resistivity with electrode resistivity, enabling early root-cause identification, reduced material waste, and improved final cell performance.
Battery performance is influenced by properties at each manufacturing stage. As illustrated in Figure 1, IEST designed an experiment using five powders with varying resistivities, fixed solid content, and consistent slurry formulation (96.5% active material, 1.5% conductive carbon, 2% PVDF). After coating, calendering, and cell assembly, conductivity was evaluated at four levels: powder, slurry, electrode, and full cell.
Although the conductivity trend was not perfectly linear across stages—due to additives, solvents, and process variations—samples with significantly different powder resistivity (e.g., samples 1 and 5) still exhibited consistent performance trends at higher levels.
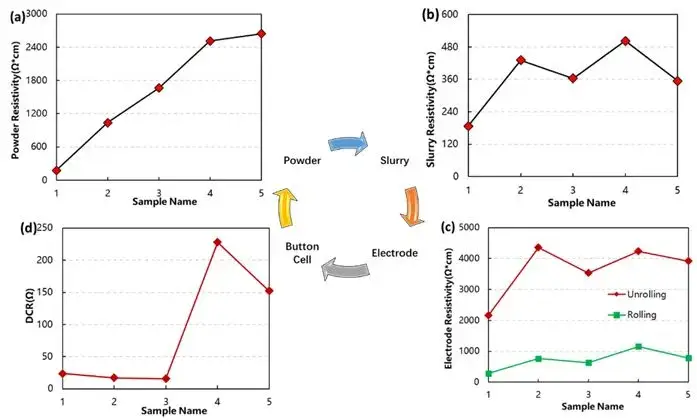
Figure 1. Multi-level correlation analysis of lithium battery conductivity across powder, slurry, electrode, and cell stages.
The microstructure and morphology at each stage — from raw powder, through premixed powder and slurry, to coated electrode — differ significantly, as shown in Figure 2. For powder-level conductivity, which includes only active particles, the conductivity under a given compaction can be expressed as:
$\sigma_{AM} = \sigma_0^* \phi / \tau$
where $\sigma_0^*$ is the intrinsic conductivity of the powder, $\phi$ is the particle volume fraction under compaction, and $\tau$ is the tortuosity of particle connectivity, related to contact conditions between particles. Better connectivity and larger contact areas yield smaller $\tau$. During powder resistivity tests, increasing pressure raises compaction density, increases $\phi$, improves connectivity, reduces $\tau$, and thus increases conductivity.
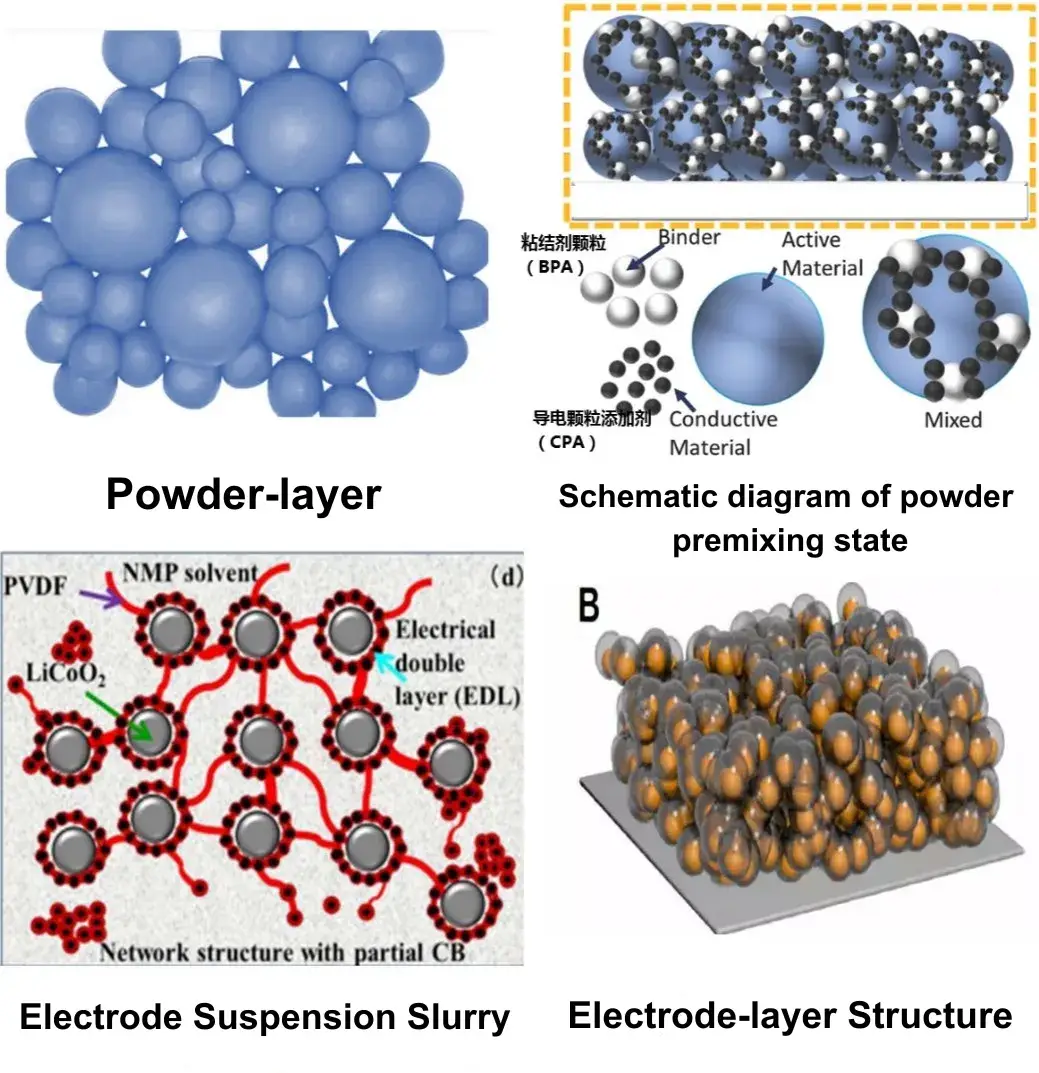
Figure 2. Microscopic morphology of particles at each processing level, from raw powder to coated electrode.
From the pre-mixed powder state to the slurry and then to the electrode, conductive agents and binders are introduced into the active particle powder. Conductive agents facilitate the construction of electron transport networks, while binders increase electron transport impedance. The conductivity of mixed powders, slurries, or electrode coatings can be divided into two components:
Additionally, interfacial contacts between these two networks also contribute to electron transport.
The effective conductivity can thus be expressed as:
$\sigma_{\mathrm{e}}^{\mathrm{eff}} = \frac{\varphi_{\mathrm{e}}^{\mathrm{act}}}{\tau_{\mathrm{e}}^{\mathrm{act}}} \sigma_{\mathrm{e}}^{\mathrm{act}} + \frac{\varphi_{\mathrm{e}}^{\mathrm{sub}}}{\tau_{\mathrm{e}}^{\mathrm{sub}}} \sigma_{\mathrm{e}}^{\mathrm{sub}}$
Among them, \(\sigma^{eff}\) is the effective conductivity; \(\phi^{act}\) is the volume fraction of active particle powder; \(\tau^{act}\) is the connectivity tortuosity of active particle powder. The better the connectivity and the larger the contact area, the smaller the tortuosity \(\tau\) of the electron conduction path; \(\sigma^{act}\) is the electronic conductivity of the active particle itself. \(\phi^{sub}\) is the volume fraction of conductive agent powder, \(\tau^{sub}\) is the connectivity tortuosity of conductive agent powder, and \(\sigma^{sub}\) is the electronic conductivity of the conductive agent particle itself. Generally, the conductivity of active particles itself is much lower than that of conductive agents, especially positive electrodes. Therefore, the electronic conductivity contributed by active particles is very small, and conductive agents are the main path for electron conduction. Therefore, the distribution state and connectivity of conductive agents are the main factors affecting electronic conductivity. Compared with pure powder, the introduction of conductive agents and binders into the slurry directly affects the evaluation results of electronic conductivity. From the mixed powder premix to the slurry and then to the electrode, the correlation of electronic conductivity is mainly related to the distribution state and connectivity of the components, especially the connected network of the conductive agent. If this conductive network can be preserved during the process, the conductivity of each level will be completely correlated.
| Test Level | Instrument | Pressure Range | Key Output |
|---|---|---|---|
| Powder resistivity | PRCD3100 | 10–350 MPa | Resistivity vs. pressure, compaction density, stress-strain behavior |
| Electrode resistivity | BER2500 | 5–60 MPa | Six-point resistivity, coefficient of variation (COV) |
| Coating-layer powder resistivity | PRCD3100 (on milled, scraped coating) | Same compaction conditions as powder test | Resistivity for direct comparison with electrode resistivity |
Exploring correlations across hierarchical levels (Figure 1), the relationship between powder-level and electrode sheet-level resistivity showed inconsistencies, significantly influenced by conductive agents, whereas the correlation from slurry to electrode sheet remained fully consistent. This discrepancy primarily arises from the conductive agents and binders introduced during the transition from powder to slurry to electrode sheet, which directly impacts the evaluation of electronic conductivity.
To clarify these effects, laboratory experiments were designed using NCM materials as the primary component, referencing the pre-mixing stage of dry mixing processes. Two formulations were prepared:
These mixed powders were thoroughly homogenized, and resistivity assessments were conducted using IEST PRCD Series to quantify conductivity differences before and after mixing. As shown in Table 2:
| Resistivity (Ω·cm) | ||||
|---|---|---|---|---|
| Pressure (MPa) | NCM | SP | NCM+PVDF | NCM+SP+PVDF |
| 10 | 1864604.0000 | 0.0574 | 2892104.2500 | 5.9698 |
| 30 | 153219.0000 | 0.0307 | 223143.8281 | 3.9139 |
| 50 | 52690.2734 | 0.0232 | 70278.5156 | 3.2112 |
| 70 | 27160.2656 | 0.0194 | 34244.9141 | 2.8040 |
| 90 | 16821.8223 | 0.0170 | 20605.5117 | 2.5362 |
| 110 | 11662.9414 | 0.0153 | 13999.3125 | 2.3266 |
| 130 | 8554.2334 | 0.0140 | 10289.8516 | 2.1616 |
| 150 | 6658.6509 | 0.0131 | 7944.6602 | 2.0301 |
| 170 | 5345.5381 | 0.0122 | 6371.4395 | 1.9130 |
| 190 | 4411.6670 | 0.0116 | 5302.3481 | 1.8185 |
| 210 | 3720.8372 | 0.0110 | 4492.1099 | 1.7319 |
| 230 | 3216.3525 | 0.0105 | 3883.0796 | 1.6545 |
| 250 | 2794.4104 | 0.0101 | 3401.9226 | 1.5854 |
| 270 | 2451.8865 | 0.0097 | 3010.8435 | 1.4920 |
| 290 | 2170.9941 | 0.0094 | 2696.9341 | 1.4293 |
| 310 | 1943.4226 | 0.0091 | 2434.1519 | 1.3708 |
| 330 | 1753.1791 | 0.0088 | 2209.9841 | 1.3268 |
| 350 | 1590.3523 | 0.0086 | 2024.6746 | 1.2766 |
To probe the correlation between powder resistivity and electrode resistivity, a promising approach involves analyzing the resistivity of pre-mixed powders. IEST Instrument is currently refining its proprietary coin cell assembly machine and plans to integrate in-house mixing, coating, and calendering processes to validate the feasibility of this methodology.
In premixed-powder experiments, the way conductive additive and binder are introduced at the electrode level differs markedly from the pure-powder premix. After slurry-level mixing, PVDF exists in a sol state and a solvent is introduced; once the electrode sheet is dried, its state differs clearly from that of the premixed powder. To examine this discrepancy, an electrode sheet-level scrape test was designed: the coating was scraped off the electrode sheet, the scraped powder was crushed, and its resistivity was measured, then compared with the electrode resistivity using the BER and PRCD series instruments.
Two uncalendered electrode sheets, NCM and LCO, were selected as samples, and resistivity at different sites was tested under 25 MPa pressure to confirm coating uniformity before further testing. Figure 3 shows the BER series instrument schematic alongside single-point test results. Six points at distinct positions on each film were tested, and the coefficient of variation (COV) of their resistivities was calculated. All electrode sheets exhibited a COV below 5%, confirming good uniformity and suitability as sample films for this experiment.
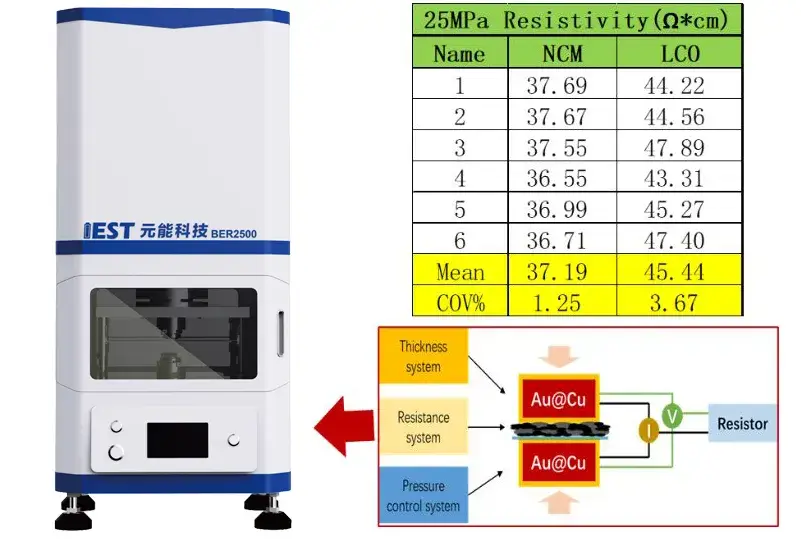
Figure 3. BER series equipment schematic and electrode sheet single point measurement results
According to the experimental design concept, both types of electrode sheets were subjected to a powder scraping procedure: the coating layer was scraped from the surface of the current collector, then the collected powder was milled to ensure sampling consistency during resistivity measurement. Figure 4 shows the schematic of the PRCD series instrument and the measured powder resistivity of the coating‐layer. From the curves, the coating‐layer powder displays the same trend as the pure powder: resistivity decreases progressively as applied pressure increases.
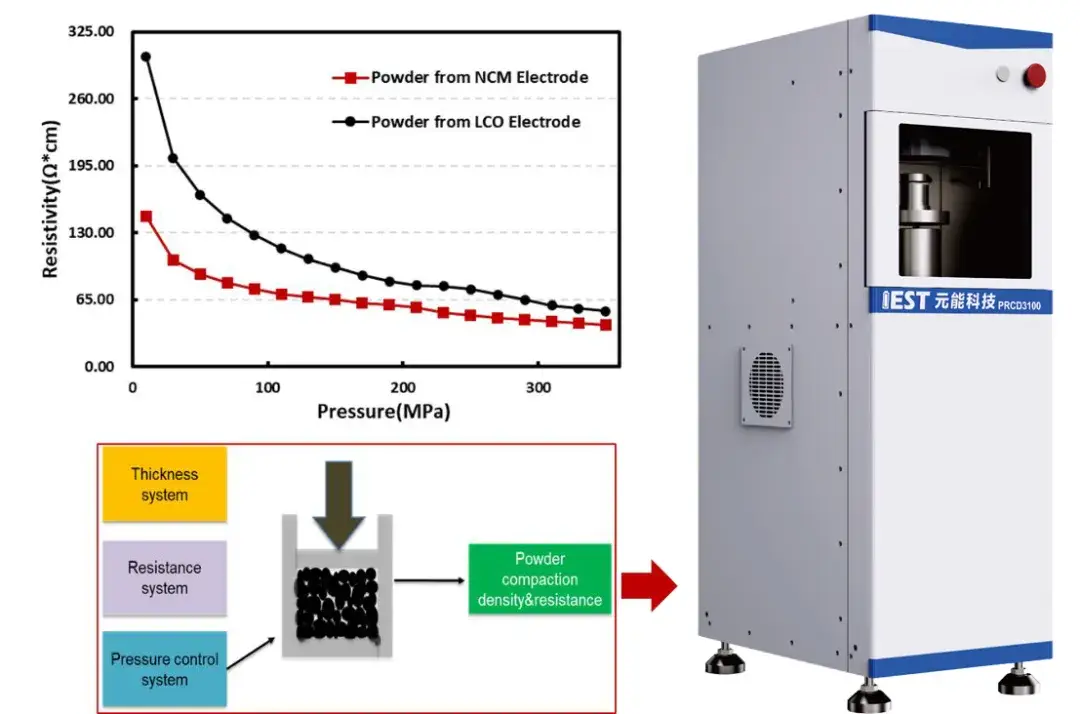
Figure 4. Schematic diagram of the PRCD series instrument and the results of the powder resistivity of the electrode coating layer
To further clarify any differences, we compared the electrode resistivity with the coating‐layer powder resistivity; Table 3 confirms that electrode resistivity and coating-powder resistivity values were within the same order of magnitude, with LCO consistently showing higher resistivity than NCM—supporting the validity of this approach.
| Electrode Resistivity (Ω·cm) | Powder Resistivity (Ω·cm) | ||||
|---|---|---|---|---|---|
| Pressure (MPa) | NCM | LCO | Pressure (MPa) | From NCM Electrode | From LCO Electrode |
| 5 | 663.53 | 113.70 | 10 | 145.43 | 300.91 |
| 10 | 98.77 | 62.93 | 30 | 103.30 | 202.35 |
| 15 | 50.82 | 49.95 | 50 | 89.48 | 166.58 |
| 20 | 41.01 | 45.19 | 70 | 81.14 | 143.94 |
| 25 | 37.56 | 43.01 | 90 | 75.05 | 127.58 |
| 30 | 35.83 | 41.74 | 110 | 69.98 | 114.61 |
| 35 | 34.95 | 41.17 | 130 | 67.35 | 104.44 |
| 40 | 34.30 | 40.78 | 150 | 65.28 | 96.14 |
| 45 | 33.86 | 40.61 | 170 | 61.33 | 88.56 |
| 50 | 33.49 | 40.44 | 190 | 59.64 | 82.47 |
| 55 | 33.25 | 40.46 | 210 | 57.33 | 79.00 |
| 60 | 33.01 | 40.35 | 230 | 52.35 | 78.00 |
Given the limited sample selection, this validation is not yet comprehensive. Additional experiments are planned using the same active material under different process conditions to verify these findings. Beyond scraping the coating layer, directly simulating the coated slurry (dried or oven-dried) and then milling it, to correlate with electrode sheet performance, is also under consideration — if feasible, this may allow prediction of electrode-level performance without actually coating the foil.
| Testing Matrix | Traditional Method | IEST Multi-Level Method | Scientific Value / Improvement |
|---|---|---|---|
| Testing scope | Electrode or cell-level resistance measured after full electrode fabrication | Powder resistivity (PRCD3100), electrode resistivity (BER2500), and coating-layer powder resistivity, all cross-compared | Identifies whether a resistivity issue originates upstream (powder/slurry) or downstream (coating/calendering) |
| Uniformity assessment | Single-point or unspecified sampling | Six-point electrode measurement with coefficient of variation (COV) | Confirms coating uniformity (COV < 5%) before attributing resistivity differences to formulation |
| Root-cause screening | Requires full coating and cell assembly before an issue is detected | Scraped-coating powder resistivity offers a potential proxy for electrode resistivity | Points toward predicting electrode-level performance earlier in the process, reducing material waste |
This study shows that powder resistivity — measured under controlled compaction — and coating-layer powder resistivity can provide useful predictions of electrode resistivity, provided conductive networks survive the slurry and drying steps. Implementing premix-level screening and scraped-coating resistivity tests can accelerate R&D, reduce material waste, and strengthen upstream quality control. For robust adoption, teams should standardize compaction conditions and expand validation across material systems.
IEST’s PRCD3100 powder resistivity tester and BER2500 electrode resistance tester let you screen conductive-network quality from premixed powder through to the finished electrode sheet — flagging resistivity issues before you commit to full cell assembly.
[1] Yang Shaobin, Liang Zheng. Principles and Applications of Lithium-Ion Battery Manufacturing Processes.
[2] MikoWoo@Ideallife. Fundamentals of Lithium-Ion Battery Electrode Theory and Processing.
Powder resistivity is the electrical resistivity of a powder sample measured under a given compaction pressure, reflecting its intrinsic conductivity and particle-to-particle connectivity. It matters because it can flag conductive-network issues before a material is made into slurry or coated into an electrode, reducing downstream material waste.
An electrode resistivity test measures the electrical resistivity of a coated, dried electrode sheet, typically at multiple positions to check uniformity. Using an instrument such as the IEST BER2500, resistivity is measured at six points per film under defined pressure (5–60 MPa), and the coefficient of variation (COV) across those points is calculated.
Not directly in every case: the correlation from powder to electrode resistivity showed inconsistencies caused mainly by the conductive agent and binder introduced during slurry mixing, while the correlation from slurry to electrode remained fully consistent. A coating-layer powder resistivity test, which measures resistivity on powder scraped from the finished electrode, showed better agreement — within the same order of magnitude as directly measured electrode resistivity.
Powder resistivity testing measures a raw or premixed powder before it is made into a slurry. Coating-layer powder resistivity testing measures powder that has been scraped off an already-coated electrode sheet and re-milled, so it captures the actual conductive-agent and binder state after slurry mixing and drying, making it more directly comparable to electrode resistivity.
Coefficient of variation is calculated from resistivity measurements taken at multiple positions — typically six points — on the same electrode sheet. A COV below 5% indicates the conductive network is uniformly distributed across the sheet, which is used to confirm that a sample is suitable for further correlation testing before drawing conclusions from its resistivity data.
Powder resistivity testing, such as with the IEST PRCD3100, is useful for early-stage formulation screening before committing to slurry and coating. Electrode resistivity testing, such as with the IEST BER2500, is needed to confirm actual coated-sheet performance and uniformity. Using both, along with a coating-layer powder resistivity check, gives the clearest picture of where a resistivity issue originates in the process.
