-
iestinstrument
How Electrolyte Solvent and Lithium Salts Affect Battery Electrolyte Viscosity and Wettability
1. Preface
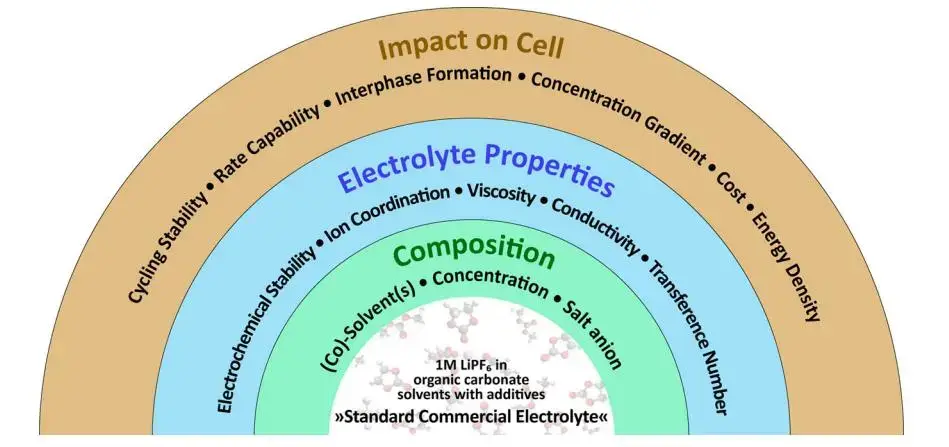
Electrolytes for lithium-ion batteries are usually organic electrolyte solvent mixtures that dissolve lithium salts and form conductive ions. Solvent selection and salt concentration directly determine ionic conductivity, battery electrolyte viscosity, wettability, and ultimately cell performance. Figure 1 is an overview of electrolyte-related research. According to statistics, solvents account for 85% of the mass and 30% of the cost in the electrolyte; solvents account for about 85% of the electrolyte and ~30% of its cost; the electrolyte itself represents roughly 6–8% of a power battery’s cost. Since power batteries make up ~40% of a new energy vehicle’s cost, solvent choices have measurable impacts on vehicle economics.
The electrolyte uses a “mixed solvent system”, 95% of which is “carbonate solvents”, which are divided into cyclic carbonates and chain carbonates according to their structures,including dimethyl carbonate (DMC), diethyl carbonate (DEC), ethyl methyl carbonate (EMC), ethylene carbonate (EC), propylene carbonate (PC). The main function of the solvent is to dissolve lithium salts and form conductive ions; the lithium salts mainly play the role of providing conductive ions. Lithium hexafluorophosphate (LiPF6) is the most commonly used lithium salt at present. The viscosity of the electrolyte is jointly determined by the lithium salt and the solvent, and the viscosity is directly related to the wettability of the electrolyte.

Figure 1. Overview of electrolyte research and cost breakdown.
This study uses the IEST Electrolyte Wetting System (EWS1100) to quantify how different battery solvents and lithium salts affect capillary wettability at the electrode level.
2. Objective and Test Overview
This work evaluates the salt battery viscosity and battery electrolyte viscosity effects on electrode wetting using a capillary infiltration method. We compare four pure solvents (PC, DEC, DMC, EMC) and four electrolyte formulas (L01–L04, each with 1 M LiPF₆ base) on identical negative electrode sheets at controlled compaction densities. The goal is to provide a reproducible test solution for screening solvent/salt systems and to guide electrolyte formulation and cell filling processes.
3. Experimental Equipment and Testing Methods
3.1 Instrument
IEST Electrolyte Wetting Testing System (EWS1100). The EWS1100 automates capillary suction, monitors capillary liquid level via machine vision, and records dynamic infiltration in real time.
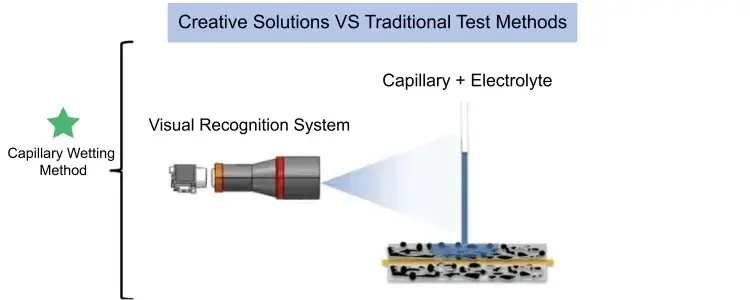
Figure 2. Schematic diagram of EWS1000 equipment
3.2 Sample Preparation
-
Solvents tested: PC, DEC, DMC, EMC (physical properties summarized in Table 1).
-
Electrolytes: four solvent blends (L01–L04) each containing 1 M LiPF₆ (formulations in Table 3).
-
Electrode: same negative electrode sheet, with controlled compaction density.
3.3 Test Procedure (Automated)
-
Sample pretreatment and standardized fixation.
-
Software parameter setup.
-
Automatic capillary suction and capillary pressure test.
-
Real-time visual monitoring of capillary liquid level.
-
Data collection and normalization.
3.4 Test Principle
Electrolyte Wetting System (EWS1100), it can quantitatively evaluate the difference in infiltration of electrolyte between different positive and negative electrode plates and separators, providing an effective method for electrolyte infiltration evaluation. Figure 3 is a schematic diagram of the test principle of the capillary infiltration method. The capillary glass tube is in contact with the surface of the pole piece, and electrolyte is injected into the capillary. As the electrolyte continues to infiltrate the coating, the capillary liquid level continues to decrease. The visual recognition system records the liquid level height of the capillary in real time. The dynamic evolution process of the liquid level is the real-time process of electrolyte infiltration. The height change is the amount of electrolyte infiltration.

Figure 3. Schematic diagram of the capillary infiltration test principle
3. Results — Solvent Wettability and the Role of Viscosity
Lithium-ion battery solvents generally use organic solvents with high dielectric constant and small viscosity. The higher the dielectric constant, the easier it is for lithium salts to dissolve and dissociate; the lower the viscosity, the faster the ions move. However, solvents with high dielectric constants usually have high viscosity, and solvents with low viscosity have low dielectric constants. Therefore, in practical applications, multiple solvents are usually mixed to obtain the optimal electrolyte system. Compared with the study of mixed systems, the performance evaluation of a single system is the basis for systematic research and development of electrolytes. In this experiment, four solvents with different properties (for example, Table 1 shows the physical property indicators of the four solvents) were first selected to conduct capillary infiltration characterization at the pole piece level to evaluate the infiltration differences of different solvents under this method.
Table 1. Physical properties (dielectric constant, viscosity) of solvents.

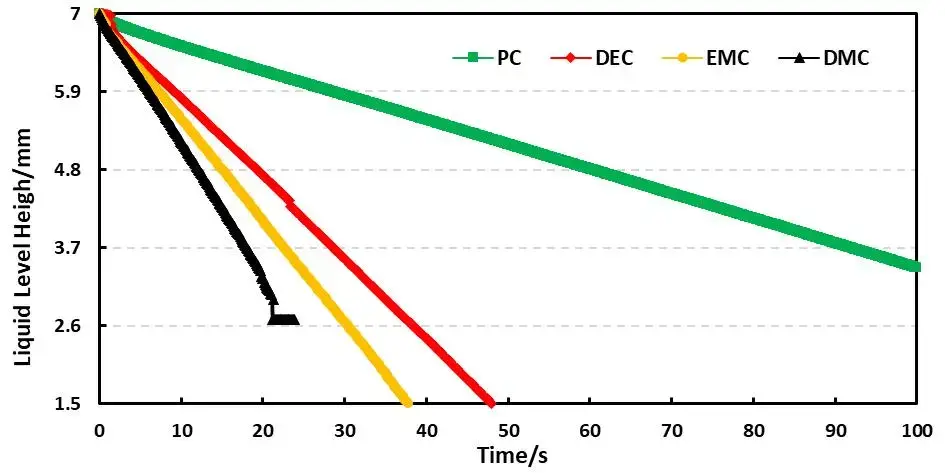
Combined with the EWS1100 series electrolyte infiltration equipment, a 10μl capillary tube was used to evaluate the differences between different solvents on the same pole piece, and the data were normalized. For example, Table 2 shows the comparison results of the infiltration amount data of different solvents, and Figure 4 shows the infiltration comparison curves of different solvents. From the slope of the curve, it can be clearly seen that there are obvious differences in the infiltration between different solvents. among them, DMC completed all the infiltration of the sampled liquid in about 20 seconds; judging from the results of the infiltration amount in 10 seconds and 20 seconds, both showed the infiltration trend of PC<DEC<EMC<DMC. This inverse relationship confirms battery solvent viscosity is a dominant factor controlling capillary wettability at the electrode level. Note: although dielectric constant affects salt dissociation, for pure-solvent infiltration the viscosity effect on wetting is dominant.
Practical implication: Lowering battery electrolyte viscosity (for example by choosing lower-viscosity battery solvents or increasing temperature during cell filling) improves infiltration speed and uniformity during cell manufacturing.
Table 2. Normalized infiltration data for pure solvents.


Figure 4. Capillary wetting curves for PC, DEC, EMC, DMC.
4. Results — Effect of Lithium Salts on Wettability
The electrolyte lithium salt is the basis for the conduction of lithium ions. A suitable lithium salt must have good thermal stability and not easy to decompose, high ion conductivity, good chemical and electrochemical stability, and low cost; Although there are many types of lithium salts, those suitable for lithium-ion batteries are very limited. Currently, lithium salts commonly used in laboratories and industrial production generally choose lithium salts with larger anion radius and stable oxidation and reduction, among them, lithium hexafluorophosphate (LiPF6) is currently the most used lithium salt in lithium-ion batteries. This experiment combines different solvents to carry out electrolyte ratios with a fixed lithium salt concentration, and prepares electrolytes with four ratios as shown in Table 3. The main components are based on PC, EMC, DMC and DEC with the addition of 1M LiPF6 , combined with these four electrolytes, the wettability test under the capillary principle was performed.
Table 3. Electrolyte compositions (L01–L04).

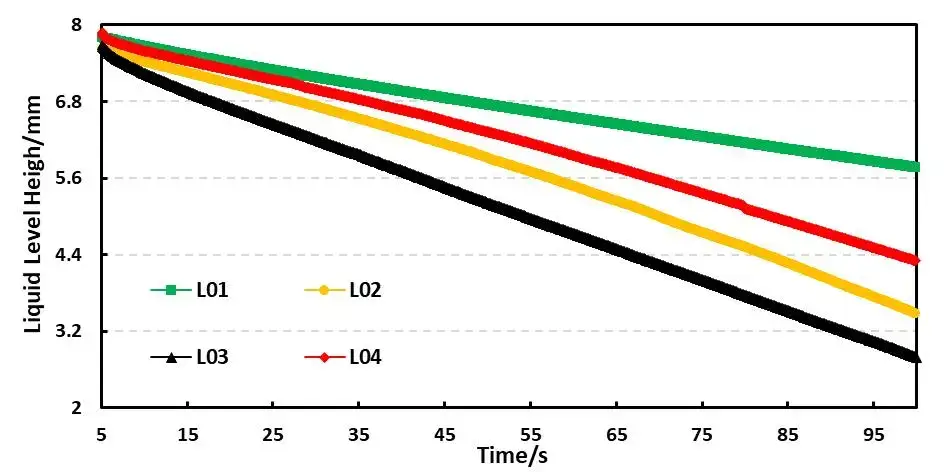
For example, Table 4 shows the comparison results of the infiltration amount data of four electrolyte systems based on different solvent ratios. Figure 5 shows the comparison curves of capillary infiltration of different electrolytes. From the curve slope, there are obvious differences in the infiltration conditions of the four electrolytes; From the infiltration amount table, the infiltration trend L01<L04<L02<L03 can be further clarified. This order mirrors the pure solvent rank but with uniformly slower kinetics after salt addition. Thus, salt battery viscosity (viscosity after lithium salt dissolution) is a key metric when choosing practical electrolyte formulas. Comparing DMC with L03 with 1M lithium salt added to it, DMC completed all the initial liquid infiltration in about 20 seconds, while L03 only completed 34.8% of the initial liquid volume in 50 seconds (infiltration volume in 50 seconds/initial liquid level height) ); this result mainly considers that the addition of lithium salt to the solvent increases the viscosity of the liquid, and the change in viscosity directly leads to the decrease in the wettability of the electrolyte.
Table 4. Normalized infiltration data for electrolytes.


Figure 5. Capillary wetting curves for electrolytes L01–L04.
5. Discussion — Why Viscosity Matters for Electrolyte Performance
-
Filling efficiency and homogeneity: Higher battery electrolyte viscosity slows capillary infiltration during cell filling, increasing the risk of dry spots, gas entrapment, and non-uniform wetting that harm cell performance and cycle life.
-
Ionic transport: While low viscosity promotes faster ion mobility, dielectric properties must still ensure full salt dissociation—hence the compromise of mixed solvents.
-
Temperature dependence: Raising temperature reduces viscosity and accelerates infiltration—common practice during large-scale cell filling—but thermal windows and safety must be considered.
-
Formulation trade-offs: Additives and salt concentration improve electrochemical stability or SEI formation but often increase viscosity; an optimized balance is essential.
6. Practical Recommendations for Electrolyte Development and Cell Filling
- Evaluate salt battery viscosity early — measure viscosity of candidate electrolytes (including additives) and correlate with capillary infiltration.
- Prefer low-viscosity solvents or solvent blends compatible with required dielectric properties to maintain ionic conductivity while ensuring good wettability.
- Control filling temperature within safe limits to reduce viscosity during injection and improve wetting.
- Use capillary infiltration testing (e.g., EWS1100) as a quick screening tool for electrolyte recipes before cell prototyping.
- Balance additives: use minimal necessary additive loading to avoid excessive viscosity increases or compensate via solvent ratio adjustments.
4. Conclusion
Electrolyte formulation: choice of electrolyte solvent and lithium salts directly controls battery electrolyte viscosity, which in turn governs capillary wettability at the electrode level. Our capillary infiltration tests with EWS1100 show that (1) lower-viscosity solvents (e.g., DMC) wet electrodes fastest, and (2) adding lithium salts (e.g., LiPF₆) raises viscosity and reduces wettability. For reliable manufacturing and peak cell performance, electrolyte developers should explicitly measure salt battery viscosity and battery electrolyte viscosity, use capillary wetting tests for screening, and optimize solvent/salt ratios with filling temperature and process in mind.
5. References
[1] Sheng Y. Investigation of electrolyte wetting in lithium-ion batteries: Effects of electrode pore structures and solution[J]. Dissertations & Theses – Gradworks, 2015.
[2] Yao N, Yu L, Fu Z H, et al. Probing the origin of viscosity of liquid electrolytes for lithium batteries[J]. Angewandte Chemie International Edition, 2023: e202305331.
[3] Compiled by Zheng Honghe et al. Lithium-ion battery electrolytes. Beijing: Chemical Industry Press, 2007.01
[4] Weydanz W J , Reisenweber H , Gottschalk A ,et al.Visualization of electrolyte filling process and influence of vacuum during filling for hard case prismatic lithium-ion cells by neutron imaging to optimize the production process[J].Journal of Power Sources, 2018, 380(mar.15):126-134.DOI:10.1016/j.jpowsour.2018.01.081.
[5] Wu M S , Liao T L , Wang Y Y ,et al. Assessment of the Wettability of Porous Electrodes for Lithium-Ion Batteries[J]. Journal of Applied Electrochemistry, 2004, 34(8):797-805. DOI:10. 1023/B:JACH.0000035599.56679.15.
Contact Us
If you are interested in our products and want to know more details, please leave a message here, we will reply you as soon as we can.


