-
iestinstrument
Entering Electrochemistry | Application of Broadband Dynamic EIS Testing in Battery Cell
Within the battery testing field, Electrochemical Impedance Spectroscopy (EIS) is an indispensable analytical technique. Functioning like an “X-ray machine,” it enables non-destructive interrogation of a cell’s internal state, providing insights into battery health, aging mechanisms, and material properties. This raises a critical question: Among the diverse EIS testing equipment available on the market, which offers superior performance? Today, we conduct a direct comparison between our IEST ERT7008 System and a renowned international electrochemical workstation to evaluate which delivers more precise and stable EIS measurements!
1. What is EIS Testing?
EIS, an acronym for Electrochemical Impedance Spectroscopy, fundamentally involves applying a small-amplitude sinusoidal alternating current (AC) signal to a battery and measuring its complex AC impedance as a function of frequency. The data is typically presented as a Nyquist plot (Z’ vs Z”). This technique non-destructively resolves the impedance characteristics of various interfaces and bulk phases within the cell, encompassing electron/ion conduction, interfacial reaction kinetics, and mass transport processes. By analyzing the response features within distinct frequency regions of the EIS spectrum, key parameters such as SEI layer stability, charge transfer efficiency, and lithium-ion diffusion coefficients can be quantitatively assessed. This provides critical insights for optimizing battery material design, diagnosing degradation mechanisms, and enhancing electrochemical performance.
2. Applications of EIS in Lithium-Ion Battery Research
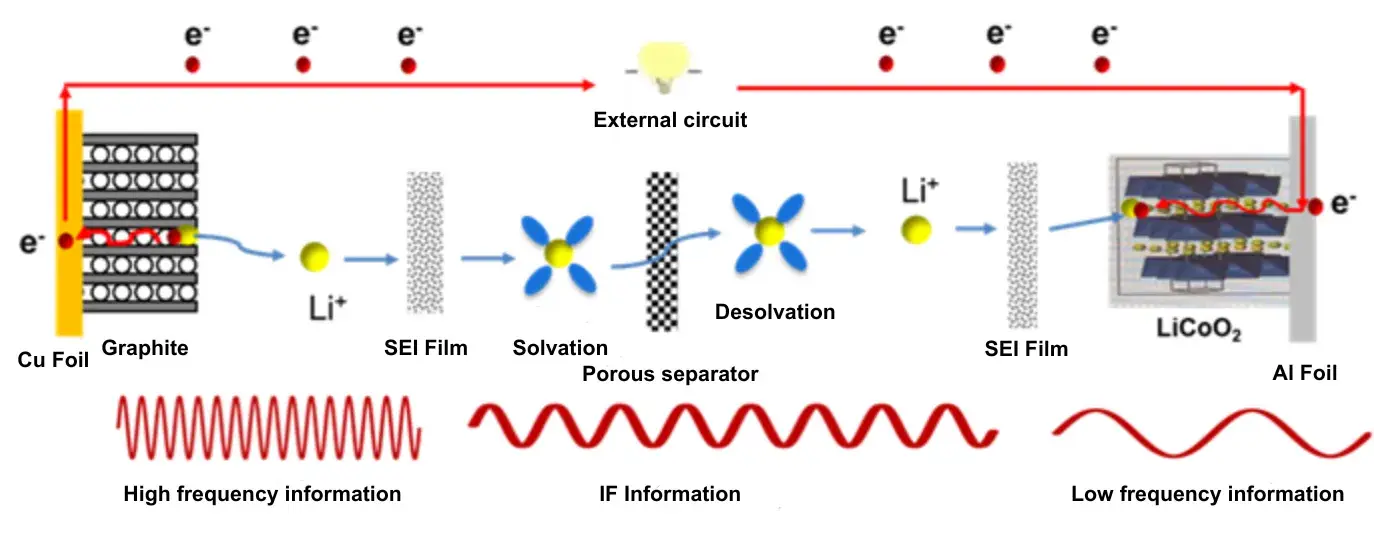
First, trace the lithium-ion transport pathway within the cell to identify the corresponding semicircular features on the Nyquist plot for each process. This facilitates the deduction of the underlying electrochemical mechanisms from the measured impedance curve.

Figure 1. Lithium-Ion Transport Pathway in a Lithium-Ion Battery
2.1 The diagram illustrates the Li⁺ transport sequence:
① External Circuit: Electron conduction (Cu current collector → Graphite anode).
② Graphite Anode: Li⁺ intercalation into graphite, traversing the SEI (Solid Electrolyte Interphase) layer.
③ Electrolyte: Li⁺ solvation (binding with electrolyte solvent), migration through the porous separator.
④ Cathode (LiCoO₂): Li⁺ desolvation, passage through the CEI (Cathode Electrolyte Interphase) layer (if present), intercalation into the cathode active material.
⑤ External Circuit: Electron conduction via the Al current collector.

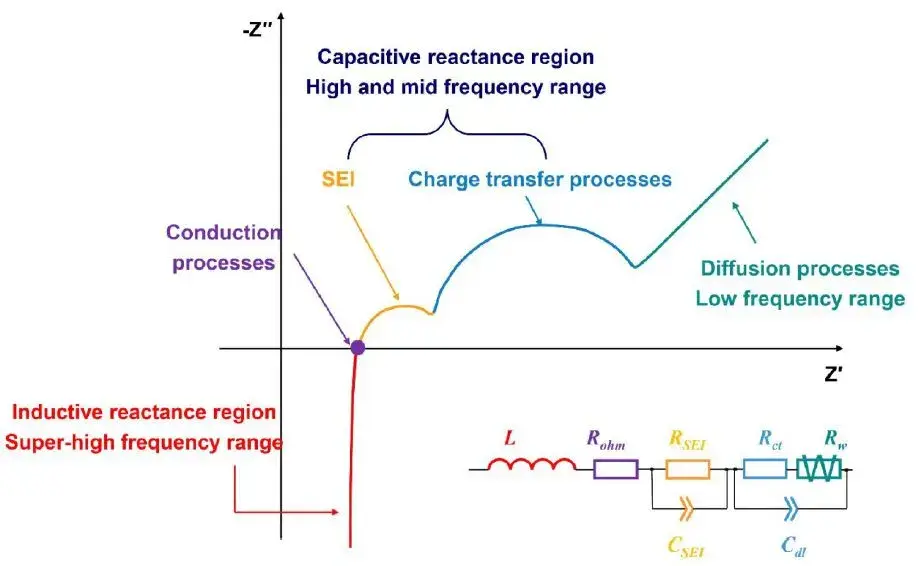
Figure 2. Physical and Chemical Properties of Electrochemical Systems Characterized by EIS in Different Frequency Ranges
The high-frequency region reflects the ionic transport characteristics across the SEI layer, the mid-frequency region corresponds to the charge transfer reaction, while the low-frequency region characterizes solid-state diffusion kinetics within the electrode material. By deconvoluting the impedance response across distinct EIS frequency domains, key electrochemical parameters governing interfacial and bulk processes can be quantitatively evaluated, including SEI film resistance (R_SEI), charge transfer resistance (R_ct), and diffusion impedance (R_w).
2.2 High-Frequency Region (First Semicircle)
- Corresponding Process: Ionic transport impedance of Li⁺ through the SEI layer.
-
Electrochemical Parameters:
-
R_SEI: Resistance of the SEI layer.
-
C_SEI: Capacitance of the SEI layer (reflecting its double-layer characteristics).
-
2.3 Mid-Frequency Region (Second Semicircle)
- Corresponding Process: Charge transfer reaction (electrochemical reaction) at the electrode/electrolyte interface, including:
-
Anode: Li⁺ intercalation/deintercalation in graphite.
-
Cathode: Li⁺ intercalation/deintercalation in LiCoO₂.
-
Electrochemical Parameters:
-
R_ct: Charge transfer resistance (indicates kinetics of electrochemical reactions).
-
C_dl: Double-layer capacitance (charge accumulation at the electrode/electrolyte interface).
-
2.4 Low-Frequency Region (Sloping Line)
- Corresponding Process: Solid-state diffusion of Li⁺ within the bulk electrode material (e.g., inside graphite or LiCoO₂ particles).
-
Electrochemical Parameters:
-
R_w: Warburg impedance (diffusion impedance, inversely proportional to the square root of frequency).
-
3. Experimental Comparison
3.1 Experimental Setup:
Two distinct cell configurations were selected for EIS testing:
- Cell Comparison: Coin cell vs. Pouch cell
- Equipment Comparison: International electrochemical workstation vs. IEST ERT7008
Coin Cell (4.15V, 25°C), Test Parameters: 100 kHz ~ 0.1 Hz, 10 mV sinusoidal signal amplitude (PEIS).
Pouch Cell (2Ah, 3.19V, 25°C), Test Parameters: 100 kHz ~ 0.1 Hz, 80 mA AC current amplitude (GEIS).

Figure 3. EIS Analysis–Different Cell Impedance Analysis
3.2 Results
The EIS data for the Coin Cell demonstrates exceptional congruence between the IEST ERT7008 (green curve) and the competitor equipment (red curve), indicating a very high degree of impedance data matching. Similarly, EIS results for the Pouch Cell show only minor discrepancies between the IEST system and the international electrochemical workstation, with deviations consistently below 5%.
4. IEST ERT 7 Series Specifications
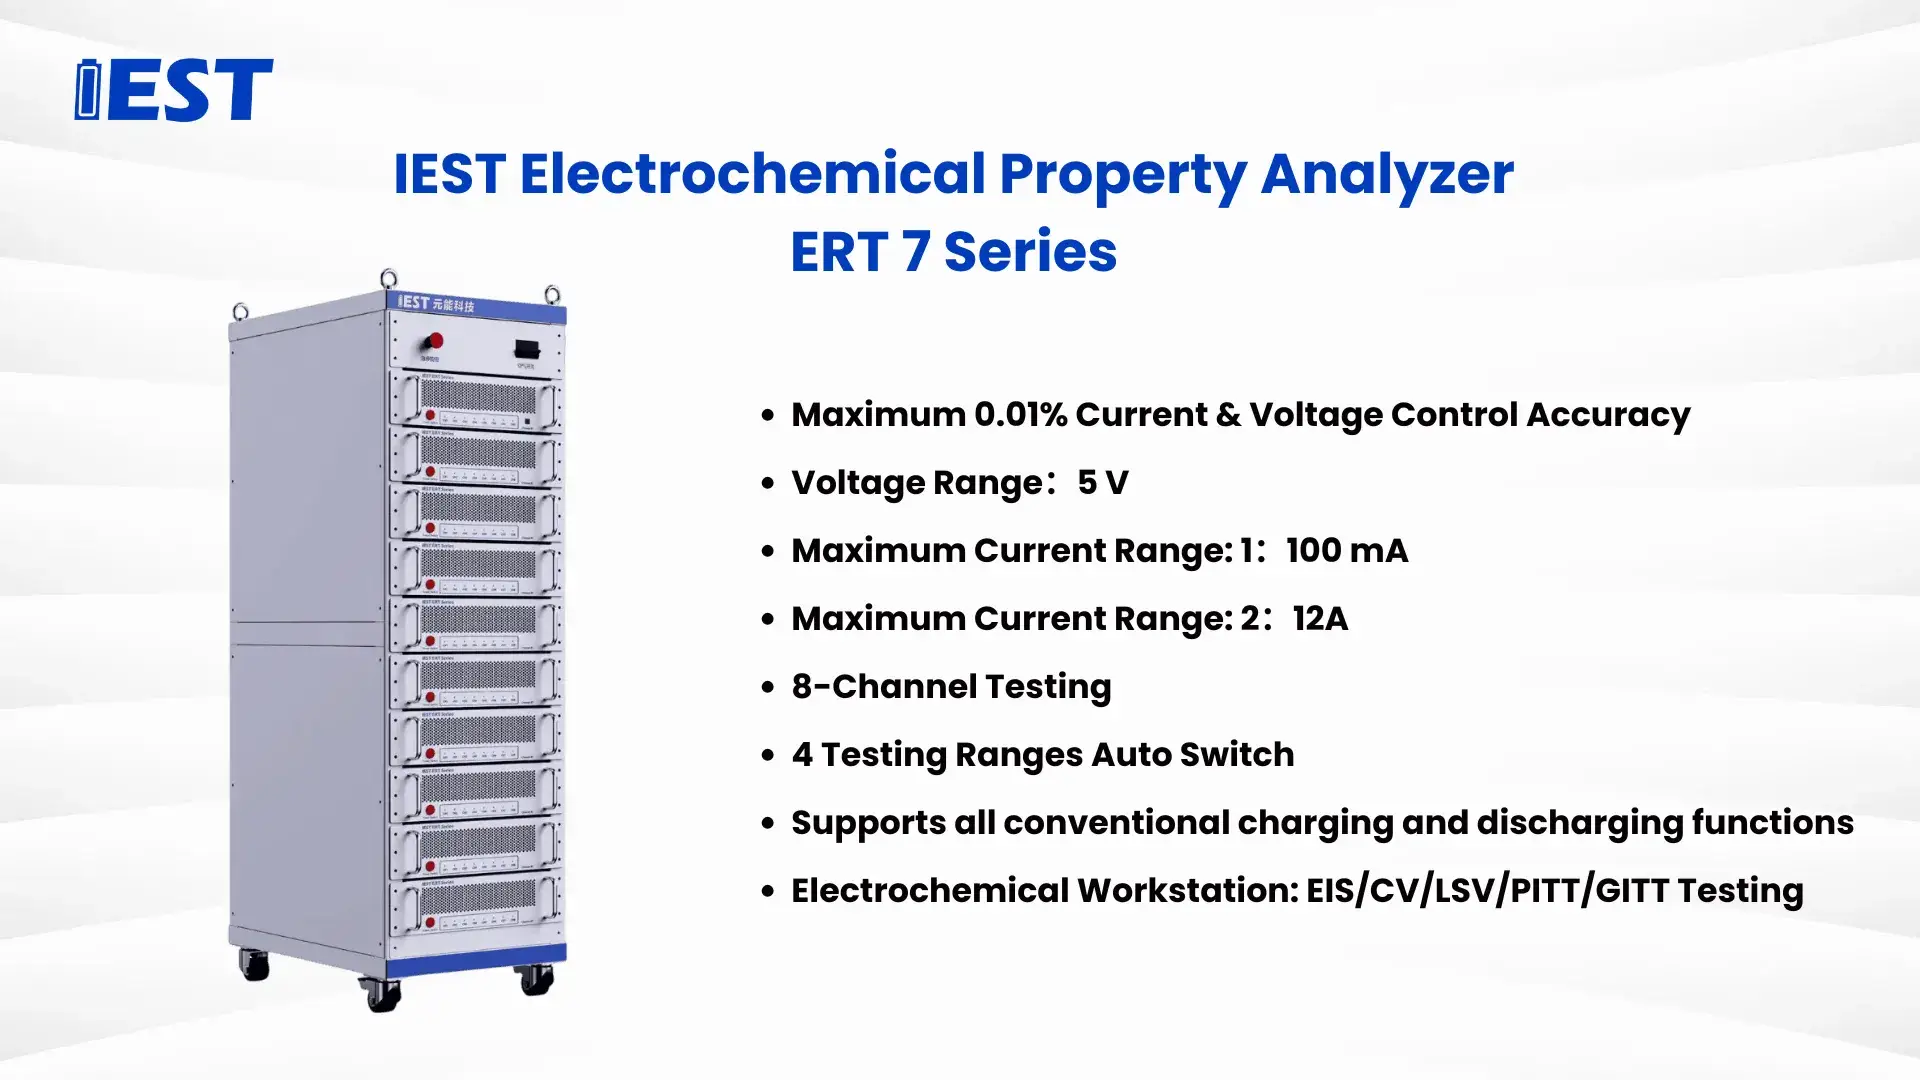
4.1 Wide Frequency Range: 0.01 Hz ~ 100 kHz
- Frequency range is a critical EIS specification. The low-frequency segment (<1 Hz) analyzes diffusion processes, while the high-frequency segment (>10 kHz) reflects contact resistance. The IEST system covers the broad range of 0.01 Hz to 100 kHz, suitable for diverse cell types.
4.2 High-Precision Signal Control: Accommodates cells from 10 mΩ to kΩ range
- Cell impedance spans milliohm (mΩ) to kiloohm (kΩ) levels. The IEST system employs a high-precision signal source and low-noise measurement system, ensuring accuracy and enabling detection of subtle impedance variations.
4.3 Support for Multiple EIS Modes: PEIS & GEIS
- Potentiostatic EIS (PEIS) is suitable for micro-current systems like coin cells and lab-scale cells. Galvanostatic EIS (GEIS) is better suited for pouch cells undergoing low-current discharge. The IEST system supports both modes, catering to varied application requirements.
4.4 Why Choose IEST Instruments Solutions?
| Comparison Item | Electrochemical Workstation | IEST Instruments Solution |
|---|---|---|
| Price | 200,000+ RMB | 50% Cost Reduction |
| Technical Support | Email Communication | 24h Local Technical Support |
| Functional Scope | Stand-alone EIS Testing | Integrated Charge-Discharge & EIS Testing, Supports Dynamic EIS |
-
High Cost-Effectiveness: IEST delivers high-performance testing capabilities at a significantly more accessible price point, eliminating the need for costly additional equipment.
-
Localized Support: Compared to the support response times of international brands, IEST provides faster technical support and after-sales service within the domestic market, ensuring prompt resolution of customer issues.
-
High Integration: The IEST ERT7 series is not merely an EIS tester; it integrates seamlessly with high-precision battery cyclers, enabling comprehensive battery testing and analysis.
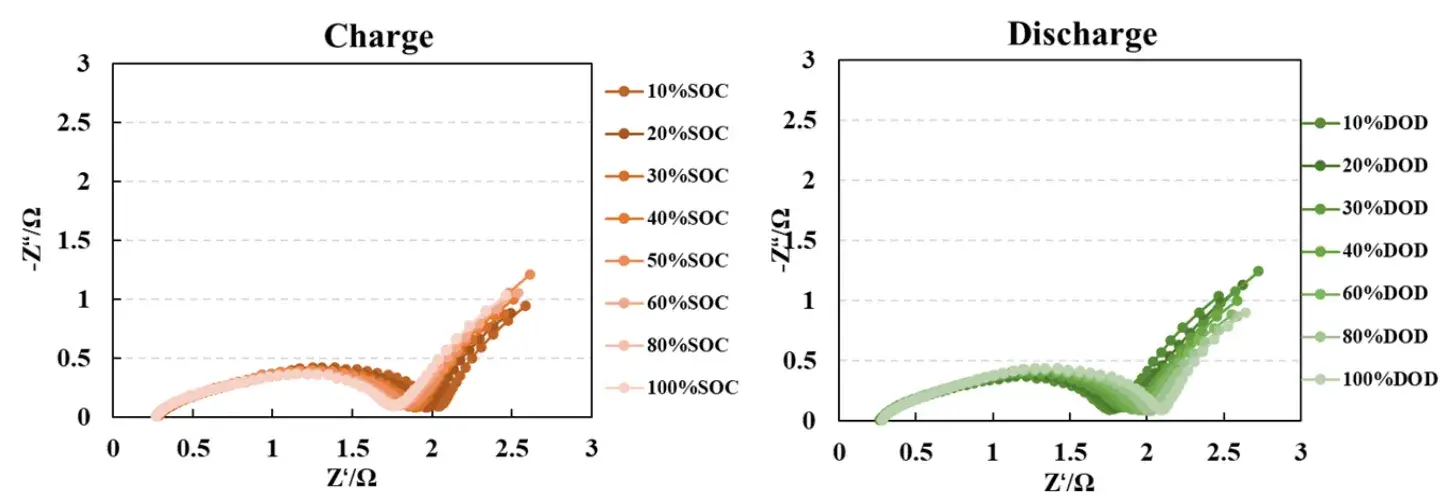
5. Featured Case Study: SOC/DOD Dependent Impedance
Conducting impedance tests at different States of Charge (SOC) and Depths of Discharge (DOD) provides a holistic understanding of internal cell changes during various charge/discharge stages. Variations in the EIS spectrum reveal the state of lithium-ion migration, charge exchange kinetics, and interfacial layers, enabling assessment of battery performance and degradation trends. This methodology is a vital tool for cell optimization design and lifetime prediction.

Figure 4. EIS Testing at different States of Charge (SOC) and Depths of Discharge (DOD)
6. Dynamic EIS Testing
Dynamic EIS is an advanced technique for real-time tracking of a battery’s internal impedance evolution during operation. It enables concurrent measurement during charging or discharging, overcoming the limitation of traditional methods requiring test interruption. Dynamic EIS reveals the battery’s “state of health” across different SOCs, unveiling details of electrochemical processes like Li⁺ transport within materials, charge exchange kinetics, and interfacial stability. This technology is crucial for battery design optimization, aging analysis, and application state monitoring. The IEST ERT7 series supports dynamic EIS testing on cells, with DC bias current capability ranging from microamps to over 10A, meeting diverse application needs.

Figure 5. Dynamic EIS Testing
7. Conclusion
This experimental study validates the EIS testing capability of the IEST ERT7008. The results demonstrate deviations of less than 5% compared to a renowned international electrochemical workstation, fully meeting the requirements for battery research, development, and testing. Furthermore, with its superior cost-effectiveness and responsive localized support, the IEST Instrument solution presents an optimal choice for battery testing equipment. For those seeking a precise, efficient, and stable EIS testing system, IEST Instrument is a highly recommended solution.
Contact Us
If you are interested in our products and want to know more details, please leave a message here, we will reply you as soon as we can.


