

Cell mechanical stiffness affects appearance, module integrity, and abuse resistance of lithium-ion batteries. Mechanical stiffness of cells is commonly split into two concepts:
| Concept | Definition |
|---|---|
| Compression stiffness (compressive stiffness) | Resistance to elastic deformation under externally applied static load (e.g., mechanical squeeze testing) |
| Expansion stiffness | Resistance to dimensional change generated internally during lithium (de-)intercalation — i.e., during charge/discharge |
While compression testing is simple, it is often used as an approximate proxy for expansion stiffness. This study demonstrates that the two are not equivalent: electrochemical state (SOC/DOD) and preload markedly alter expansion stiffness, so direct measurement under cycling conditions is required for accurate module and safety design.
In-Situ Battery Swelling Analyzer — SWE2110 (IEST). High-precision displacement sensor and load cell enable real-time logging of thickness, force/pressure, temperature, voltage, current, and capacity. The SWE2110 supports constant-pressure and constant-gap control.
Compression stiffness can be measured with a general-purpose compression testing machine under static, non-cycling conditions. Expansion stiffness, by contrast, must be captured while a cell is actively charging and discharging — requiring synchronized, real-time acquisition of force, displacement, temperature, voltage, current, and capacity throughout the cycle. This requirement for simultaneous mechanical and electrochemical data logging during active cycling is what a dedicated in-situ instrument like the SWE2110 provides, distinguishing it from a general-purpose compression tester.
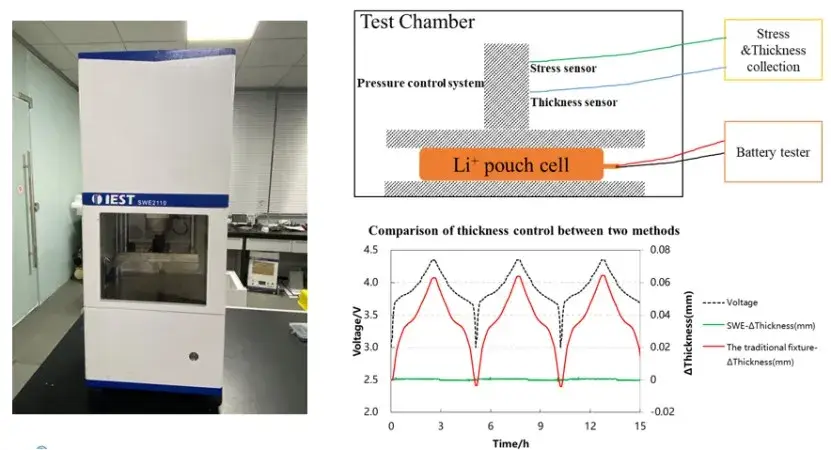
Figure 1. Schematic diagram of the in-situ swelling analysis system(SWE Series)
Details of the cell used in this study are summarized in Table 1.
| Item | Parameter |
|---|---|
| Norminal capacity | 2300mAh |
| Cathode material | LCO |
| Anode Material | Graphite |
| Model | 345877 |
| No. | Step | Stop Condition | Sampling Frequency |
|---|---|---|---|
| 1 | Rest | 60 min | 1s |
| 2 | 0.5C CC | Cut-off Voltage 4.35 V | 1s |
| 3 | 4.35V CV | Cut-off Current 0.05C | 1s |
| 4 | Rest | 10 min | 1s |
| 5 | 0.5C DC | Cut-off Voltage 3.0V | 1s |
Using the constant-pressure mode of the SWE2110, tests were conducted under applied pressures of 10 kg (0.02 MPa), 30 kg (0.06 MPa), 50 kg (0.10 MPa), 100 kg (0.21 MPa), and 200 kg (0.42 MPa). As illustrated in Figure 2, cell thickness increased during charging—corresponding to lithium intercalation in the anode—while higher applied pressure reduced overall expansion.
Expansion stiffness is calculated as $K = \Delta F / \Delta \delta$, where $F$ is applied force and $\delta$ is thickness. This is the same fundamental relationship (force per unit displacement) used for compression stiffness, but expansion stiffness is measured from the force and thickness changes generated internally during cycling rather than from an externally applied static load.
Results in Table 4 and Figure 3 indicate that stiffness values rise with increasing pressure and vary with the state of charge (SOC) or depth of discharge (DOD):
Expansion stiffness is highest at the beginning of charge, then decreases and stabilizes.
During discharge, stiffness initially increases, peaks around 30–50% DOD, and subsequently declines.
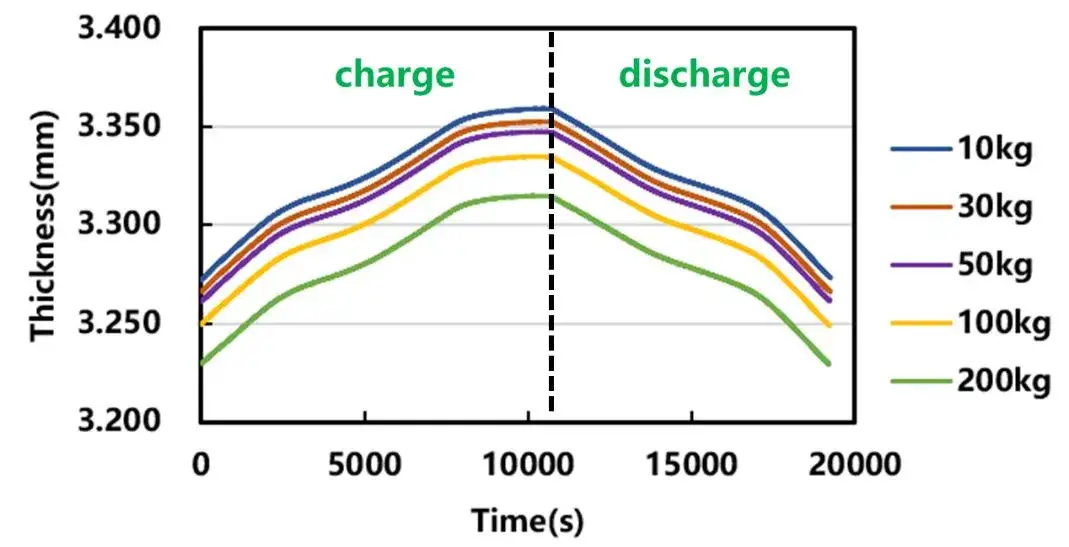
Figure 2. Thickness variation curve of charge/discharge of battery cell under different pressures
| SOC | Stress Stiffness (kN/mm) | |||
|---|---|---|---|---|
| 30-10 | 50-10 | 100-10 | 200-10 | |
| 0% | 33.9 | 37.0 | 40.4 | 44.9 |
| 10% | 32.3 | 35.1 | 38.8 | 43.4 |
| 20% | 30.8 | 34.8 | 38.3 | 43.0 |
| 30% | 30.3 | 34.5 | 38.0 | 43.3 |
| 40% | 31.2 | 35.1 | 38.5 | 43.5 |
| 50% | 30.8 | 34.8 | 38.5 | 43.6 |
| 60% | 30.8 | 34.5 | 38.1 | 43.5 |
| 70% | 31.2 | 35.1 | 38.1 | 43.4 |
| 80% | 31.3 | 35.1 | 38.1 | 43.4 |
| 90% | 32.3 | 35.4 | 38.3 | 43.6 |
| 100% | 31.2 | 34.5 | 37.2 | 43.0 |
| DOD | Stress Stiffness (kN/mm) | |||
|---|---|---|---|---|
| 30-10 | 50-10 | 100-10 | 200-10 | |
| 0% | 30.8 | 34.2 | 37.0 | 43.0 |
| 10% | 31.7 | 35.4 | 37.7 | 43.3 |
| 20% | 31.3 | 35.1 | 38.0 | 43.5 |
| 30% | 31.7 | 36.0 | 38.3 | 44.1 |
| 40% | 30.8 | 35.7 | 38.3 | 44.3 |
| 50% | 30.8 | 35.7 | 38.1 | 44.2 |
| 60% | 29.9 | 35.1 | 38.0 | 44.0 |
| 70% | 29.4 | 34.8 | 37.5 | 43.7 |
| 80% | 29.0 | 34.2 | 37.3 | 43.4 |
| 90% | 28.2 | 34.2 | 37.0 | 43.2 |
| 100% | 28.6 | 34.6 | 37.2 | 43.5 |
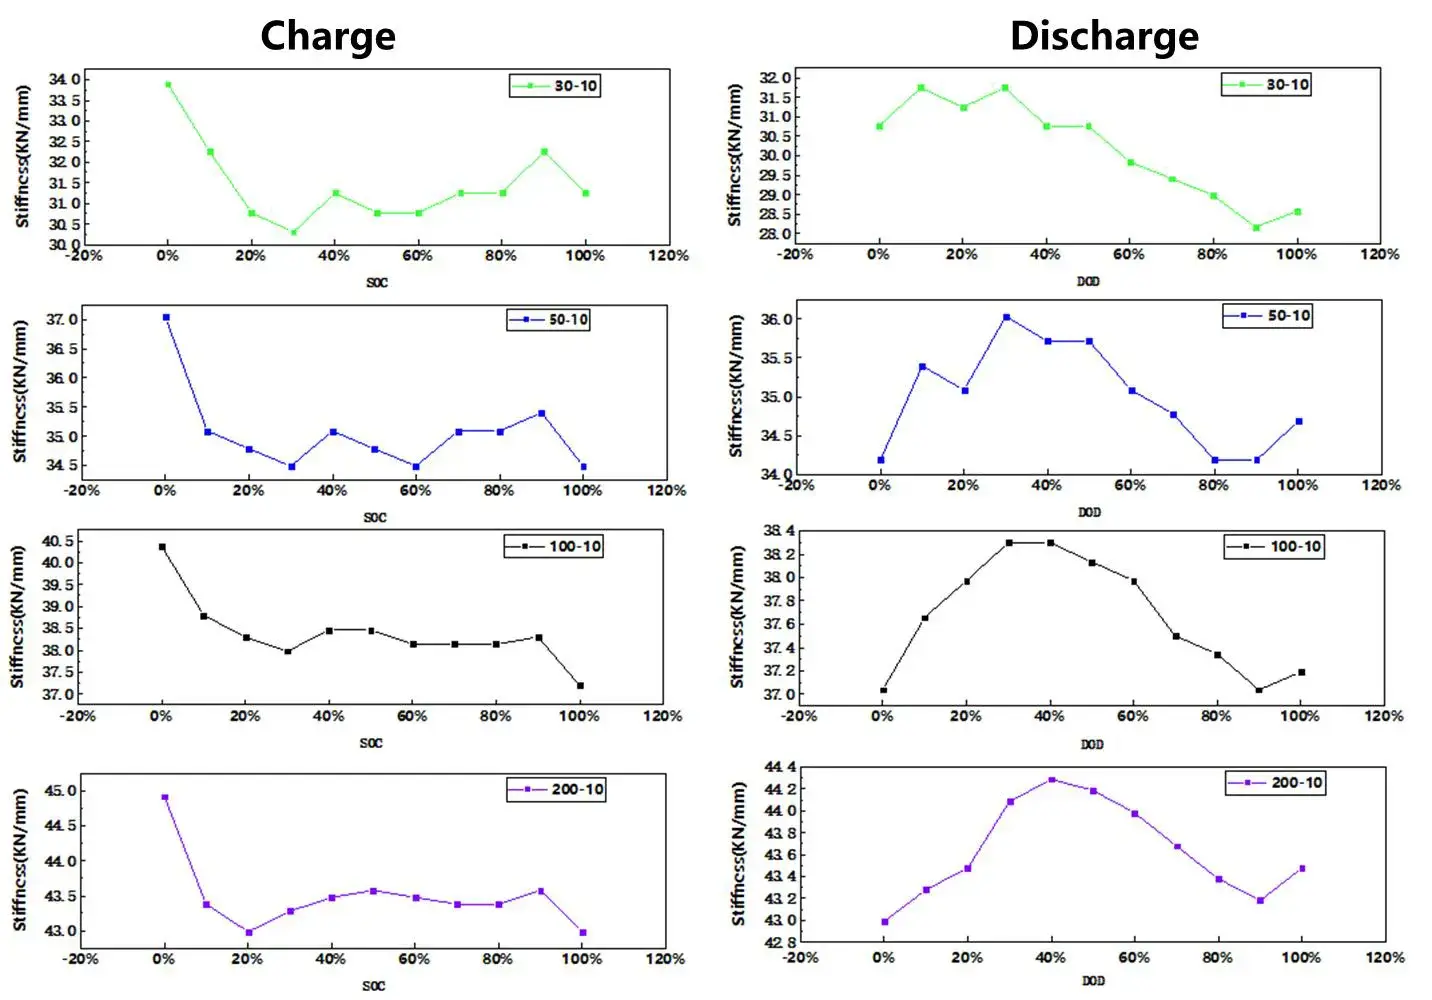
Figure 3. Trend of cell expansion stiffness for different SOC/DOD states
Cells at SOC levels of 0%, 30%, 50%, 80%, and 100% were subjected to the same pressure conditions to measure compressive stiffness under static load. Measured compression stiffness values (Table 5, left) were significantly higher than expansion stiffness (Table 5, right), confirming that using compression stiffness to approximate expansion behavior may lead to substantial error.
| SOC | Compression Stiffness (kN/mm) | |||
|---|---|---|---|---|
| 30-10 | 50-10 | 100-10 | 200-10 | |
| 0% | 40.8 | 42.6 | 51.7 | 62.1 |
| 30% | 90.9 | 64.5 | 67.7 | 75.7 |
| 50% | 71.4 | 45.5 | 59.2 | 67.6 |
| 80% | 83.3 | 66.7 | 69.8 | 77.6 |
| 100% | 71.4 | 61.5 | 65.2 | 69.6 |
| SOC | Expansion Stiffness (kN/mm) | |||
|---|---|---|---|---|
| 30-10 | 50-10 | 100-10 | 200-10 | |
| 0% | 33.9 | 37.0 | 40.4 | 44.9 |
| 30% | 30.3 | 34.5 | 38.0 | 43.3 |
| 50% | 30.8 | 34.8 | 38.5 | 43.6 |
| 80% | 31.3 | 35.1 | 38.1 | 43.4 |
| 100% | 31.2 | 34.5 | 37.2 | 43.0 |
The IEST SWE2110 in-situ swelling analyzer measures true in-cycle expansion stiffness alongside static compression stiffness — across SOC, DOD, and preload — with synchronized force, thickness, and electrochemical data logging.
| Stiffness Type | What Governs the Measured Value |
|---|---|
| Expansion stiffness | How electrochemically generated stresses transmit through electrode microstructure, SEI layers, and current collectors; influenced by electrode porosity, binder elasticity, particle cracking, and interfacial slip |
| Compression (compressive) stiffness | Response to externally applied, uniform mechanical load; dominated by bulk collector and pouch mechanics rather than in-cycle microstructural rearrangements |
Direct in-cycle measurement: Use SWE2110 constant-pressure mode to obtain true expansion stiffness across SOC windows relevant to your application.
Multi-pressure characterization: Test multiple preload levels to understand module preload sensitivity.
SOC mapping: Measure expansion stiffness at representative SOCs (e.g., 0%, 30%, 50%, 80%, 100%) because stiffness varies nonlinearly with SOC.
Statistical sampling: Test multiple cells to capture manufacturing scatter and irreversible changes over cycling.
Use both metrics wisely: Use compression stiffness for mechanical packaging studies where external compression dominates; use expansion stiffness for in-service deformation, stress accumulation and module clamp design.
Module clamps and springs must be specified considering lower expansion stiffness (i.e., cells exert less constraining force during swelling than predicted from compression tests), otherwise fasteners may be underspecified or overcompensated leading to unnecessary mass/complexity.
Safety analyses and drop/impact models should incorporate in-cycle stiffness to estimate realistic deformation and potential shorting risks.
This study demonstrates that the SWE2110 system effectively characterizes both expansion stiffness and compression stiffness in lithium-ion cells. Results confirm that cell stiffness is influenced not only by SOC/DOD but also by the magnitude of applied pressure. Crucially, compression stiffness cannot be directly used to estimate expansion stiffness due to measurable differences between the two. These findings underscore the need for dedicated expansion-stiffness testing to ensure accurate mechanical modeling and enhanced safety design in battery development.
[1] Hoeschele P , Heindl SF , Erker S ,et al. Influence of reversible swelling and preload force on the failure behavior of a lithium-ion pouch cell tested under realistic boundary conditions[J].Journal of Energy Storage, 2023.
[2] ZHU Maoyu,HE Jianchao,YU Ao,et al. Method for testing the expansion stiffness of an cell. Patent No. 202310112653[P][2024-01-15].
Compression stiffness (also called compressive stiffness) measures a cell’s resistance to elastic deformation under an externally applied static load, similar to a mechanical squeeze test. Expansion stiffness measures resistance to dimensional change generated internally during lithium (de-)intercalation as the cell charges and discharges. This study found expansion stiffness is measurably lower than compression stiffness, so compression testing alone tends to overestimate the constraining force a cell exerts during real cycling.
Expansion stiffness is calculated as K = ΔF/Δδ (force change over thickness change), measured while a cell is actively cycling under a fixed applied pressure using an in-situ instrument such as the IEST SWE2110. Because the stiffness value depends on state of charge and applied preload, measurement should be performed across representative SOC/DOD points (e.g., 0%, 30%, 50%, 80%, 100%) and multiple pressure levels rather than at a single condition.
Expansion stiffness reflects how electrochemically generated stresses transmit through the electrode microstructure, SEI layers, and current collectors — properties that change as lithium intercalates and de-intercalates. In this study, expansion stiffness was highest at the start of charge, then decreased and stabilized, while during discharge it increased, peaked around 30–50% DOD, and then declined, reflecting the nonlinear mechanical response of the electrode microstructure across the cycle.
Module clamps, springs, and fasteners should be specified using expansion stiffness data rather than compression stiffness, because compression stiffness significantly overestimates the constraining force a cell exerts during actual in-service swelling. Using compression stiffness alone risks underspecifying or overcompensating clamp design, leading to safety margin errors or unnecessary added mass and complexity.
This study’s expansion and compression stiffness data — particularly how expansion stiffness varies with SOC, DOD, and preload — provides input data relevant to sizing compression pads, preload fixtures, and module clamp force for a given cell format. This article reports the underlying cell-level stiffness measurements; specific pad or fixture geometry and compression curve design are separate downstream engineering steps not covered here.
