

The separator is a critical component in lithium-ion batteries, directly influencing key performance metrics such as current output, capacity, and cycle life.1 An ideal separator must possess several characteristics: (1) excellent electrolyte wettability and ion permeability; (2) superior thermal stability to prevent short circuits from thermal shrinkage; (3) electronic insulation and electrochemical stability; (4) chemical inertness toward electrodes and electrolyte; (5) high mechanical strength to withstand manufacturing stresses; and (6) appropriate thickness, pore size, and porosity to optimize ion transport while balancing mechanical integrity and internal resistance.
Microporous polyolefin separators — notably polyethylene (PE) and polypropylene (PP) — dominate the commercial market due to favorable mechanical properties, electrochemical stability, thermal resistance, and low cost. Despite widespread use, these separators have limitations, including a tendency for thermal shrinkage at elevated temperatures, low intrinsic porosity, and poor electrolyte affinity, which can significantly impair battery performance. Common modification strategies to address these issues include graft modification, coating, and development of new materials or processing techniques.2
Separator layer coating involves applying a layer of organic polymer or inorganic ceramic particles onto a polyolefin or alternative base separator. This technique primarily serves three functions: (1) enhancing electrolyte absorption and retention to extend cycle life; (2) improving high-temperature resistance, flame retardancy, and mechanical properties; and (3) potentially adding shutdown functionality for improved safety.3 While coatings can significantly boost mechanical and thermal performance, maintaining adequate porosity is crucial to ensure unimpeded ion conduction. Verifying that a coated separator meets performance expectations is essential — this study evaluates the impact of different coating processes on ionic conductivity by comparing the base membrane against various coated separators.
The self-developed multi-channel ionic conductivity testing system (IEST EIC1400M) was used, as shown in Figure 1. This equipment includes four battery assembly fixtures and can perform rapid four-channel electrochemical impedance spectroscopy (EIS) tests. The pressure range is 0–20 kg, and the frequency range is 100 kHz to 0.01 Hz.
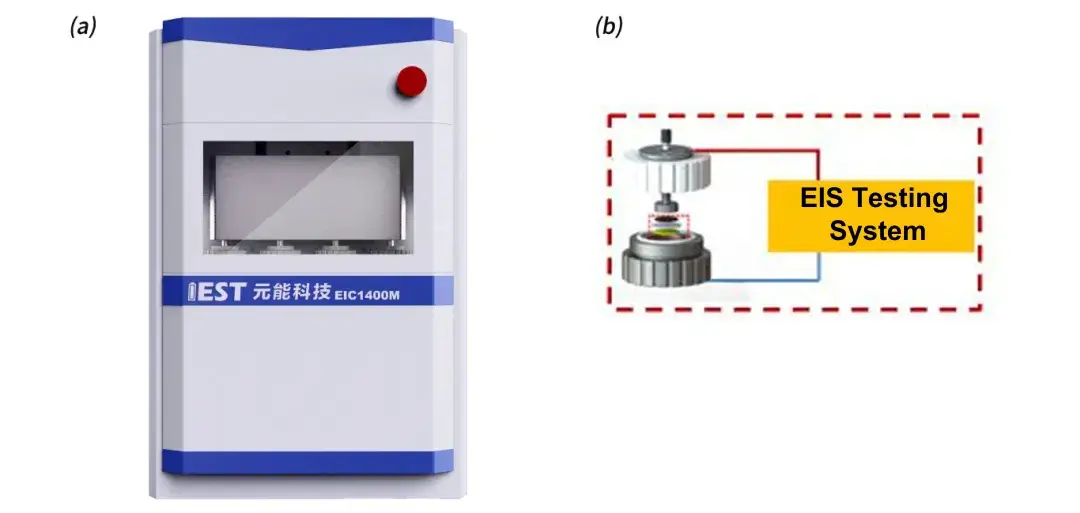
Figure 1. (a) IEST Multi-Channel Ionic Conductivity Testing System: equipment overview; (b) battery assembly fixtures used to evaluate separator layer coating processes.
Samples tested included Base Separator A (uncoated) and three coated separators (B, C, and D) produced using different coating processes.
In a glove box, the corresponding number of separator layers were placed into the fixtures and electrolyte was added. Assembled fixtures were placed into the equipment under 5 kg applied force. The experiment was initiated via software, and after the set dwell time, EIS of all four channels was tested automatically across a frequency range of 100,000 to 100 Hz. Assembly and testing was performed for separators with 1 to 4 layers respectively, obtaining corresponding EIS curves. These curves were fitted to establish a baseline, with the intersection of the fitting line and the X-axis representing the impedance Rs for the n-layer separator (Figure 2a). Plotting layer count on the X-axis against impedance value per layer on the Y-axis, linear regression yields the slope, which represents the ionic impedance R of a single-layer separator (Figure 2b).
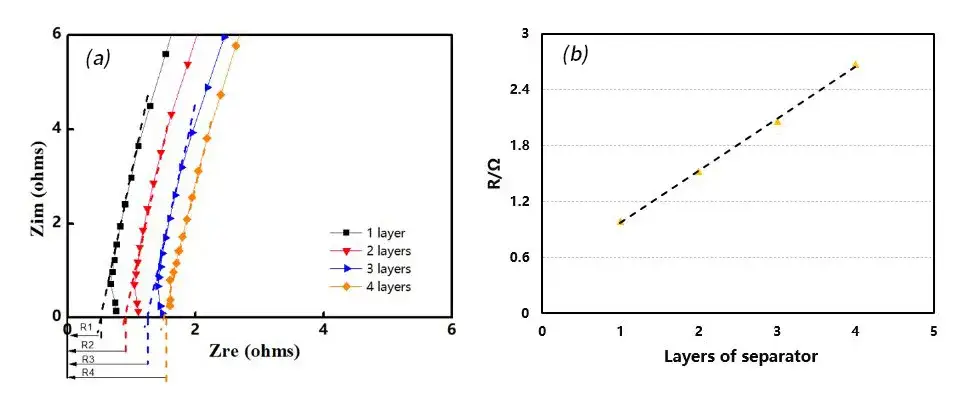
Figure 2. (a) EIS impedance spectra of different separator layer numbers; (b) R-value fitting graph used to extract single-layer ionic resistance.
Substituting the obtained ionic impedance R into Formula 1 allows calculation of the separator ionic conductivity.
Where \(\sigma\) is the ionic conductivity, \(d\) is the separator thickness, \(R\) is the ionic resistance, and \(S\) is the effective surface area of the separator.
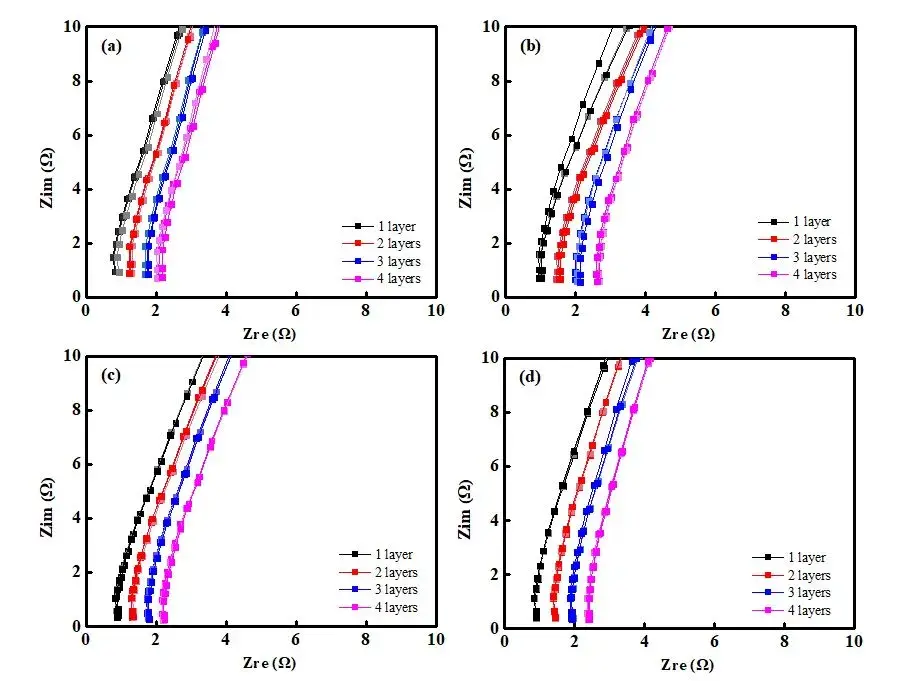
Figure 3. EIS spectra of separators with different coating processes: Base Film A (a); Coated Separator B (b); Coated Separator C (c); Coated Separator D (d).
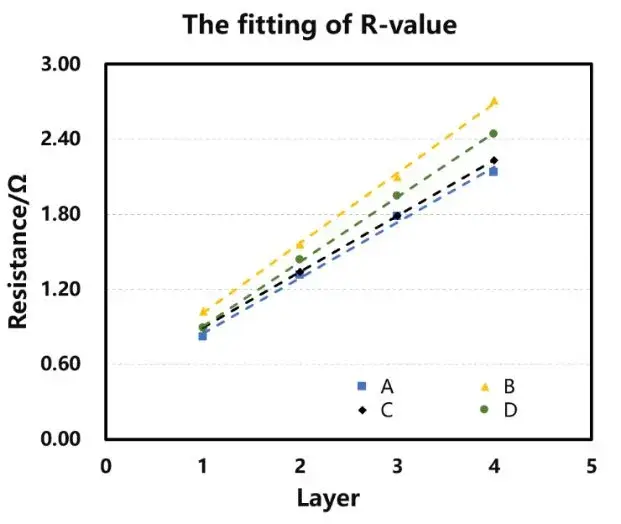
Figure 3 presents the EIS spectra for the different separators. As expected, impedance increases with the number of separator layers for all samples. The fitted Rs values for 1 to 4 layers are summarized in Table 1. The linear regression plots of layer count versus resistance (Figure 4) and the corresponding equations and goodness-of-fit (R²) are provided in Table 2.
The calculated single-layer resistances (R) for separators A, B, C, and D: R (Ω): A = 0.44, B = 0.56, C = 0.45, D = 0.52.
However, using Equation 1 to compute ionic conductivity reveals a more informative picture. The resulting ionic conductivities are: Ionic conductivity σ (S/cm): Separator C (0.00189) > Separator B (0.00169) > Separator D (0.00145) > Separator A (0.00112).
Notably, all coated separators exhibited significantly higher ionic conductivity than the base separator, with improvements of 50.9%, 68.7%, and 29.4% for B, C, and D respectively, and Separator C showing the largest gain (0.00189 S/cm). This indicates that separator coating modification provides additional pathways for lithium-ion transport, facilitating improved internal battery ion transport despite the added coating thickness.
| Separator | A | B | C | D | |
|---|---|---|---|---|---|
| Electrolyte conductivity / S/cm | 1.09×10⁻² | ||||
| Area / cm² | 2.01 | ||||
| Thickness / µm | 10 | 19 | 17 | 15 | |
| 1layer (R1/Ω) | Sample 1 | 0.80 | 0.98 | 0.91 | 0.90 |
| Sample 2 | 0.85 | 1.04 | 0.86 | 0.89 | |
| Sample 3 | 0.81 | 1.05 | 0.87 | 0.88 | |
| COV | 2.46% | 2.96% | 2.47% | 0.77% | |
| Average | 0.82 | 1.02 | 0.89 | 0.89 | |
| 2layers (R2/Ω) | Sample 1 | 1.30 | 1.62 | 1.32 | 1.44 |
| Sample 2 | 1.35 | 1.51 | 1.36 | 1.42 | |
| Sample 3 | 1.28 | 1.56 | 1.33 | 1.44 | |
| COV | 2.27% | 3.02% | 1.50% | 0.64% | |
| Average | 1.31 | 1.56 | 1.34 | 1.44 | |
| 3layers (R3/Ω) | Sample 1 | 1.80 | 2.06 | 1.77 | 1.91 |
| Sample 2 | 1.73 | 2.07 | 1.78 | 1.96 | |
| Sample 3 | 1.83 | 2.17 | 1.82 | 1.96 | |
| COV | 2.37% | 2.31% | 1.11% | 1.14% | |
| Average | 1.78 | 2.10 | 1.79 | 1.95 | |
| 4layers (R4/Ω) | Sample 1 | 2.13 | 2.75 | 2.21 | 2.46 |
| Sample 2 | 2.06 | 2.72 | 2.22 | 2.41 | |
| Sample 3 | 2.22 | 2.65 | 2.26 | 2.46 | |
| COV | 3.06% | 1.53% | 0.82% | 0.88% | |
| Average | 2.14 | 2.71 | 2.23 | 2.44 | |
| R / Ω | 0.44 | 0.56 | 0.45 | 0.52 | |
| σ / S/cm | 0.00112 | 0.00169 | 0.00189 | 0.00145 | |
| Separator | Single-Layer Resistance R (Ω) | Ionic Conductivity σ (S/cm) | Improvement vs Base Film A |
|---|---|---|---|
| A (Uncoated Base Film) | 0.44 | 0.00112 | — (baseline) |
| B (Coated) | 0.56 | 0.00169 | +50.9% |
| C (Coated) | 0.45 | 0.00189 (highest) | +68.7% |
| D (Coated) | 0.52 | 0.00145 | +29.4% |
| Separator | The fitting formula | R2 |
|---|---|---|
| A | y = 0.44x + 0.41 | 0.994 |
| B | y = 0.56x + 0.45 | 0.999 |
| C | y = 0.45x + 0.45 | 1 |
| D | y = 0.52x + 0.39 | 0.999 |
Ionic conductivity is intrinsically linked to the separator’s microstructure, including pore size, porosity (\(\varepsilon\)), and tortuosity (\(\tau\)). Porosity represents the void volume fraction; uniform, moderate porosity helps prevent electrode polarization and lithium plating. Excessively high porosity can compromise mechanical strength and thermal stability, while overly low porosity reduces electrolyte retention and prolongs ion migration paths. Tortuosity — the ratio of actual ion path length to separator thickness — directly influences internal resistance. Low tortuosity enables fast ion transport, whereas high tortuosity increases resistance and can promote lithium dendrite growth.
A separator layer coating modifies this microstructure. While it increases overall thickness, it can also alter pore structure, size distribution, and interconnectivity. Coatings often enhance wettability and electrolyte retention as well. Therefore, a well-designed coating can create a more favorable micro-environment — with optimized porosity, reduced tortuosity, and better electrolyte access — that more than compensates for the increased physical thickness, resulting in a net gain in ionic conductivity, exactly as observed with Separator C in this study
To optimize separator layer coating for ionic conductivity and safety, apply these principles:
Prioritize hydrophilic/ion-friendly additives (e.g., ceramic nanoparticles + binder blends) to boost electrolyte uptake without sealing pores.
Control coating porosity — use templating or low-viscosity slurries that form interconnected pore networks after drying.
Limit effective added thickness: target a coating thickness that meets thermal/mechanical goals while keeping the conduction path short.
Minimize tortuosity by aligning pores or using particulate blends that produce straight-through channels.
Measure under representative stack pressure — cell compression affects pore geometry; validate σ at mechanical loads similar to cell assembly (the referenced tests used ~5 kgf).
Balance trade-offs — increased mechanical/thermal robustness often comes at the cost of added material; quantify the net effect on σ and cell impedance early in development.
Separator layer coating can significantly alter ionic conductivity through changes to porosity, tortuosity, wettability, and thickness. This study effectively employed the IEST multi-channel separator ionic conductivity test system to evaluate the performance of separators with different coating treatments, providing a robust, repeatable way to quantify single-layer ionic resistance and compare coating processes.
Measuring a separator’s ionic conductivity provides direct insight into how easily lithium ions can migrate through it, serving as a critical check on whether a separator — coated or uncoated — meets design expectations. This analytical approach is valuable not only for optimizing coating recipes but also for broader studies investigating the influence of different electrolytes and base separator materials on overall ion transport efficiency.
[1] Huang Xuejie. Progress in lithium-ion batteries and related materials [J]. China Materials Progress, 2010, 29 (8): 46-52.
[2] Li Jiaxing, Li Feng. Research progress in surface modification technology of polyolefin lithium battery separators [J]. Information Recording Materials, 2021, 22 (4): 3-8.
[3] CHOI J A, SA H K, KIM D W. Enhancement of thermal stability and cycling performance in lithium-ion cells through the use of ceramic-coated separators [J], Journal of Power Sources, 2010 (195): 6192-6196.
Separator layer coating can substantially increase ionic conductivity despite adding physical thickness, because a well-designed coating improves the separator’s microstructure — optimizing porosity, reducing tortuosity (the ratio of actual ion path length to thickness), and enhancing electrolyte wettability and retention. In controlled EIS testing of four membranes, all three coated separators showed significantly higher ionic conductivity than the uncoated base film, with improvements ranging from 29.4% to 68.7% depending on the coating process. This demonstrates that coating quality and microstructure design matter more for ion transport than the simple addition of thickness would suggest.
This counterintuitive result occurs because ionic conductivity depends on the separator’s internal microstructure — porosity, tortuosity, and electrolyte accessibility — not just its physical thickness. A coating can create additional or better-connected ion transport pathways, improve electrolyte wettability, and reduce the effective tortuosity of the ion path, even though it adds thickness. In this study, coated Separator C achieved the highest ionic conductivity (0.00189 S/cm) of all four samples tested, a 68.7% improvement over the uncoated base film (0.00112 S/cm) — showing that a well-engineered coating’s microstructural benefits can outweigh the added thickness penalty.
Separator ionic conductivity is measured using electrochemical impedance spectroscopy (EIS) on stacks of 1 to 4 separator layers assembled with electrolyte under controlled pressure (5 kg in this study). Each layer-count configuration produces an EIS curve whose fit yields an impedance value (Rs); plotting Rs against layer count and taking the linear regression slope gives the single-layer ionic resistance R. This resistance is substituted into the formula σ = d / (R × S), where σ is ionic conductivity, d is separator thickness, and S is the effective surface area — yielding a conductivity value in S/cm that can be directly compared across different separator coating processes.
Battery manufacturers designing a separator layer coating should prioritize: hydrophilic or ion-friendly additives (such as ceramic nanoparticle-binder blends) that boost electrolyte uptake without sealing pores; controlled coating porosity using templating or low-viscosity slurries that form interconnected pore networks after drying; minimized added thickness that meets thermal and mechanical targets while keeping the ion conduction path short; reduced tortuosity through pore alignment or particulate blends that create straighter ion transport channels; and testing under representative stack pressure, since cell compression affects pore geometry and can change measured conductivity compared to an unstressed sample.
Porosity represents the void volume fraction of the separator — the proportion of the material that is empty space available for electrolyte and ion transport. Uniform, moderate porosity helps prevent electrode polarization and lithium plating, while excessively high porosity compromises mechanical strength and thermal stability, and overly low porosity reduces electrolyte retention. Tortuosity is the ratio of the actual (winding) ion path length through the pore network to the separator’s physical thickness. Low tortuosity means ions travel a relatively direct path and encounter lower resistance, while high tortuosity means ions must navigate a longer, more winding path, increasing internal resistance and potentially promoting lithium dendrite growth. Both parameters are altered by separator layer coating and together determine the net effect on ionic conductivity.
