Description
1. Significance of Ion Conductivity Testing
1.1 Electrode Tortuosity and Kinetic Performance
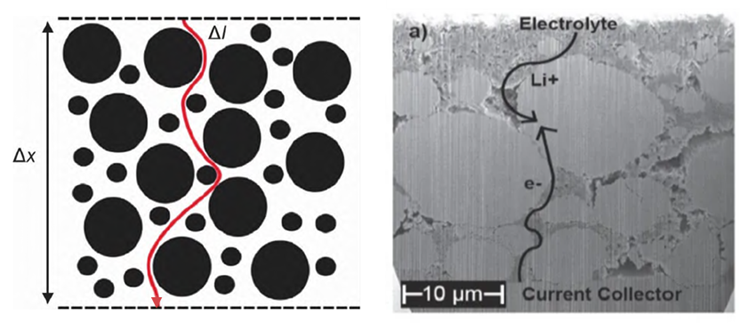
- Tortuosity represents the sinuosity of transport pathways in porous electrodes and serves as another key parameter related to transport characteristics alongside porosity. It characterizes electrolyte percolation capability and ion migration rate, directly influencing the battery’s capacity utilization and rate capability.
- By testing electrode tortuosity, electrode performance can be predicted, rapidly correlating electrode structure with performance evaluation to accelerate electrode design and process development.
1.2 Separator Ionic Conductivity:
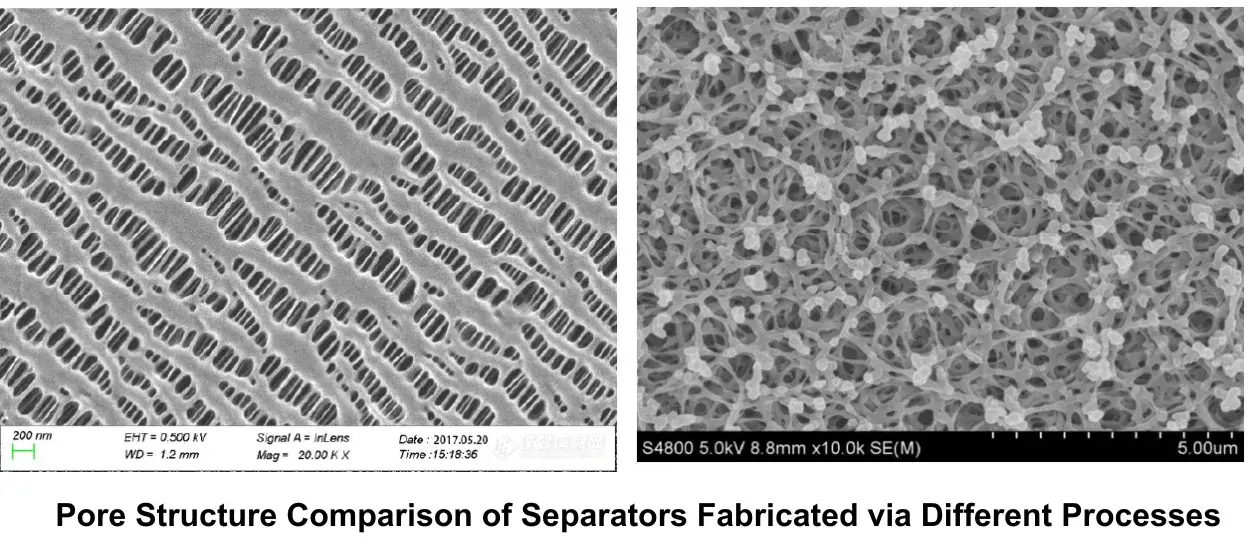
- In recent years, separator coating applications have expanded significantly. Coating processes enhance lithium-ion battery separator properties such as puncture resistance, thermal stability, and electrolyte wettability. While improving safety performance, it is equally crucial to ensure stable electrochemical performance. Therefore, ionic conductivity testing is particularly important for comparing and characterizing separator performance.
2. Testing & Calculation Methods
2.1 Electrode Testing
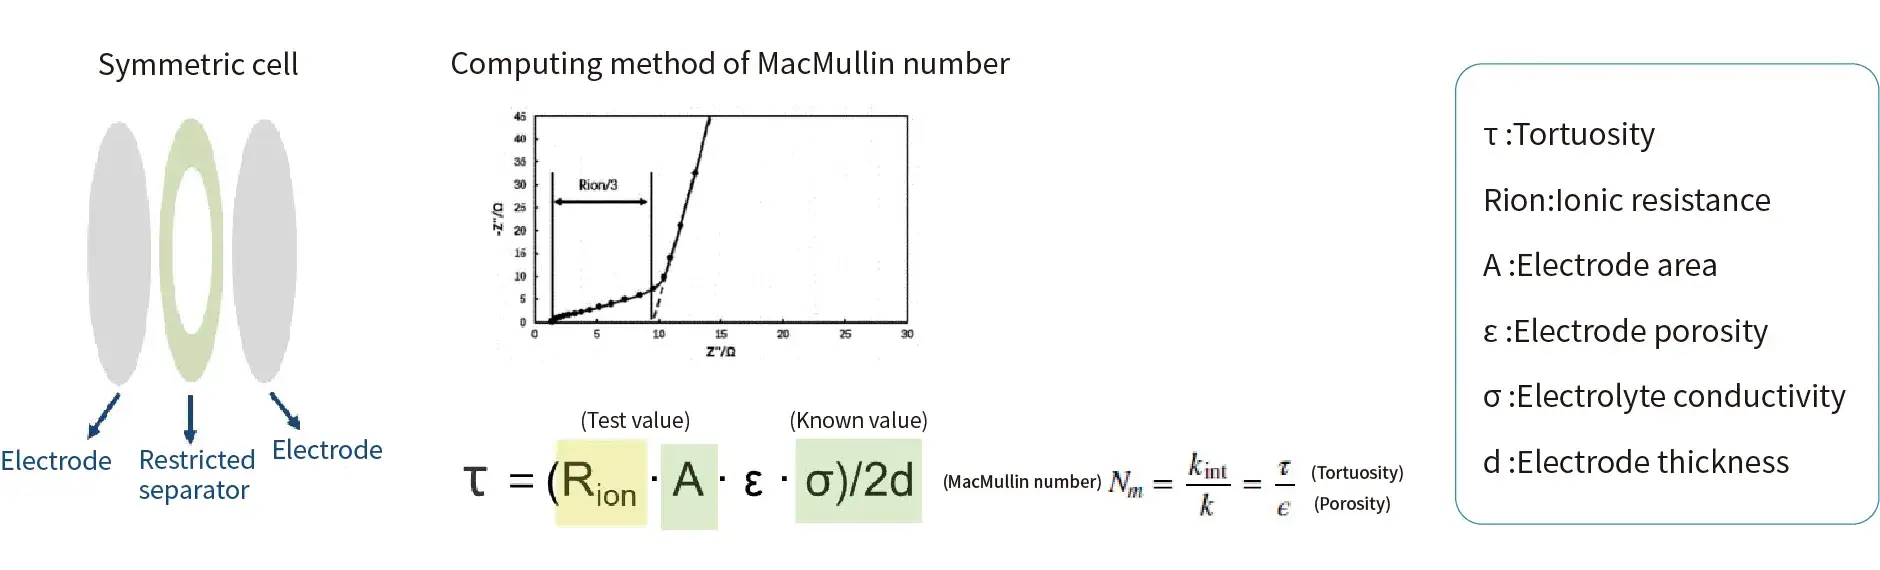
- Assemble a symmetrical cell and perform Electrochemical Impedance Spectroscopy (EIS) testing.
- As shown in the figure below, perform linear fitting on the high-frequency region and the low-frequency region of the EIS spectrum (Nyquist plot). Three times the difference between the points where the respective fitted curves intersect the real impedance axis (Z’/X-axis) gives the ionic resistance Rion of the electrode coating.
- Calculate the MacMullin number using the formula to indirectly characterize the electrode tortuosity.
2.2 Separator Testing
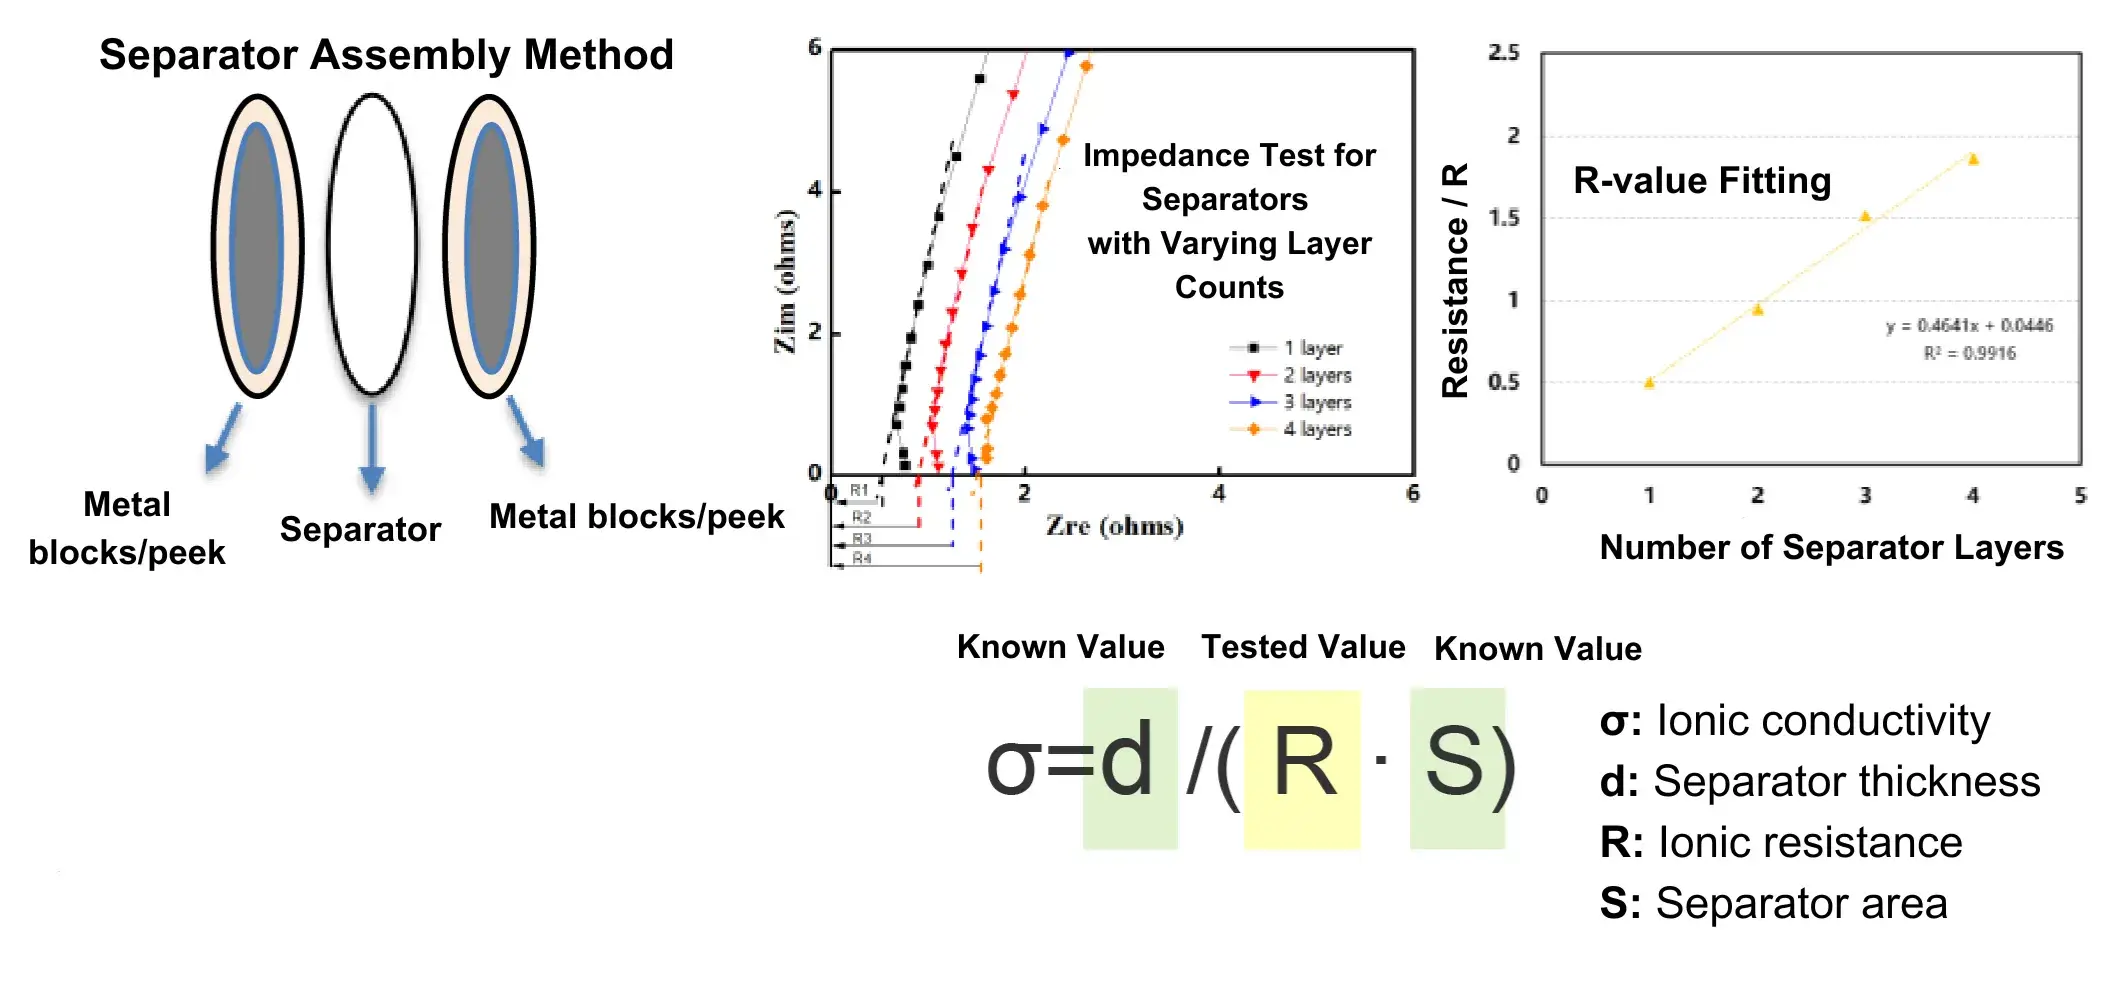
- Test the EIS of 1–4 separator layers to obtain $R_1, R_2, R_3, R_4$.
- Plot a curve with the number of separator layers as the X-axis and separator resistance as the Y-axis. Calculate the slope and the linear goodness of fit, which must be ≥0.99.
- Calculate the ionic conductivity (σ) using the formula:$sigma = d / (R times S)$.
3. IEST Creative Solutions
3.1 Creative Solution one
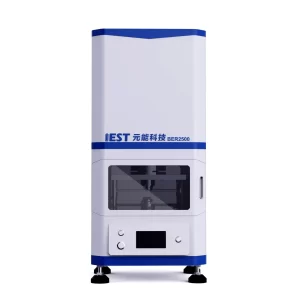
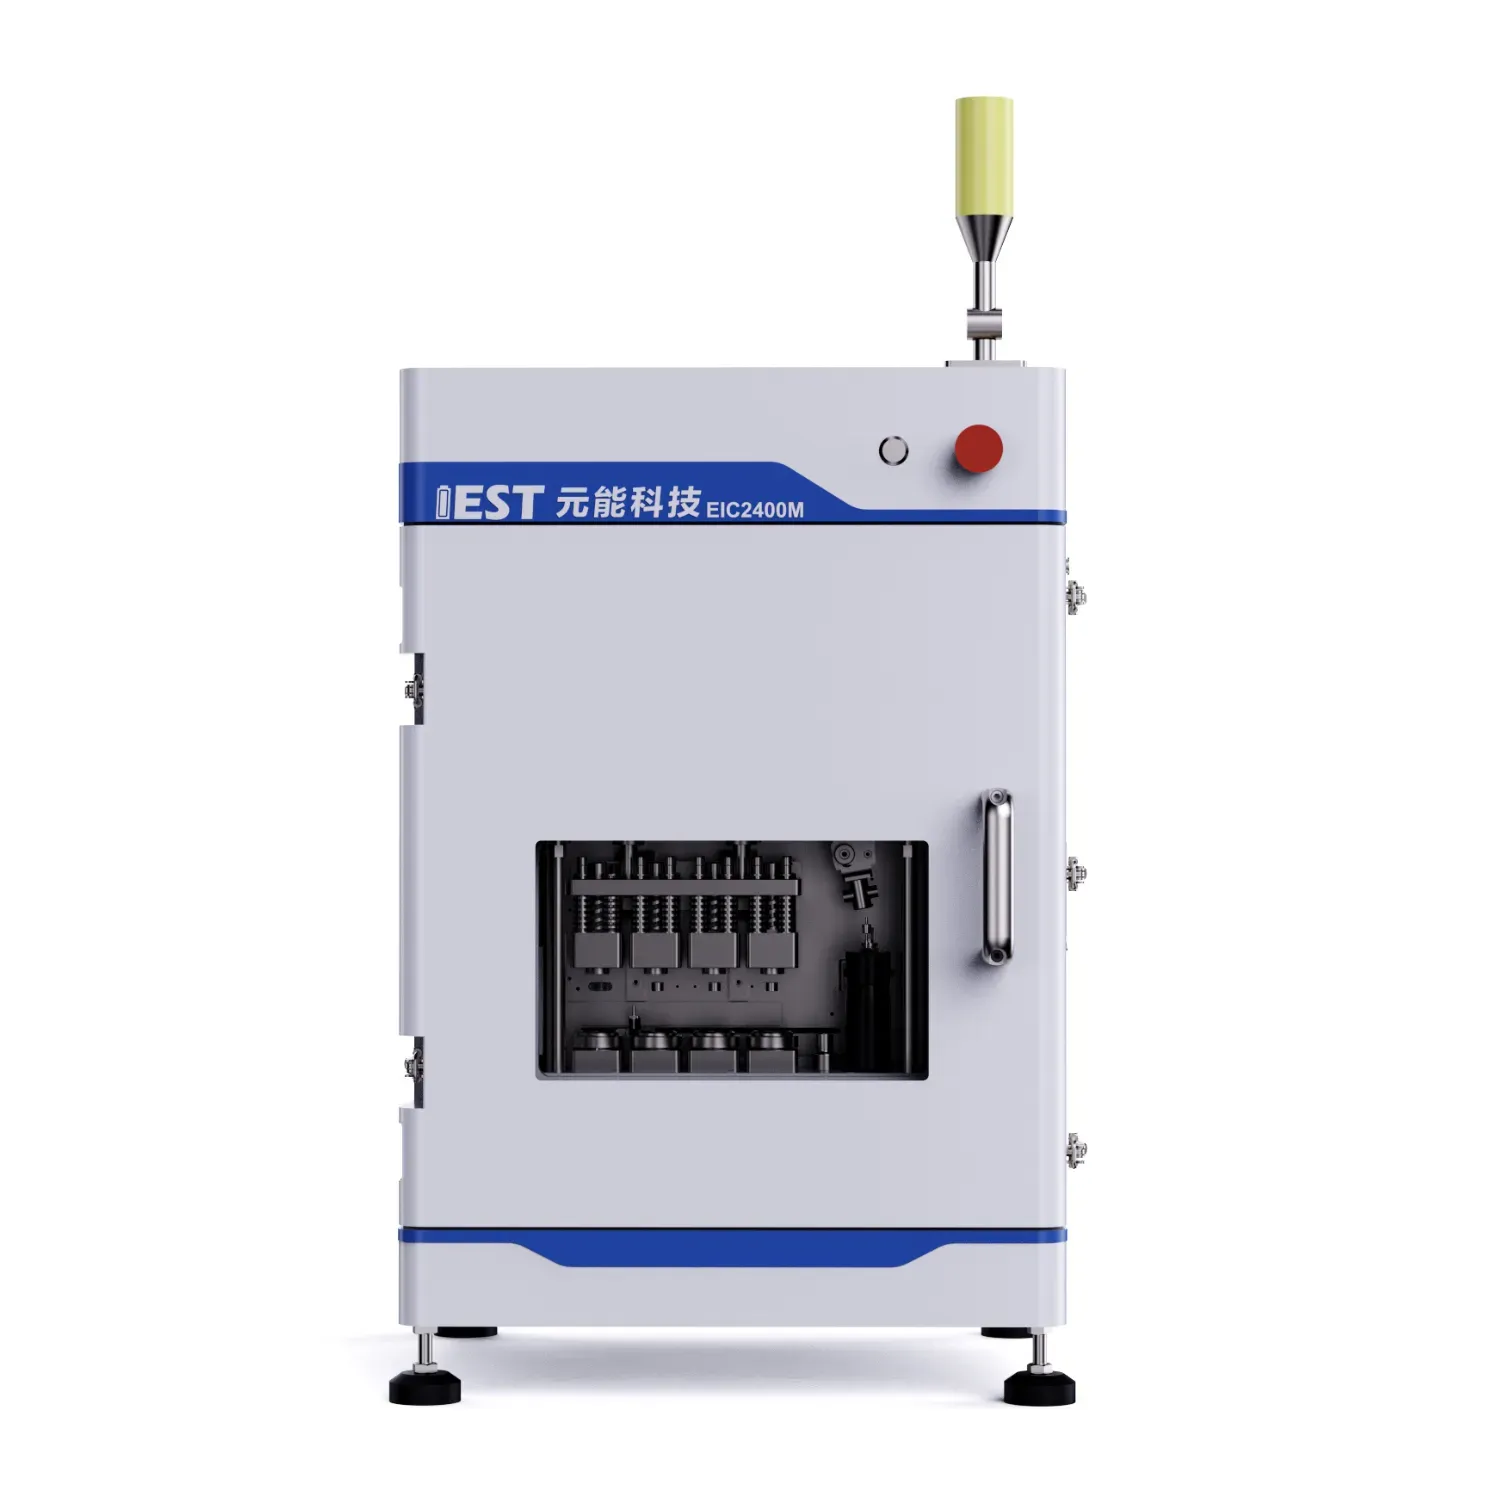
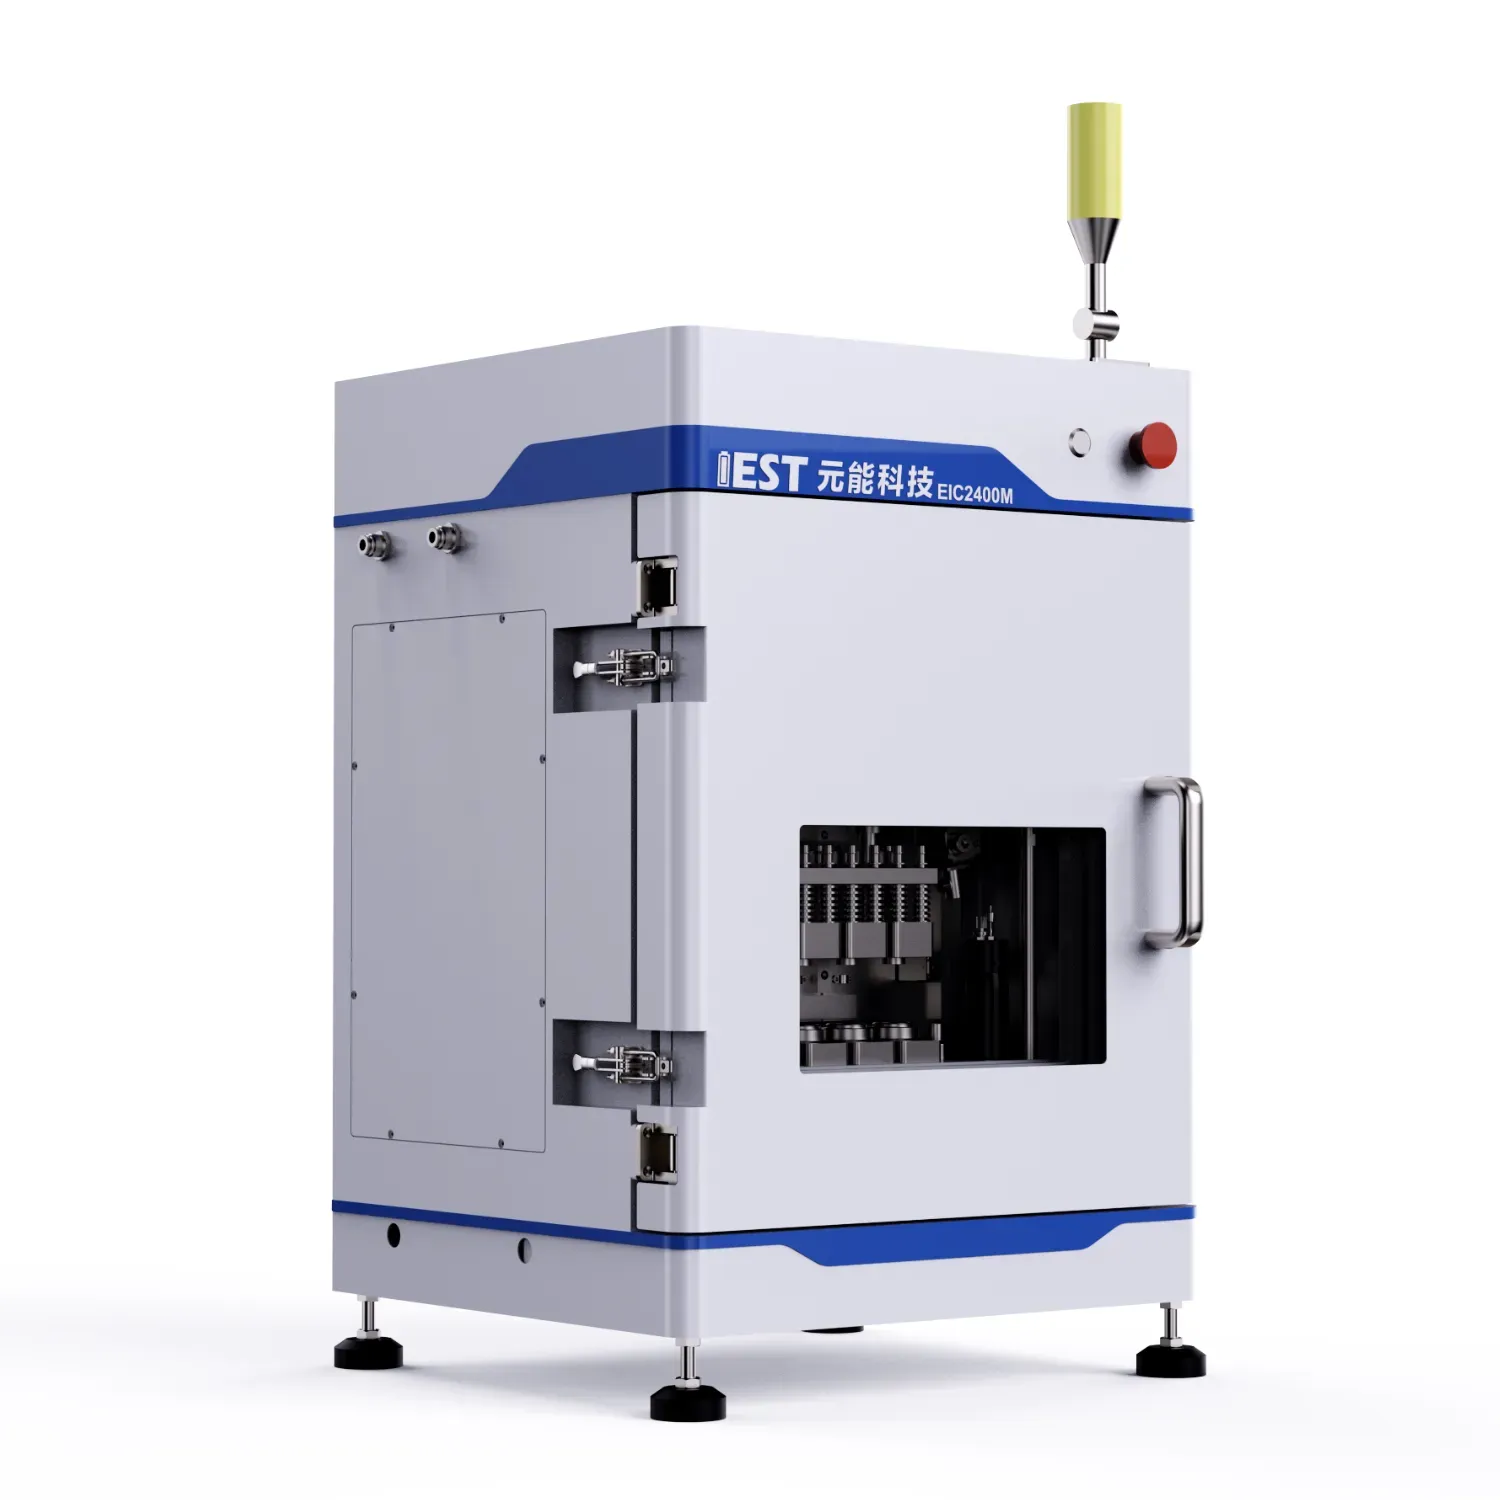
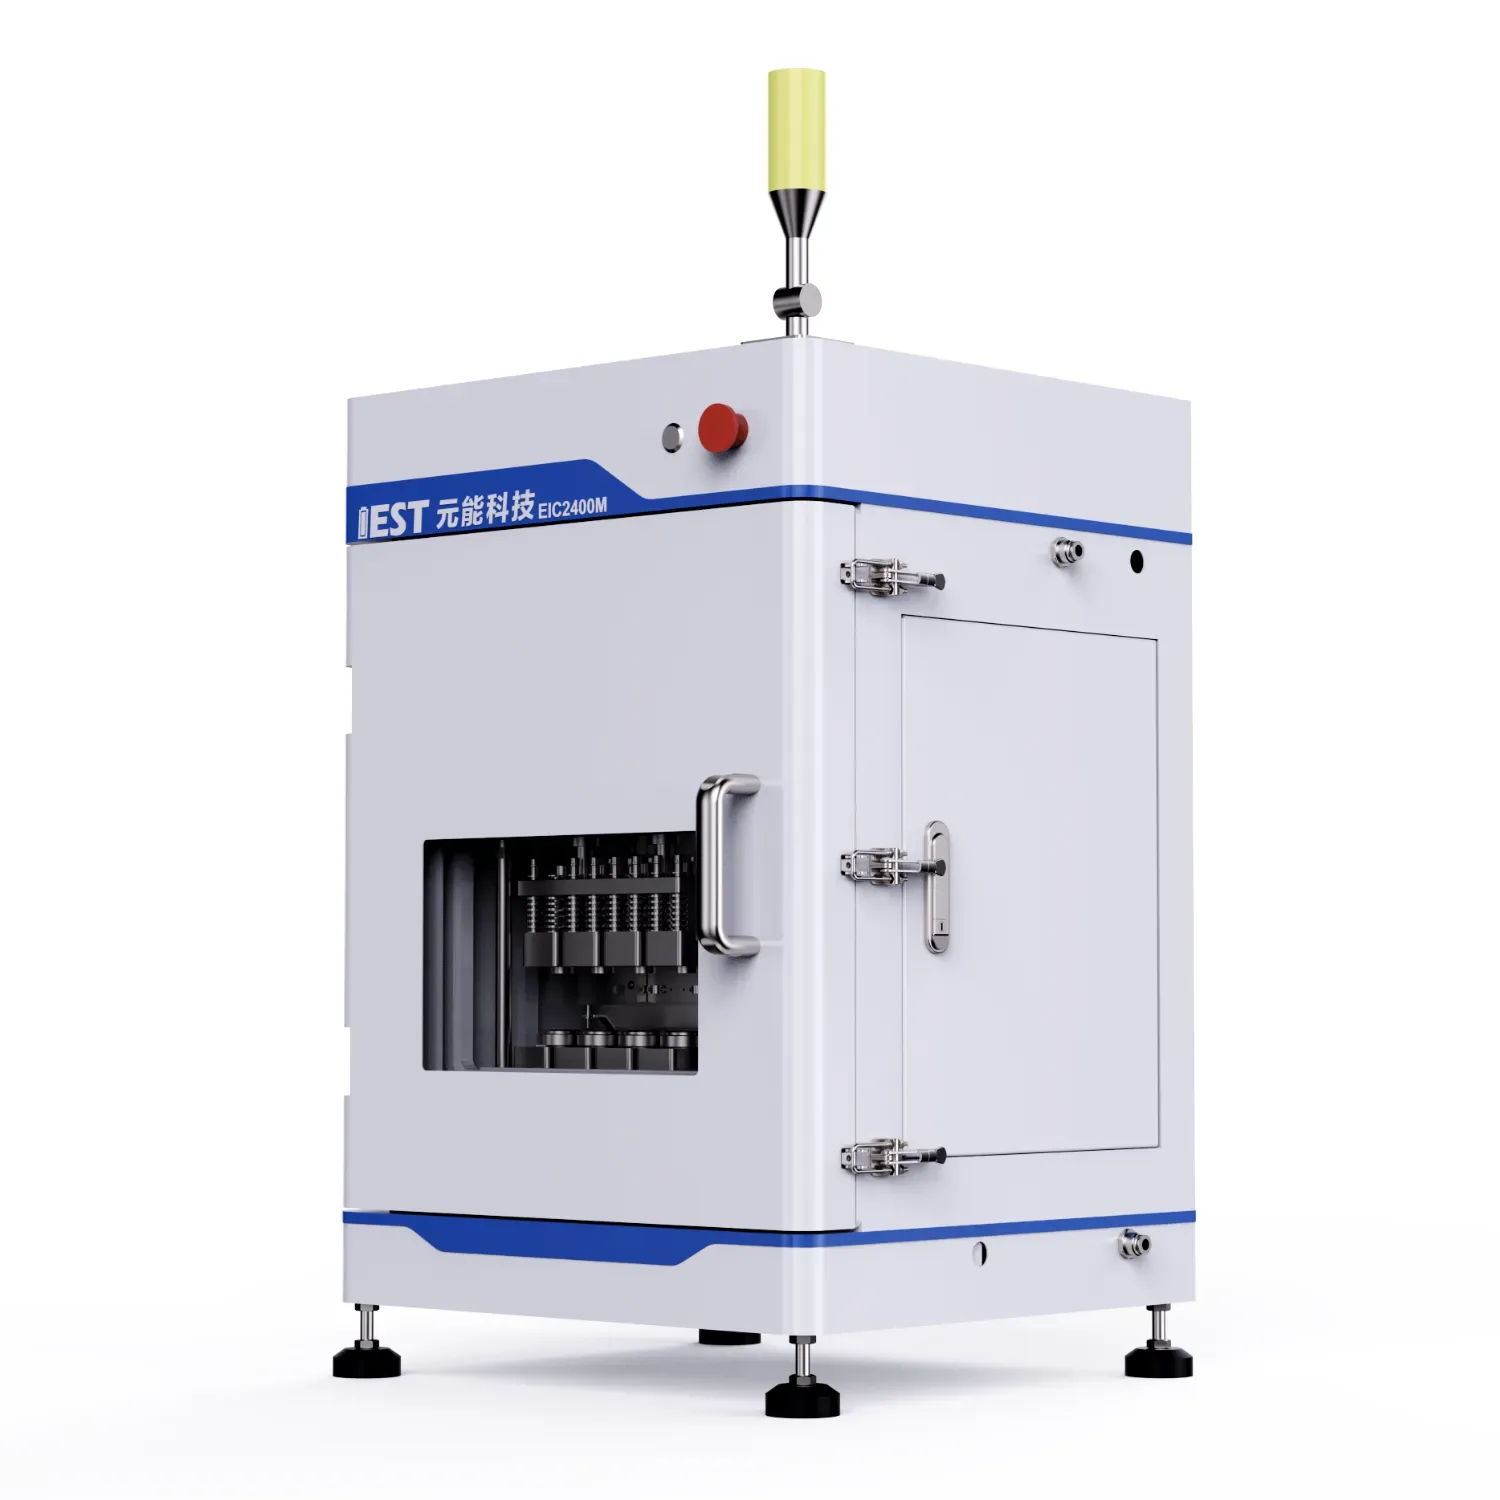
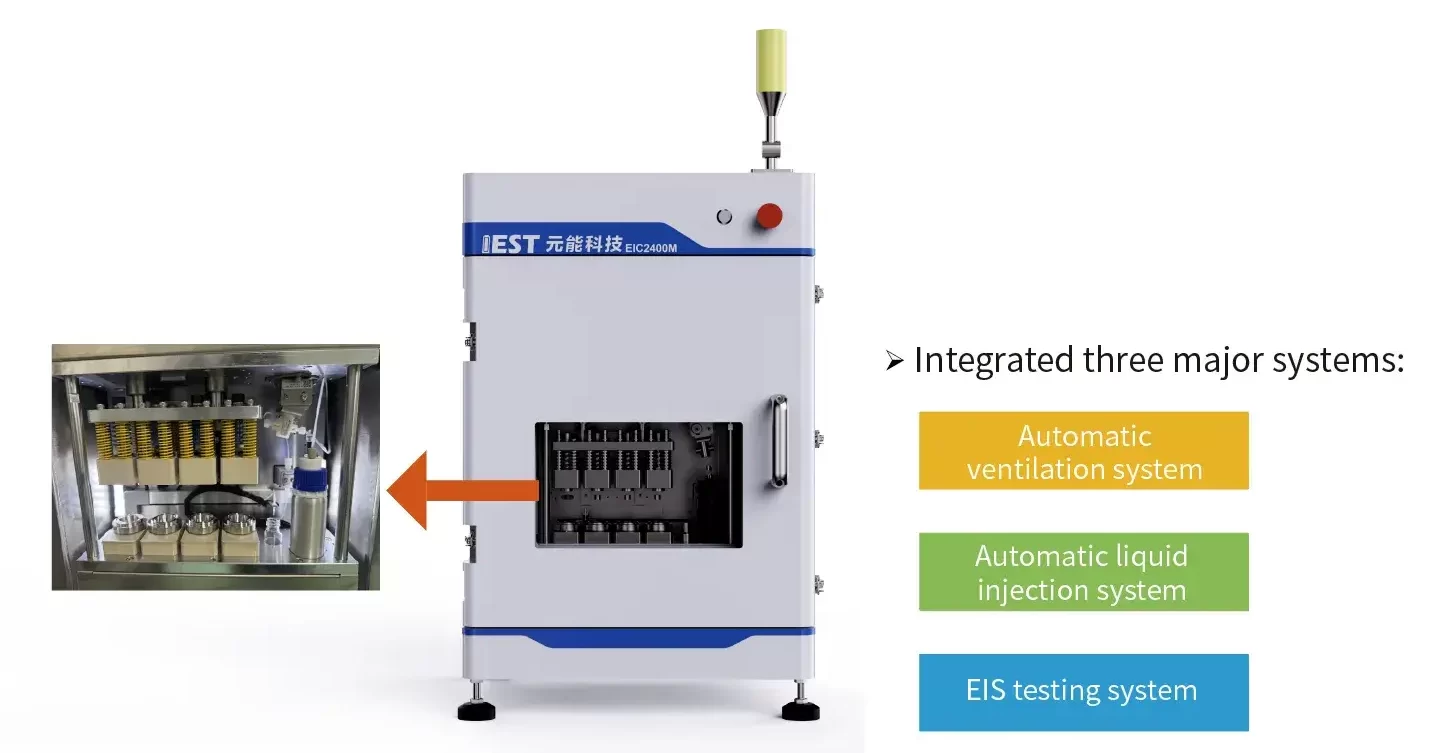
- Calculate electrode tortuosity measurement from electrochemical impedance spectroscopy (EIS) of symmetric cells.
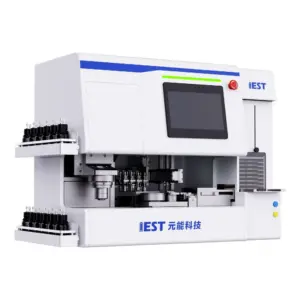
- Streamlined cell assembly, automated testing and analysis, simplified operation workflow, enhanced testing throughput.
- Four-channel synchronous measurement
3.2. Creative Solution Two
4. Applicathions
Cathodes with Different Compaction Densities
- Tortuosity evaluation of positive electrodes under varying compaction densities.
Anodes with Different Compaction Densities
- Tortuosity evaluation of negative electrodes under varying compaction densities.
Different Electrolytes & Rate Performance
- Analysis of electrolyte transport capabilities and rate performance correlation.
Tortuosity & Wetting Correlation
- Characterization of the relationship between electrode tortuosity and electrolyte wettability.
Separators with Different Coatings
- Ionic conductivity and transport property evaluation for various coated separators.
Separator Repeatability Experiments
- Validation and testing of measurement repeatability and consistency for separators.
Applications
Case 1. Different compaction density of cathode electrodes(NCM)
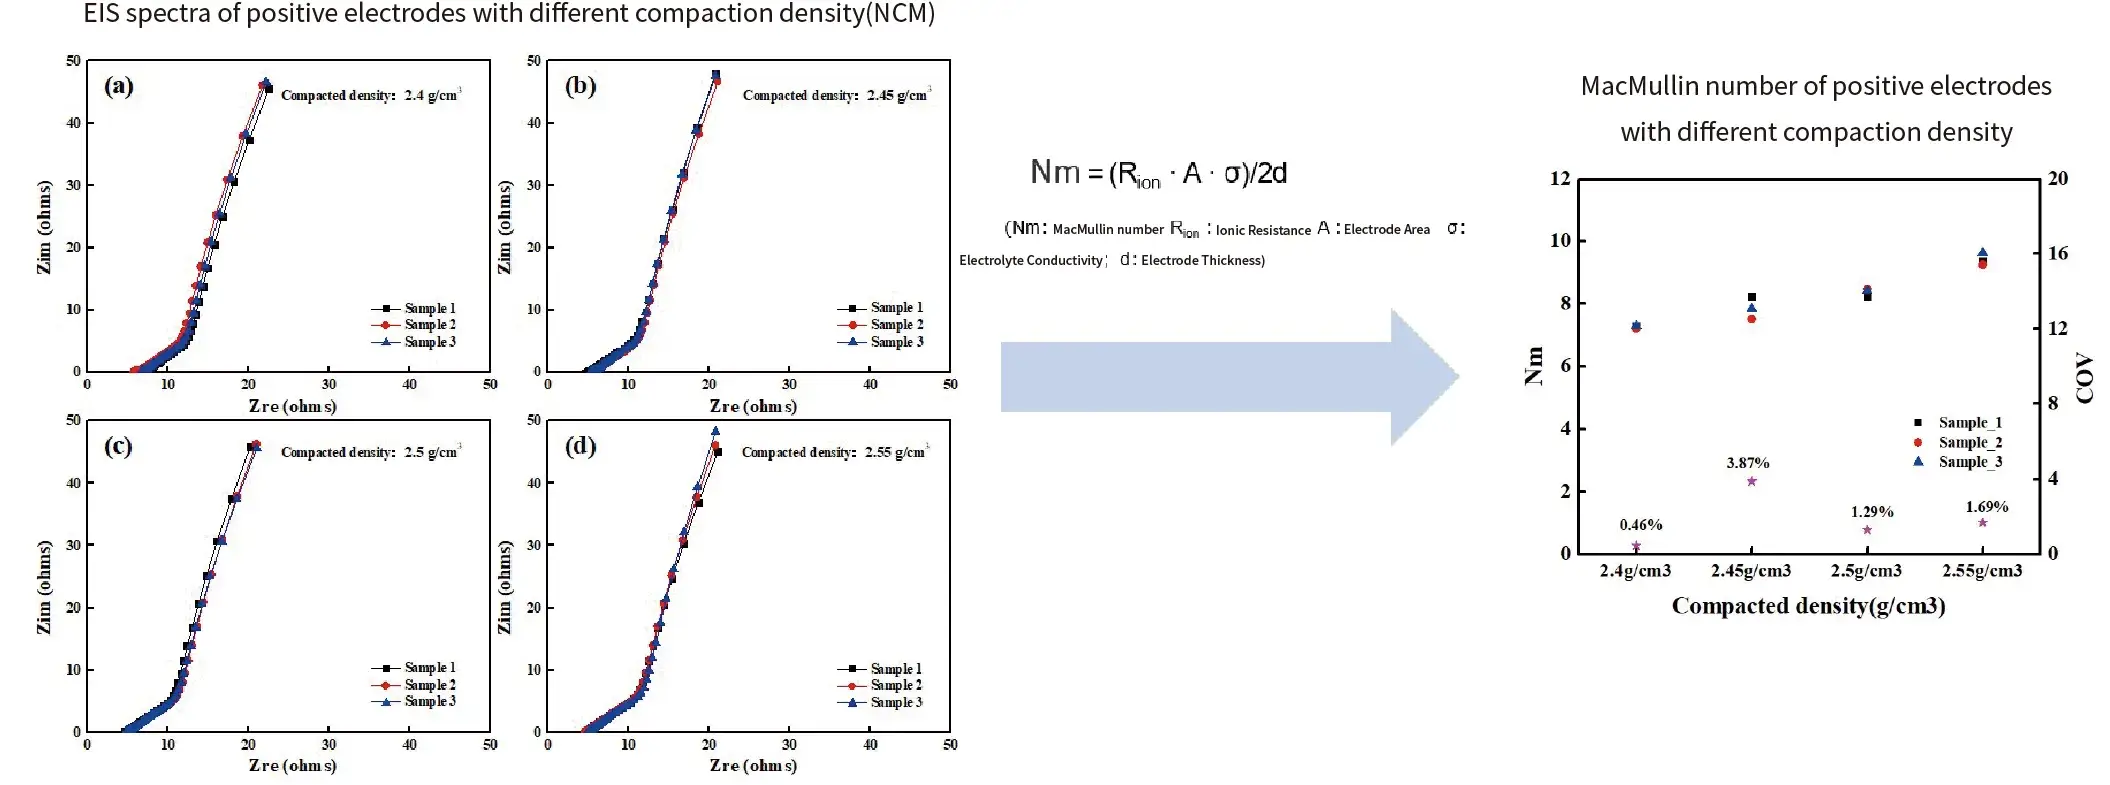
- The consistency of ElS testing for symmetric battery of electrodes is generally good.
- Within a certain range of compaction density, as the compaction increases, the ionic resistance/MacMullin number also increases.
Case 2. Different compaction density of anode electrodes(Gr)
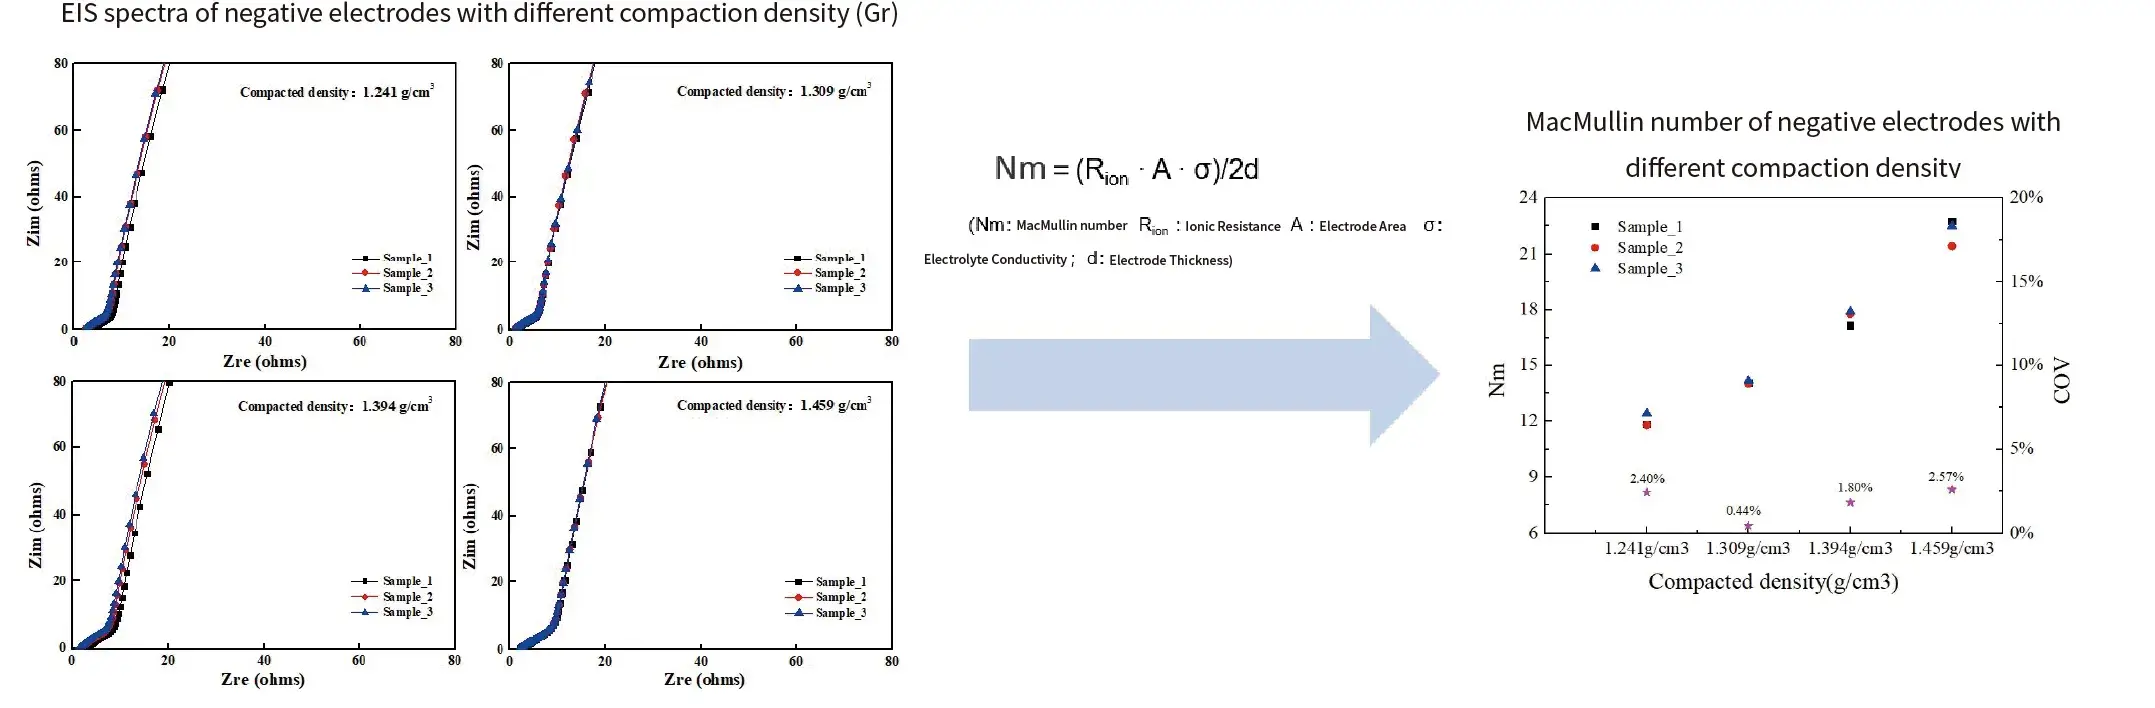
- The consistency of ElS testing for symmetric battery of electrodes is generally good.
- Within a certain range of compaction density, as the compaction increases, the ionic resistance/MacMullin number also increases.
Case 3. The correlation between electrode tortuosity and electrochemical performance(Gr anode electrodes of different thicknesses)
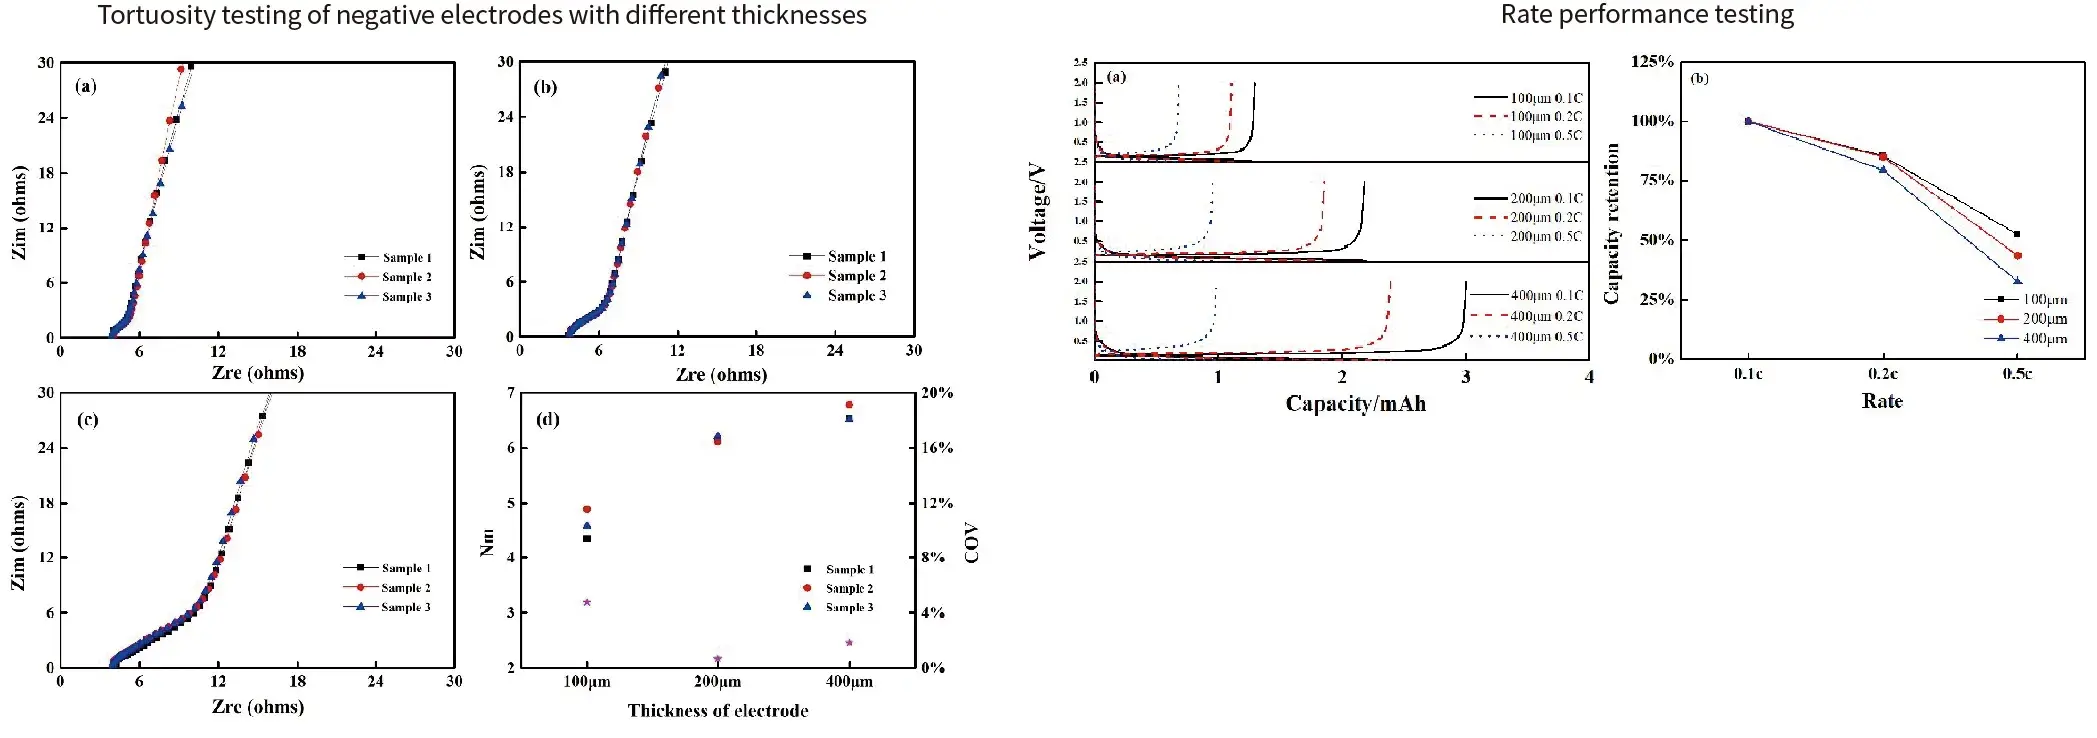
- As the thickness of the electrode increases, its tortuosity also increases, However, the rate performance of the battery decreases with increasing thickness.
- This indicates that the rate performance of the battery decreases with increasing tortuosity. There is a certain correlation between electrode tortuosity and rate performance of battery.
Case 4. Ionic Conductivity Comparison of Separators with Four Different Coatings
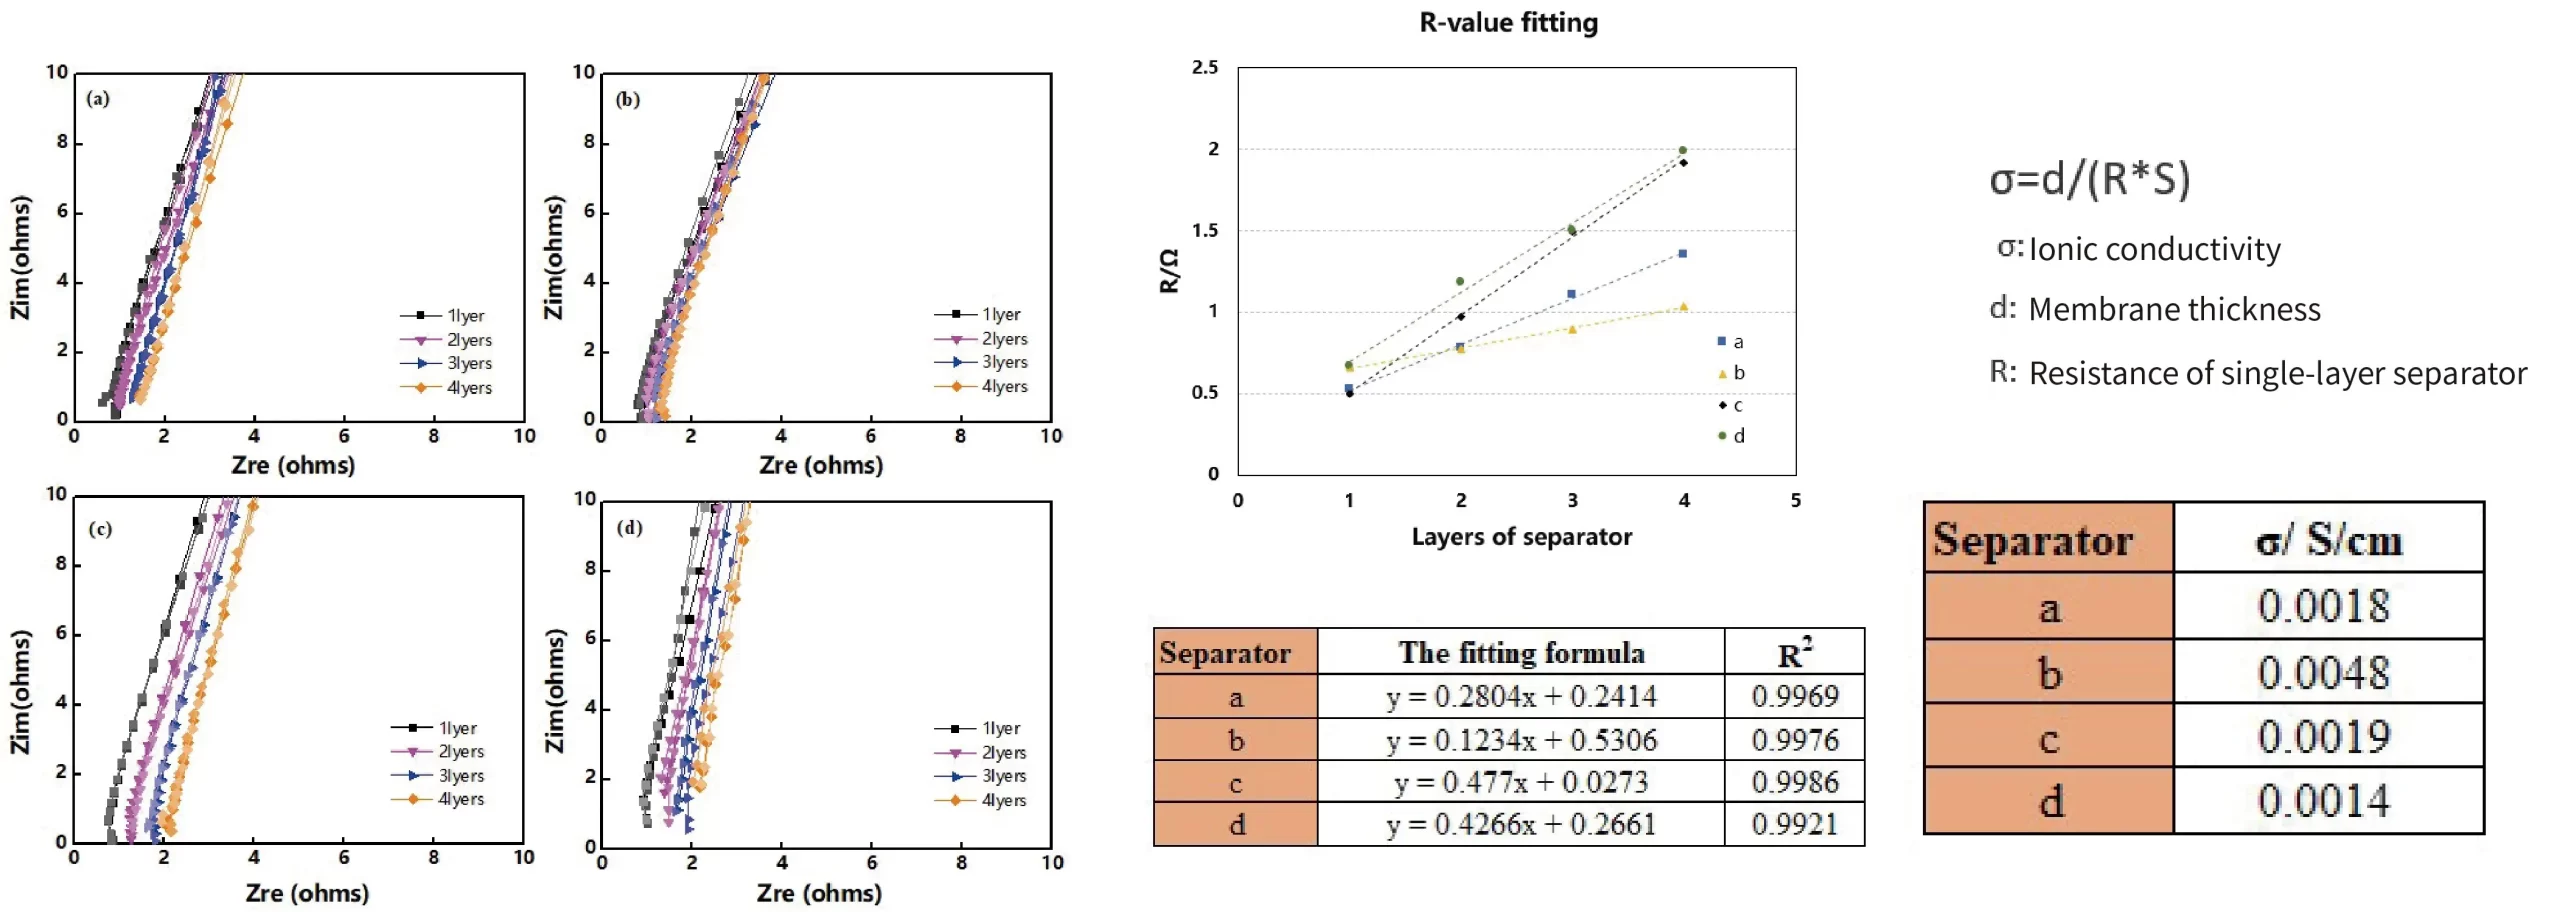
- Test the EIS of 1–4 separator layers to obtain $R_1, R_2, R_3, R_4$.
- Plot a curve with the number of separator layers as the x-axis and separator resistance as the y-axis. Calculate the slope and linear fitting degree of the curve, with the linear fitting degree ≥0.99.
- Calculate the separator ionic conductivity according to the formula, which shows clear differentiation among different separators.
Case 5. Correlation Between Electrode Tortuosity and Electrochemical Performance in Different Electrolytes
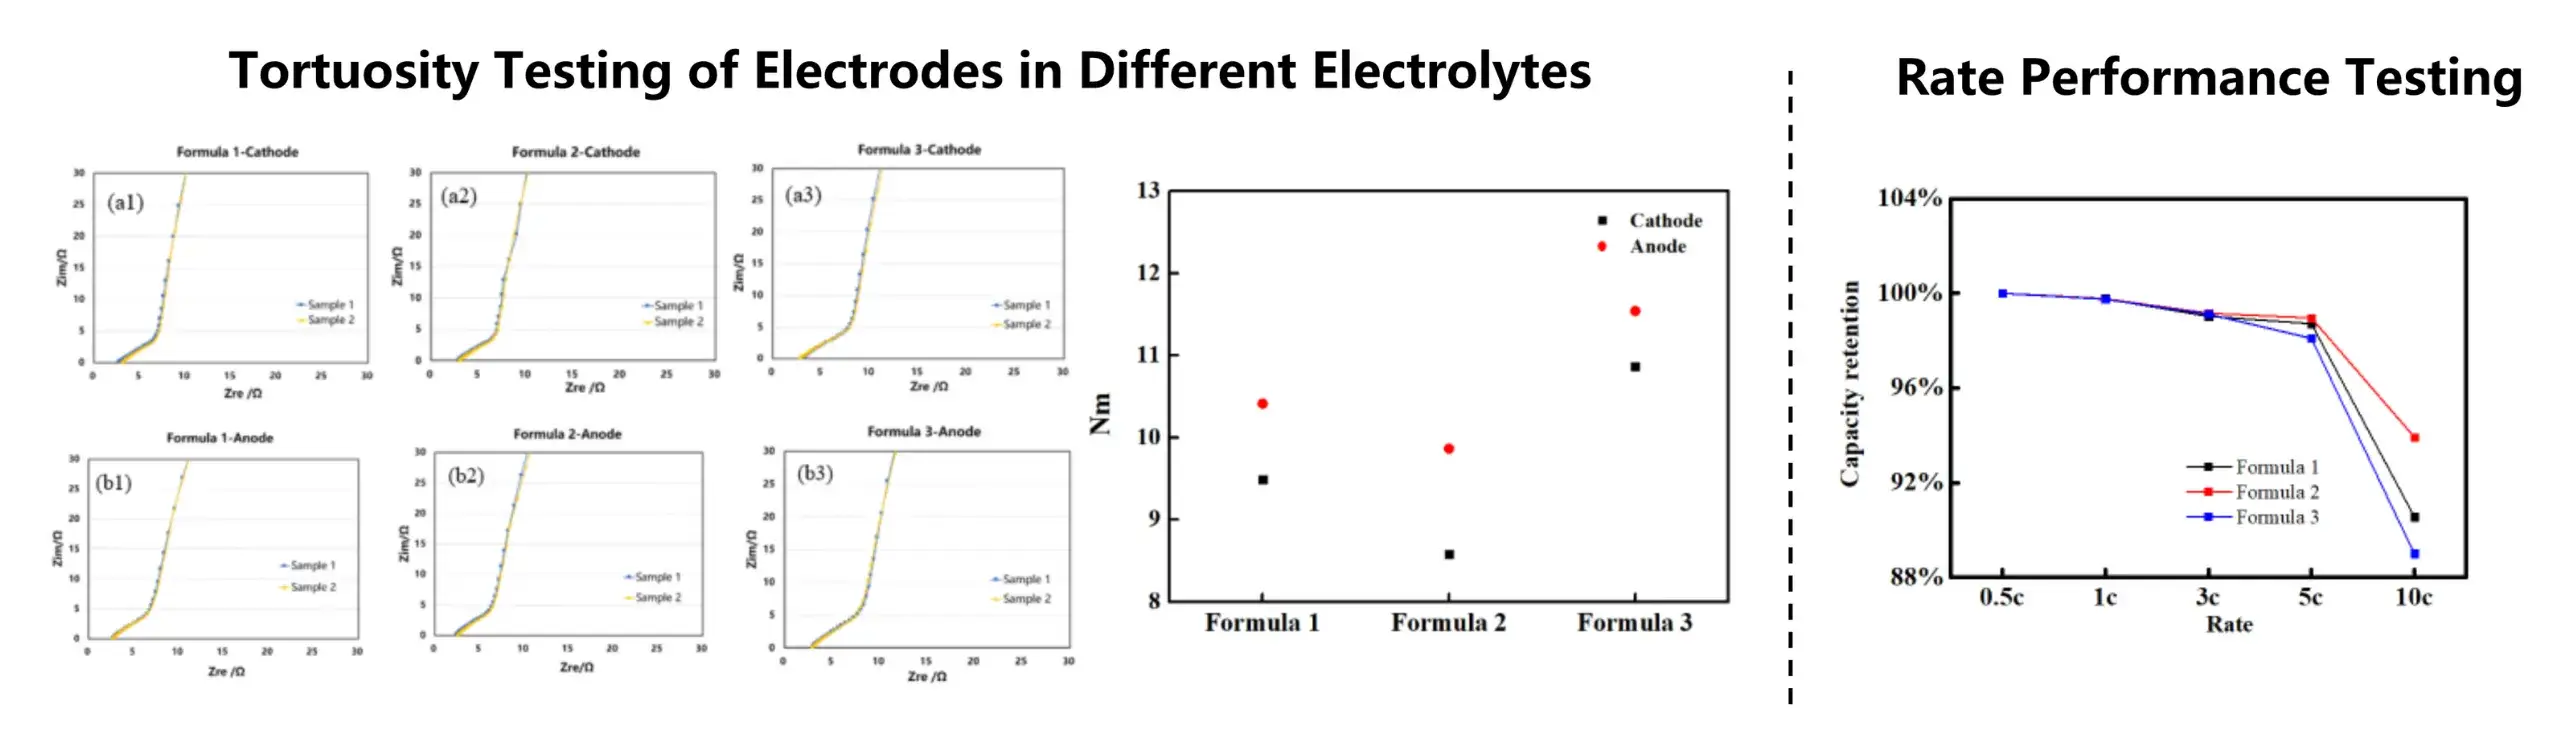
- The MacMullin number of both the cathode and anode electrodes in the electrolyte follows the order: Formulation 2 < Formulation 1 < Formulation 3.
- At a 10C rate, the capacity retention of Formulation 1 is 90.55%, Formulation 2 is 93.92%, and Formulation 3 is 89%.
- Combined with the MacMullin number data, it can be concluded that the ease of lithium-ion migration within the coating is influenced by the electrolyte formulation. A higher MacMullin number corresponds to poorer battery rate performance, indicating consistency between the electrochemical test results and tortuosity measurements.
Case 6. Tortuosity & Wettability of LFP Cathodes with Different Compaction Densities(Compaction Density: a<b<c)
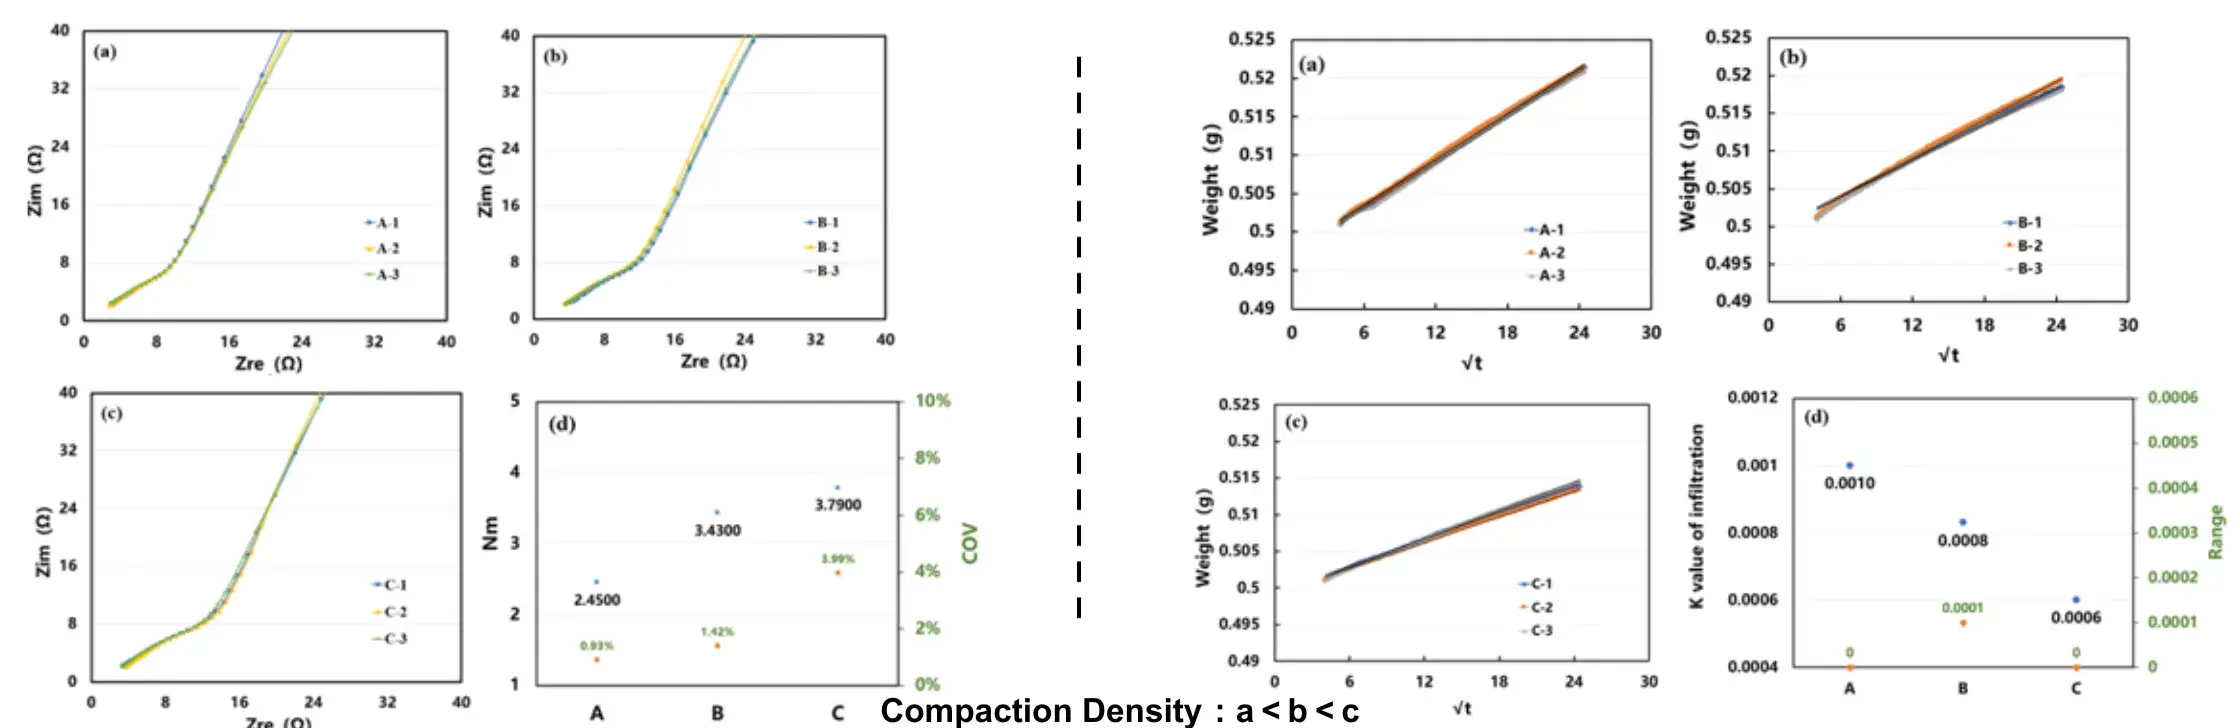
- The experimental results show that the poorer the wetting performance of the electrode, the higher its tortuosity.
- This indicates that as compaction density increases, electrolyte absorption performance deteriorates, making wetting more difficult. This hinders lithium-ion migration and increases ion transport resistance, thereby leading to an increase in electrode tortuosity.
Video
Specifications
| Model | EIC2400M | EIC2400M-T |
|---|---|---|
| Number of Channels | 4 | |
| Atmosphere | Automatic gas purge to ensure high-purity Ar atmosphere in the chamber | |
| Temperature Control | / | -20 to 80°C |
| EIS Test Range | 100 kHz – 0.01 Hz | |
| Force Range | 10 – 50 kg | |
| Pressure Range | 0.5 – 2.5 MPa (16 mm indenter) | |
| Applicable Samples | Cathode/Anode electrodes (18 mm disc), Separator (26 mm disc) | |
| Mold Dimensions | Φ 45 × 20.5 mm (W×H) | |
| Test Parameters | Gas pressure, dew point, ionic conductivity, MacMullin number, etc. | |
| Features | • Automatic gas purge to ensure high-purity Ar atmosphere in the chamber; • Automatic electrolyte injection; • Multi-channel rapid assembly of symmetric cells and EIS spectrum testing; • EIS curve fitting to obtain ionic conductivity, MacMullin number, and other parameters; |
• Automatic gas purge to ensure high-purity Ar atmosphere in the chamber; • Independent temperature control for each channel; • Automatic electrolyte injection; • Multi-channel rapid assembly of symmetric cells and EIS spectrum testing; • EIS curve fitting to obtain ionic conductivity, MacMullin number, and other parameters; |
| Specifications | Equipment Dimensions (W×D×H): 590 mm × 590 mm × 1100 mm Equipment Weight: 160 kg Equipment Power: 1250 W |
Equipment Dimensions (W×D×H): 722 mm × 589 mm × 1193 mm Equipment Weight: 180 kg Equipment Power: 1540 W |
Download
IEST Electrode Tortuosity & Separator Ion Conductivity Tester