-
iestinstrument
Effect of Different Expansion Linear Mode On Cell Performance
1. Preface
The in-situ swelling analyzer (SWE) launched by IEST has constant pressure and constant gap test modes, which can monitor the thickness evolution of the cell under constant pressure or monitor the change of pressure under a limited constant displacement gap. These two modes can effectively detect the swelling process of the battery, but do not consider the deformation of the structure itself in the actual application scenario. Therefore, in terms of quickly simulating the influence of different confinement degrees on the performance of the battery, IEST in-situ swelling analyzer (SWE) has introduced a new control mode (Expansion Linear Mode): By adjusting the linearity K value (pressure to thickness ratio) size , to realize the simulation of the constraints of different stiffness boundaries on the cell, and at the same time monitor the pressure, thickness, electrical properties and other parameters in situ.
During the charging and discharging process of lithium-ion batteries, the anode and cathode materials continue to deintercalate lithium, resulting in particle volume changes, accompanied by changes in the thickness of the battery cells, at the same time, with the aging of the battery cell, the thickness of the battery cell will also increase along with the thickening of the SEI film, gas production and lithium deposition. If the battery cell is confined in a fixed space (practical application scenario), a certain force (swelling force) will be generated on the outer wall of the space, and this swelling force will affect the cycle performance and safety of the battery cell. Generally, the components that limit the space of the battery cells have a certain degree of rigidity, and they will also undergo certain deformations, such as the shell of the battery pack or the fasteners of the module. Take the spring as an example to illustrate the concept of stiffness. The stiffness K of the spring is defined as the ratio of the spring force F to its deformation δ, that is, K=F/δ. It is generally considered that the stiffness k is a constant, assuming that the battery pack shell is a metal plate and the battery is limited in a fixed space. The thickness of the metal plate is H, the modulus of elasticity is E and the area of the metal plate is A. If the required force is F under deformation δ, then:
Metal plate strain is: ε=δ/H.
Metal plate stress is: σ=Eε=Eδ/H.
The force applied on the metal plate is: F = Aσ = AEδ / H.
Then, the rigidity of the metal plate is: K=F/δ=AE/H.
Therefore, the magnitude of the stiffness depends on the geometry of the part or structural member (such as the thickness H and area A of the metal plate) and the type of material (ie the elastic modulus E of the material).
In this paper, two different K values and constant gap mode experiments were selected and the differences in the impact on battery life between the three were compared and analyzed.
2. Testing Information
2.1 Testing Equipment
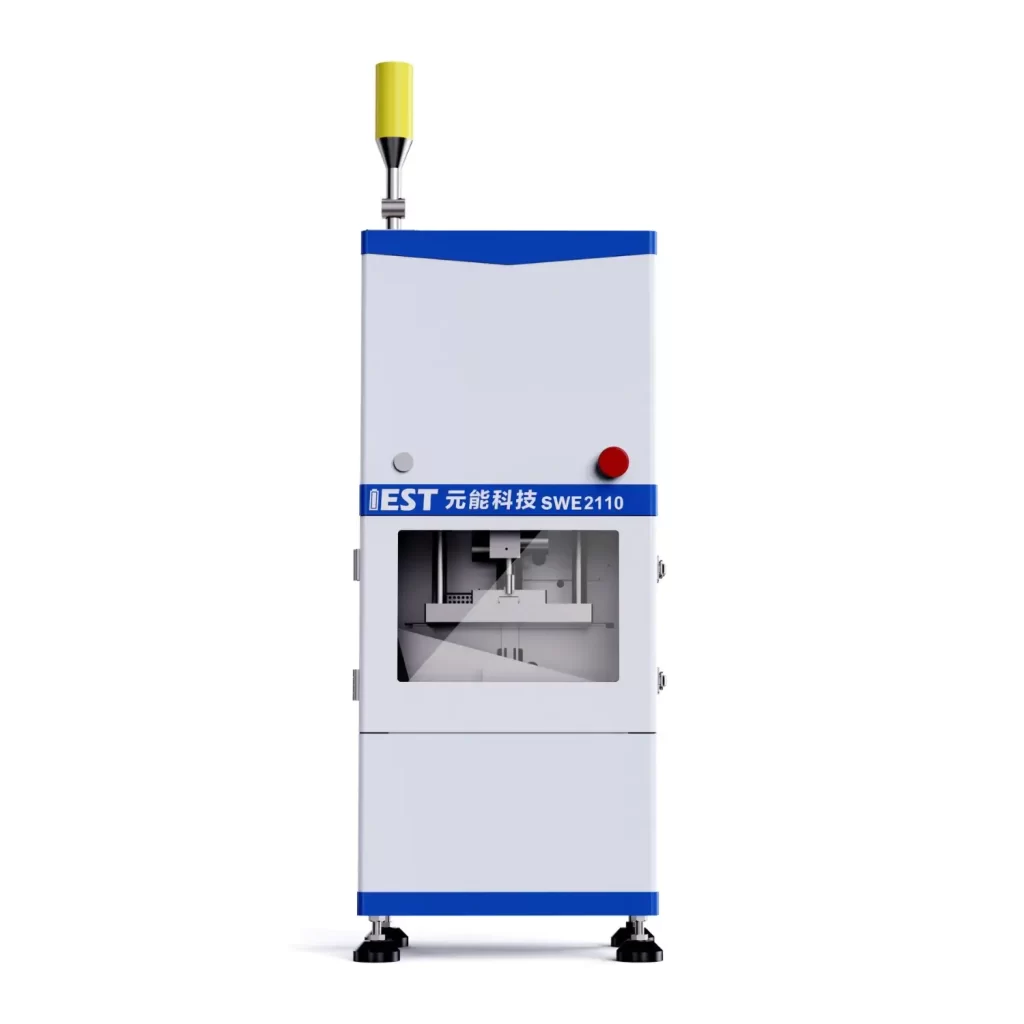
In-situ swelling analyzer, model SWE2110 (IEST), can apply a pressure range of 50~10000N, and can control the temperature from -20℃~80℃. Figure 1 shows the appearance of the device.
Figure 1. Schematic diagram of the in-situ swelling analyzer
2.2 Testing Parameters
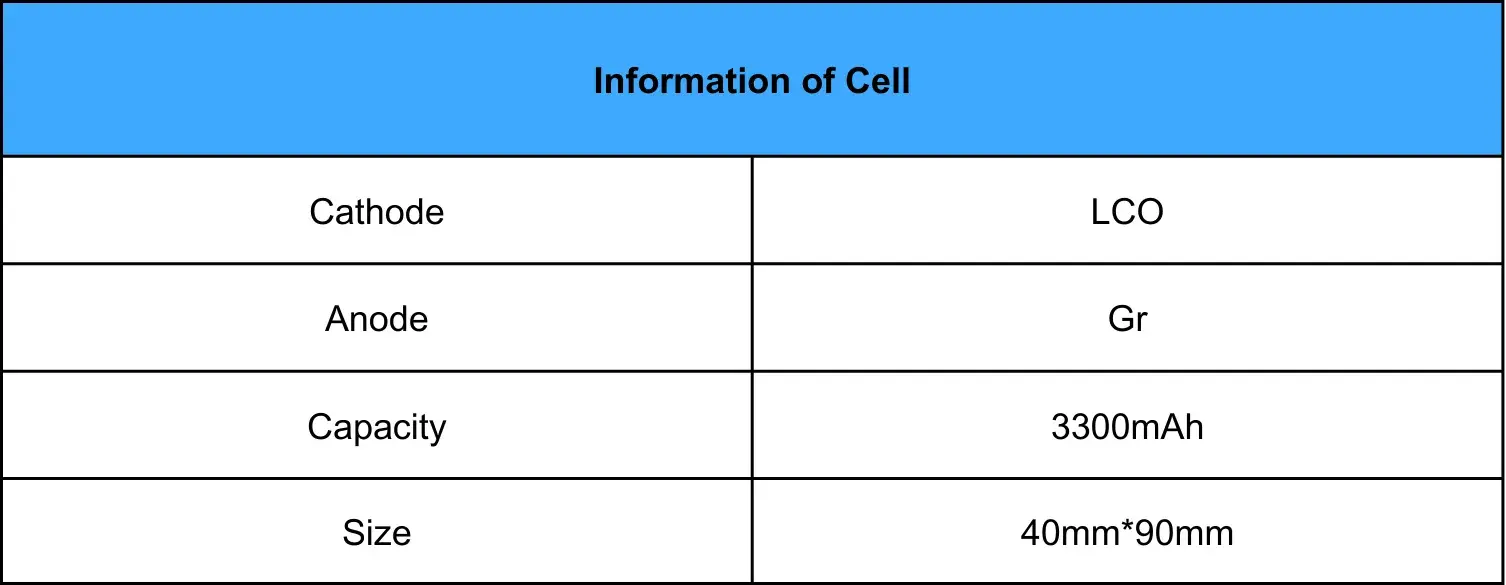
2.2.1 Battery Information is Shown in Table 1
Table 1. Battery Cell Information
2.2.2 Charge and discharge process
10 min at 25°C; charge at 1.0C to 4.2V, continue charging at constant voltage after reaching the cut-off voltage, cut-off current 0.05C; put aside for 10 min, discharge at 1.0C, cut-off voltage 3.0V, and start the in-situ swelling analyzer simultaneously , the software automatically reads data such as cell swelling thickness, expansion force, current, voltage, and capacity.
2.2.3 Expansion Linear Mode Description
K value is in kg/mm, and the setting values in this experiment are 500kg/mm and 2000kg/mm, so as to simulate the swelling process of the battery in the scene of battery space-limited structural parts with different geometric shapes and elastic moduli; K value Regulation is only enabled during the charging and discharging process of the battery. The constant pressure mode or constant gap mode can be set during the battery core storage process. In this experiment, the starting threshold of the expansion linear mode is that the thickness change is greater than 3 μm and the pressure change is greater than 0.5 kg, and the constant gap mode is set during the battery cell shelving process.
3. Results Analysis
Select three parallel cells, start the in-situ swelling analysis system(SWE Series), select the corresponding test mode (constant gap, expansion linear mode) experiment, set the initial preload force 100kg, and test the thickness, pressure and electrical performance parameters in real time synchronously, the experiment was stopped when it reached 80% of the initial capacity. As shown in Figure 2: The swelling space of the battery is limited in the constant gap mode, and the gap is controlled within the range of ±1 μm and the swelling force increases continuously with the cycle; The expansion linear mode simulates the presence of a certain stiffness in the structural parts that limit the battery space (such as different Thickness and material metal plate), the swelling force and swelling thickness change in real time during the cycle process, which is closer to the actual application scene. Also, as the coefficient of linear swelling (K value) changes, the swelling force and swelling thickness exhibit different amounts of change. When K=2000, it means that the rigidity of the structural part is large, that is, the elastic modulus is large under the same geometry, and the deformation of the structural part itself is smaller, so the pressure is higher when the battery expands. When K=500, it means that the rigidity of the structural part is smaller, that is, the elastic modulus is small, and the deformation of the structural part itself is larger. Therefore, when the battery expands, the thickness change will be greater, and the pressure will be smaller. At the same time, it was found that different K values had different responses to equipment control. From the overall stability point of view, when the K value is 2000, the stability is relatively poor, so the current K value is recommended to be set within the range of 500~1000kg/mm.
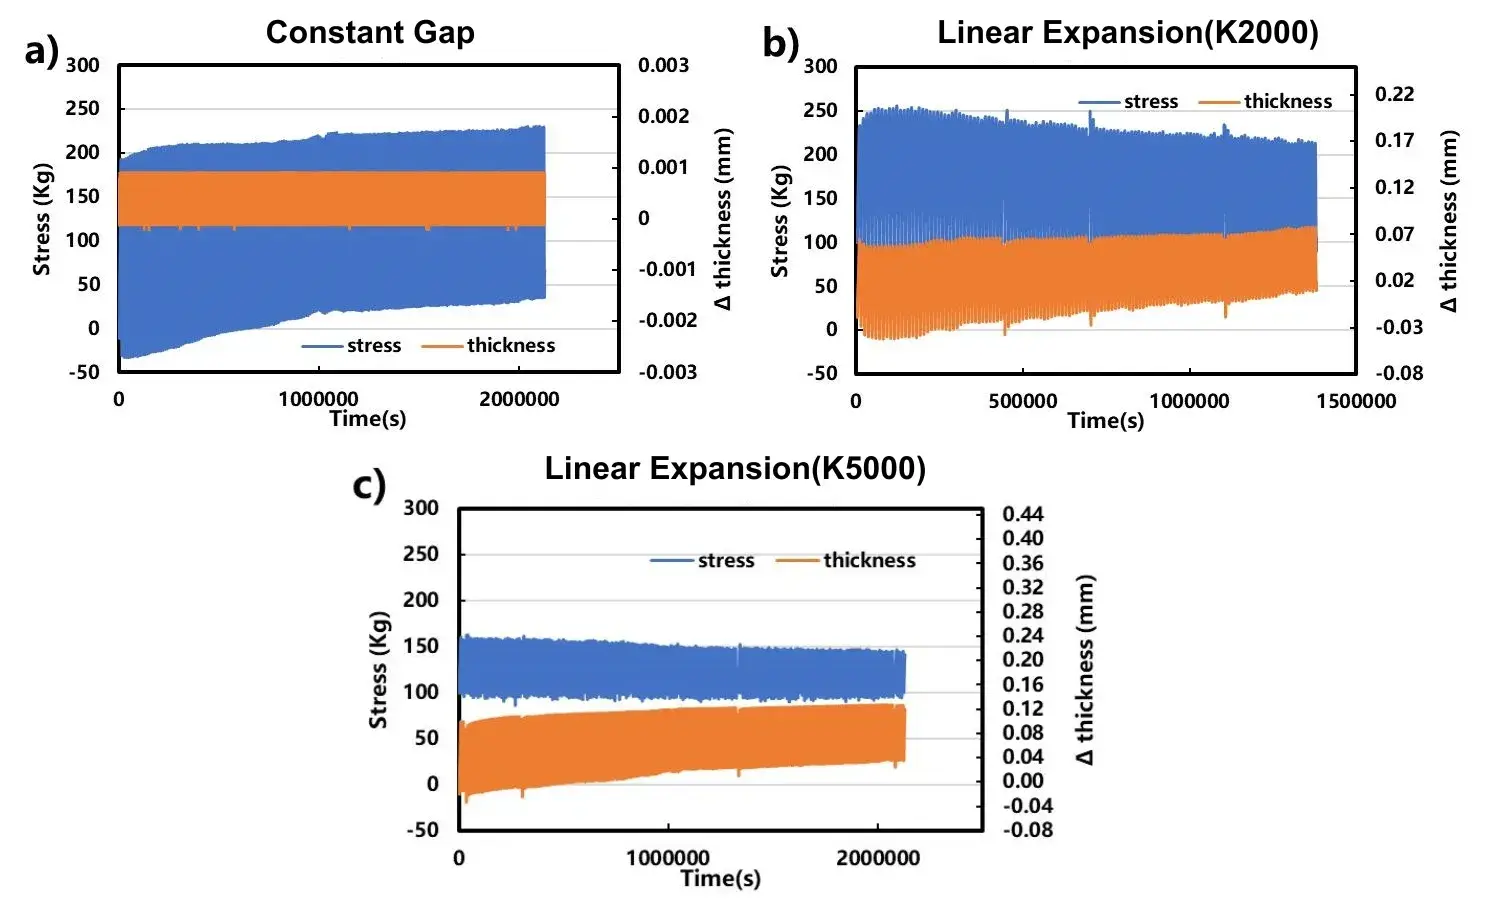
Figure 2. Pressure & thickness variation trend of two test modes
Expansion Linear mode (K500) selects the first 5 cycles, and analyzes the relationship between voltage, pressure, thickness and K value over time, as shown in Figure 3: As the charge and discharge progress, the pressure and thickness of the cell show periodic changes, and the pressure and thickness are linear. This shows that it is possible to simulate the swelling and contraction process of the battery in the actual scene of the constrained structural member with K=500 stiffness value.
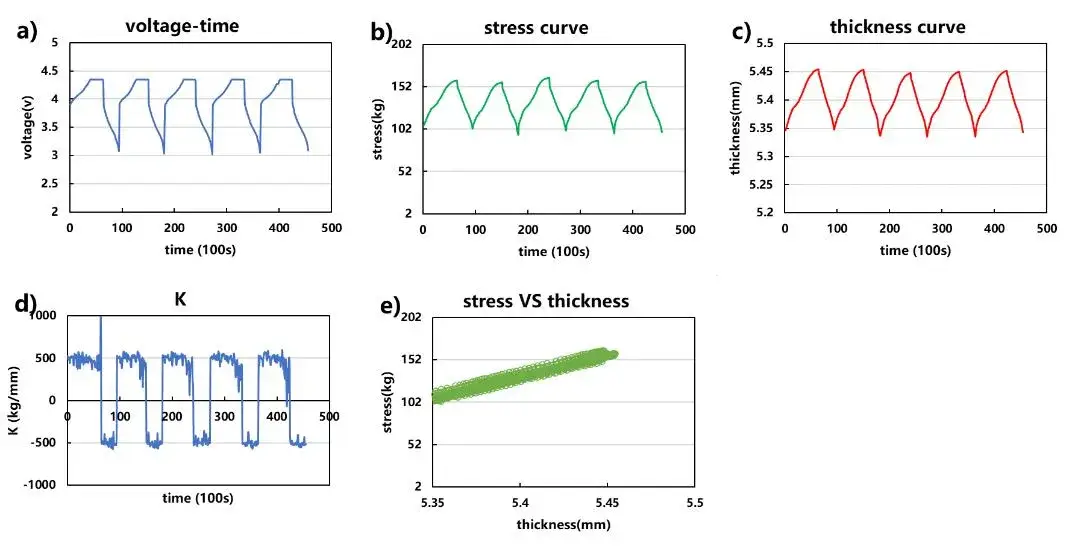
Figure 3. Change curves of voltage, pressure, thickness, and K value (first 5 cycles)
If the cell swelling thickness and swelling force are associated with the capacity retention rate, the maximum pressure and thickness changes during each cycle are extracted, as shown in Figure 4 (the solid line capacity retention rate, the dotted line is the pressure and thickness): As the cell ages, the maximum swelling force of the cell in the expansion linear mode shows a decreasing trend as a whole and the maximum swelling thickness tends to increase; The swelling force of the cell in the constant gap mode shows an increasing trend and the swelling force value is the largest among the three modes . An increase in the external pressure of the cell will increase the relative density and contact area between the active material and the diaphragm and will also reduce the interface resistance and some side reactions at the interface. At the same time, the parameters of the electrode such as the pore size and porosity of the electrode will also be changed to affect the ion transmission capacity of the cell during charging and discharging. In the expansion linear mode (K500) and the constant gap mode, the capacity retention curve has an “inflection point”, and this part of the mechanism needs further analysis and verification to correlate with the external pressure.

Figure 4. (a) Capacity retention & maximum swelling force curve (b) Capacity retention & maximum swelling thickness variation curve
If we further analyze the first turn (BOL) cycle and the last turn (EOL) cycle of each mode, as shown in Figure 5: The maximum swelling force of EOL in expansion linear mode is smaller than that of BOL, but the opposite is true for constant clearance, which shows that different control methods have a great influence on the maximum swelling force. In addition, the difference between the maximum swelling thickness of EOL and the initial thickness of BOL can also be compared, so as to correlate with the selection of the thickness of the cushioning cotton in the module PACK to ensure that the module has appropriate mechanical strength throughout the life cycle.
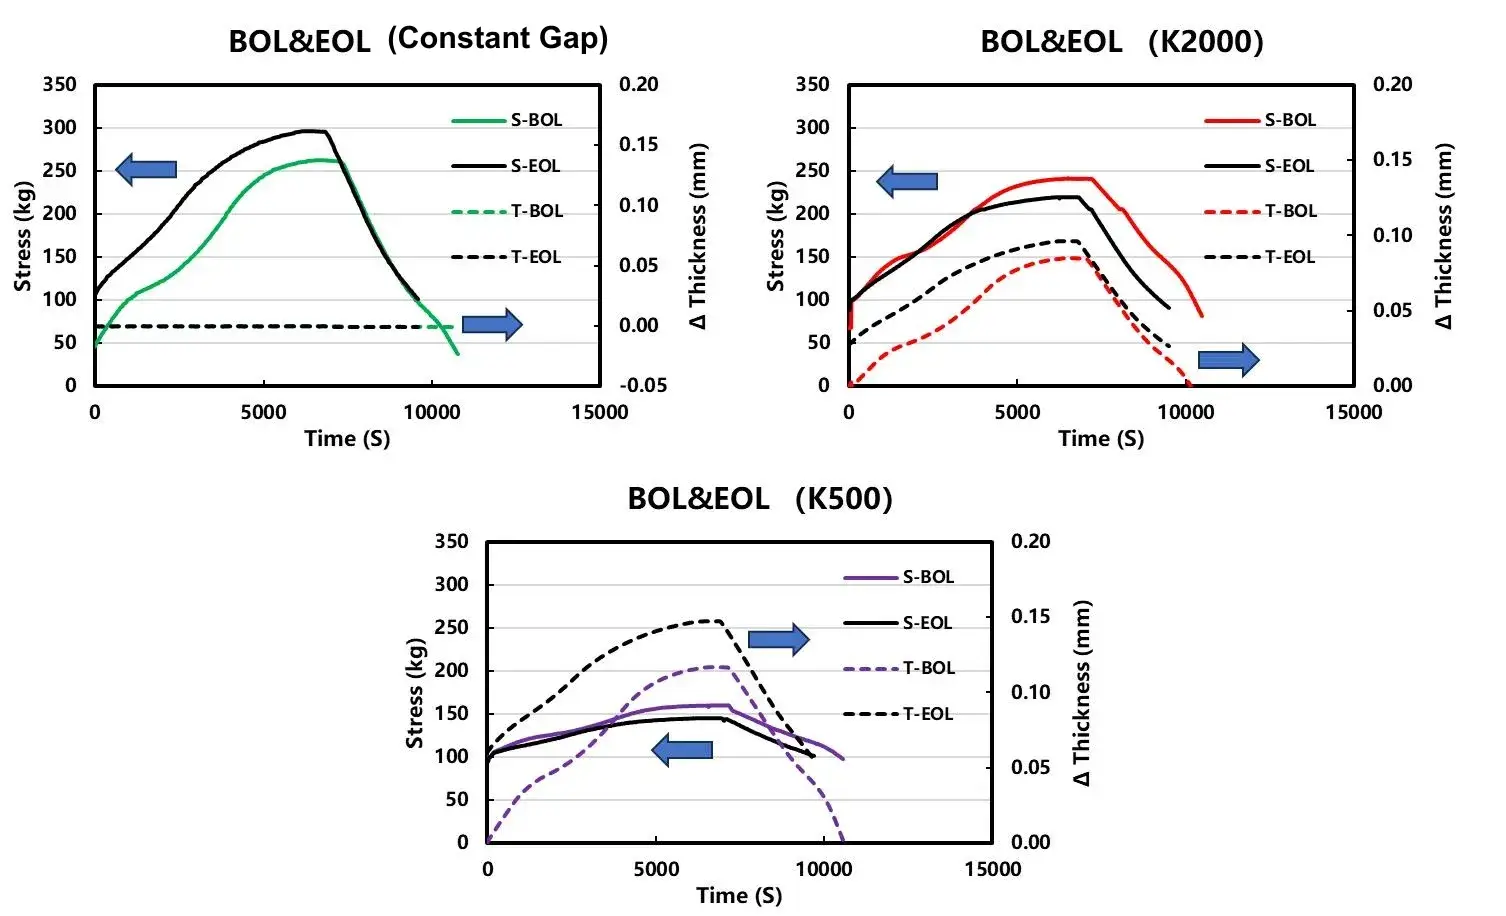
Figure 5. Three modes of BOL and EOL cell swelling force & swelling thickness curves (solid line is thickness, dotted line is pressure)
4. Summary
In this paper, the expansion linear mode of the in-situ swelling analyzer (SWE2110) is used to simulate the binding of materials with different stiffness to the cell and to monitor the changes in swelling thickness and swelling force throughout the life cycle, make the experimental results closer to the real working conditions and help designers to design more appropriate solutions.
5. References
[1] Liang Haobin, Du Jianhua, Hao Xin, et al. A review of current research on the formation mechanism of lithium batteries [J]. Energy Storage Science and Technology, 2021.DOI:10.19799/j.cnki.2095-4239.2020.0358.
[2] Wuensch M, Kaufman J , Sauer D U. Investigation of the influence of different bracing of automotive pouch cells on cyclic lifetime and impedance spectrum[J].The Journal of Energy Storage, 2018, 21(FEB.):149-155 .DOI: 10.1016/j.est.2018.11.019.
[3] Zhang Jun, Zeng Yunlu, Zou Shunzhang, et al. Research on Expansion and Life of Soft Pack Lithium Batteries under Appropriate Pressure [J]. Power Supply Technology, 2019, 43(10):4.DOI:CNKI:SUN:DYJS .0.2019-10-020.
Updated on Jan. 15, 2025
Subscribe Us
Contact Us
If you are interested in our products and want to know more details, please leave a message here, we will reply you as soon as we can.


