

The calendering process is a critical step in lithium-ion battery electrode manufacturing. By applying pressure between rollers—through predefined gap or force control—at optimal speed and temperature, this step ensures electrodes achieve their target compaction density. Calendering aims to increase volumetric capacity, improve electronic conductivity, and enhance overall electrochemical performance, making precise calendering pressure control essential for both cell energy density and cycle life.
In 2022, Zhang et al.[1] conducted a systematic micro- and macro-scale study of electrode calendering by combining Discrete Element Method (DEM) simulation with experimental trials. Their work, supplemented by the Heckel equation for compression modeling, confirmed that electrode deformation involves particle crushing, secondary particle fusion, binder network compression, and current collector surface deformation. The study also established that improved electronic conductivity after calendering stems from two simultaneous effects: enhanced internal conductive pathways between active material particles and improved tightness of contact between the coating and the current collector surface.
Building on this foundational research, we used an IEST BER2500 electrode resistance analyzer to test the conductive properties of graphite anode electrodes calendered at four different pressures (yielding four different compaction densities). Simultaneously, the instrument’s compression fixture was used to analyze mechanical compression behavior. This combined approach enables rapid, quantitative evaluation of how calendering pressure affects both the electrical and mechanical state of the electrode sheet — without requiring full cell fabrication.

Figure 1. Schematic force-displacement curve of an electrode sheet during calendering — green: experimental results; gray: DEM simulation results. Shows progressive stages of particle rearrangement, elastic deformation, plastic deformation, and fracture[1]
Tests were conducted using the IEST BER2500 Electrode Resistance Analyzer (Figure 2). This instrument applies pressures from 5 to 60 MPa on a 14 mm diameter electrode sample, simultaneously measuring resistance, resistivity, conductivity, and electrode thickness — enabling combined electrode compression testing and resistivity characterization in a single instrument run.
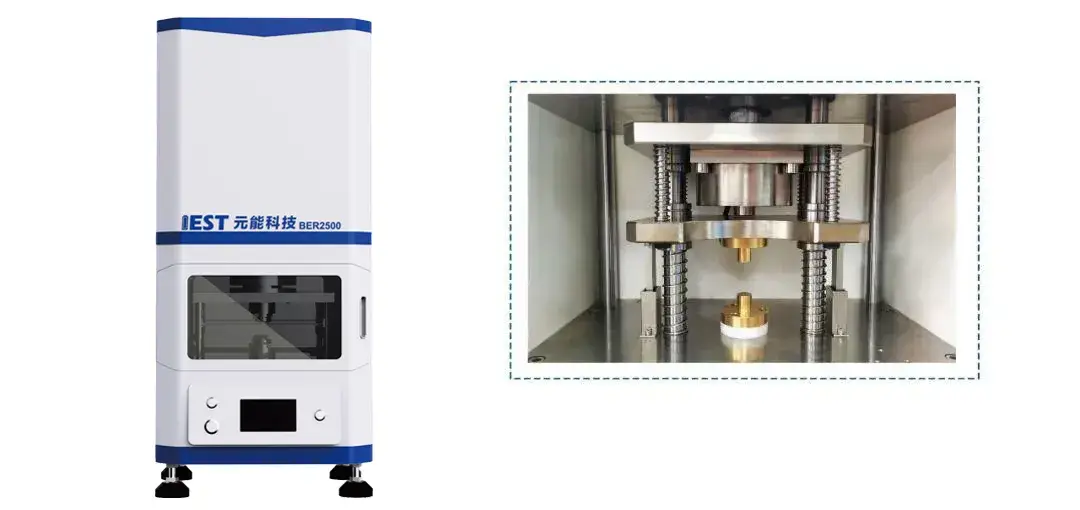
Figure 2. (a) BER2500 appearance; (b) BER2500 structural diagram — 14 mm probe, 5–60 MPa, simultaneous resistance and electrode compression measurement
Four graphite anode electrode sheets were prepared with the same slurry formulation but calendered at increasing pressures, yielding four compaction density levels:
Compaction density was calculated by the cutting-thickness-weighing method. Higher calendering pressure consistently yielded higher compaction density, as expected from the fundamental powder compression mechanism.
The BER2500 steady-state test mode was used with the following parameters: pressure range 5–60 MPa, 5 MPa steps, 15 s hold at each step, followed by stepwise unloading back to 5 MPa. At each pressure point, electrode thickness and resistance were recorded simultaneously. The initial 5 MPa point was used as the benchmark for normalized thickness deformation calculations (stress-strain curves). This loading-unloading protocol separates elastic (reversible) deformation from plastic and fracture (irreversible) deformation for each electrode.
Figure 3 shows the stress-strain (compression performance) curves for the four electrode sheets under the 5–60 MPa loading-unloading cycle, and Table 1 summarizes the key deformation metrics.
Key finding: Maximum deformation, reversible deformation, and irreversible deformation all decrease as calendering pressure (and compaction density) increases — following the order Electrode 1 > 2 > 3 > 4. However, the rate of decrease slows at higher pressures, indicating diminishing returns from further calendering.
This trend reflects the powder compaction mechanisms within the electrode coating. During initial calendering at low pressure, powder particles rearrange and slide into denser packing — the dominant mechanism that closes inter-particle voids. At higher calendering pressure, particles undergo elastic then plastic deformation once their yield stress is exceeded. Electrodes that have already passed through these stages at high calendering pressure have less compressible structure remaining, so they show smaller total deformation and less elastic rebound (spring-back) when compressed again during testing.

Figure 3. Stress-strain compression curves for four electrode sheets (Electrodes 1–4, compaction densities 1.35, 1.5, 1.6, 1.65 g/cm³) — maximum, reversible, and irreversible deformation all decrease with increasing initial calendering pressure
| Name | Reversible Deformation | Irreversible Deformation | Max Deformation |
|---|---|---|---|
| Graphite Electrode-1 | 4.53% | 19.71% | 24.23% |
| Graphite Electrode-2 | 4.42% | 17.56% | 21.98% |
| Graphite Electrode-3 | 4.35% | 14.11% | 18.46% |
| Graphite Electrode-4 | 4.35% | 13.67% | 18.03% |
During lithium-ion battery electrode manufacturing, the calendering process primarily compresses electrode thickness while keeping areal mass nearly constant — reducing coating thickness, increasing compaction density, and improving particle-to- particle and particle-to-current-collector adhesion. During roll-pressing, particles form micro-indentations (“pits”) on the current collector surface, increasing the contact area and mechanical adhesion between coating and current collector.
Figures 4 and 5 show the thickness change and electrical conductivity curves for all four electrodes during the stepwise BER2500 pressure test:
Thickness behavior: Electrodes 1 and 2 (lower calendering pressure, lower compaction density) start thicker and exhibit more significant thickness reduction under test pressure, as well as greater elastic rebound on unloading. Electrodes 3 and 4 (higher calendering pressure, ≥1.6 g/cm³) are denser, deform less under the same test pressure, and show less elastic rebound — because their structure is already highly consolidated.
Resistivity behavior: The resistivity of Electrodes 1 and 2 changes more significantly with applied test pressure than Electrodes 3 and 4. This occurs because Electrodes 3 and 4 already have tightly consolidated inter-particle contacts and coating-to-current-collector interfaces from high-pressure calendering, leaving little room for further pressure-induced conductivity improvement during the test. Notably, the absolute resistivity values of the lower-pressure electrodes may appear lower under test pressure due to their larger thickness reduction — resistivity is geometry-dependent, and significant thickness compression can numerically lower apparent resistivity even if intrinsic conductivity changes are modest. This highlights that electrode resistivity assessment must account for the test geometry and report both thickness and resistance together.

Figure 4. Thickness vs pressure curves for four electrode sheets (5–60 MPa, loading and unloading) — Electrodes 1 and 2 show larger thickness reduction and elastic rebound; Electrodes 3 and 4 show stable, near-constant thickness

Figure 5. Electrical conductivity vs pressure for four electrode sheets — Electrodes 1 and 2 show larger conductivity variation with applied test pressure; Electrodes 3 and 4 show stable response, as pre-existing high-pressure calendering has already consolidated inter-particle and coating-current-collector contacts
Based on the measured behavior, the following process guidelines apply to graphite anode electrode calendering:
Target compaction density by calendering pressure: Higher calendering pressure reliably delivers higher compaction density (1.35 → 1.65 g/cm³ in this study), which reduces subsequent compressibility and stabilizes electrode thickness under load. Compaction densities ≥1.6 g/cm³ for graphite anodes produce near-stable structures that are robust to downstream assembly pressure.
Account for test geometry when evaluating electrode resistivity: Test geometry and transient thickness change during flat-plate compression can mask or reverse apparent conductivity trends between electrodes at different compaction densities. Always report both thickness and resistance together — not resistivity alone — to avoid misleading comparisons.
This study demonstrates the effective use of the BER2500 electrode resistance analyzer to differentiate the compression and conductive properties of graphite anode electrodes produced under varying calendering pressures. The methodology clearly reveals how initial calendering pressure dictates an electrode’s mechanical resilience and its electrical resistivity response to subsequent compression testing.
The choice of optimal calendering pressure in actual production must be carefully tailored to the specific electrode formulation and cell design targets. The right balance maximizes battery volumetric energy density while ensuring robust mechanical integrity, efficient electronic conduction, and adequate porosity for ion transport — collectively determining cell performance and cycle life.
[1] Zhang J, Huang H, Sun J. Investigation on mechanical and microstructural evolution of lithium-ion battery electrode during the calendering process[J]. Powder Technology, 2022, 409: 117828.
[2] BG Westphal et al. Influence of high intensive dry mixing and calendering on relative electrode resistivity determined via an advanced two point approach. Journal of Energy Storage 2017, 11, 76–85
[3] Yang Shaobin, Liang Zheng. Principles and applications of lithium-ion battery manufacturing process[M]. Chemical Industry Press, 2020.
Calendering pressure and electrode compaction density have a positive, but progressively diminishing, relationship. As calendering pressure increases, electrode coating density rises because pressure forces particle rearrangement (filling inter-particle voids), elastic deformation (reversible shape change), plastic deformation (permanent densification), and ultimately particle fracture. In this study, compaction densities ranged from 1.35 g/cm³ (lowest calendering pressure) to 1.65 g/cm³ (highest), calculated by the cutting-thickness-weighing method. However, the density increase per unit pressure decrement becomes smaller at higher pressures — reflecting that most void filling and rearrangement occurs early, and further densification requires increasingly large energy input for diminishing density gain. This diminishing-returns behavior is visible in the stress-strain curves (Figure 3) as the gap between adjacent electrode curves narrows at higher compaction densities.
Electrode compression testing characterizes how a calendered battery electrode sheet deforms mechanically under applied uniaxial load — quantifying the elastic (reversible) and plastic/fracture (irreversible) components of deformation as a function of applied pressure. The IEST BER2500 electrode resistance analyzer performs this characterization in a combined measurement: it applies a defined pressure protocol (in this study, 5–60 MPa in 5 MPa steps with 15 s hold per step, followed by stepwise unloading) to a 14 mm diameter electrode sample while simultaneously recording electrode thickness and resistance at each step. This enables stress-strain curve generation and resistivity measurement in a single test run, linking mechanical and electrical properties to calendering process parameters — without full-cell fabrication.
During electrode compression testing (and during actual calendering), total deformation has two components. Reversible (elastic) deformation is the thickness recovery that occurs when the applied load is released — the electrode springs back. This spring-back is undesirable in calendering because it means the final electrode is thicker and less dense than the in-calender measurement suggests, requiring higher roll pressure to achieve the target compaction density. Irreversible (plastic and fracture) deformation is the permanent thickness reduction that remains after unloading — the densification that actually stays. For electrode design, the goal is to maximize irreversible (permanent) densification while controlling elastic rebound. In this study, both reversible and irreversible deformation decrease as calendering pressure increases (1 > 2 > 3 > 4), because highly calendered electrodes have already consumed most of their deformation capacity, leaving a more dimensionally stable structure.
Calendering pressure improves through-thickness (vertical) electrode resistivity by two mechanisms: tightening inter-particle contacts within the active material coating (reducing contact resistance between active material, conductive additives, and binder), and improving the contact area between the coating and the current collector (as active material particles create micro-indentations in the metal foil surface). However, interpreting the measured resistivity of different-pressure electrodes requires care: resistivity is calculated from resistance and geometric dimensions, and a thicker, less-calendered electrode compressed during testing will show a numerically lower apparent resistivity due to thickness reduction — even if the intrinsic conductivity change is modest. To avoid misleading comparisons, electrode resistance and thickness should always be reported together when comparing electrodes with different pre-calendering histories.
Discrete Element Method (DEM) simulation is a computational technique that models the individual mechanical interactions between particles — each represented as a discrete object with defined contact laws for normal force, tangential force, and failure — rather than treating the electrode coating as a continuum. In calendering research (such as Zhang et al. 2022, referenced in this article), DEM is combined with Heckel compression modeling and experimental force-displacement curves to identify which deformation mechanism dominates at each stage of calendering pressure. DEM simulation reveals the sequence of particle rearrangement, elastic deformation, plastic deformation, and particle fracture — showing how each stage contributes to the final compaction density and identifying pressure thresholds beyond which fracture dominates. These computational insights complement experimental BER2500 electrode compression testing by providing mechanistic explanations for the observed stress-strain behavior.
