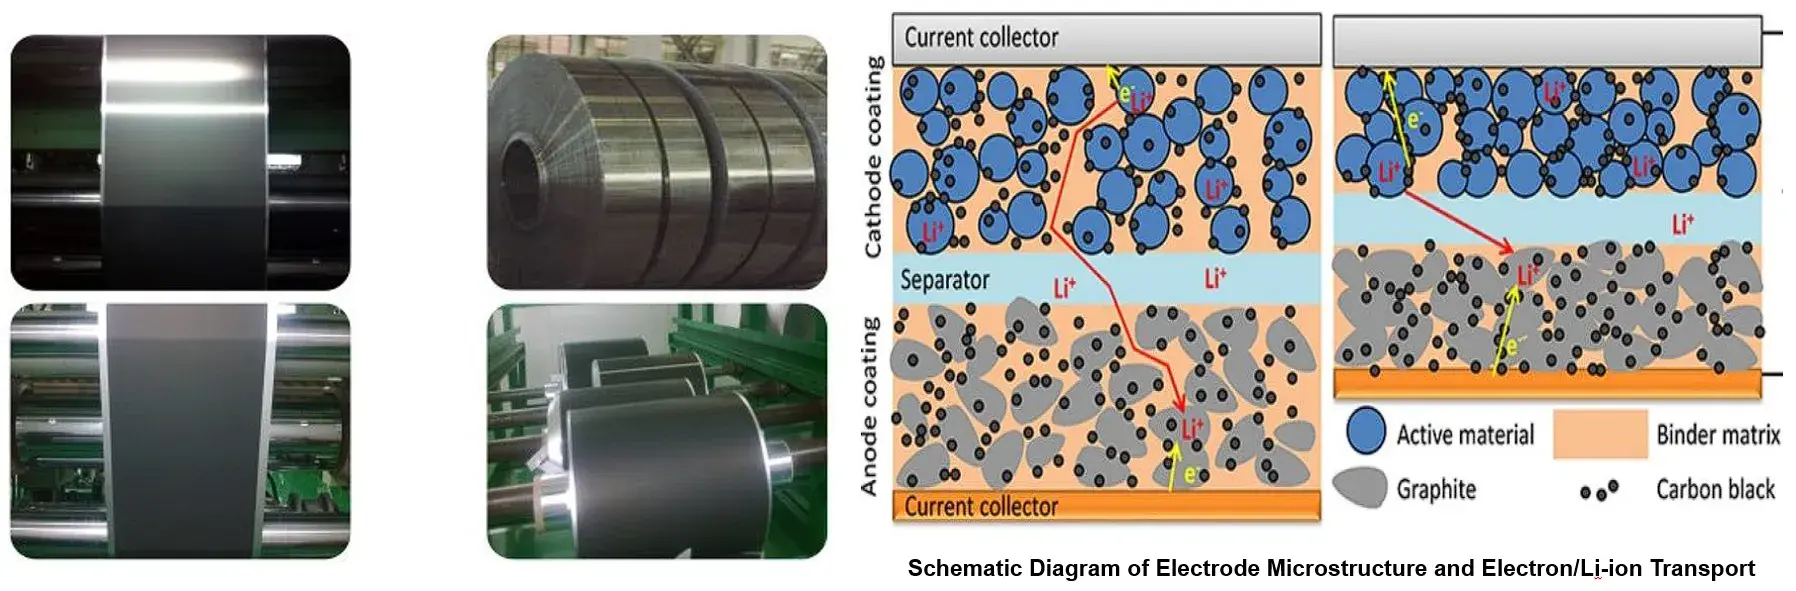
Multiple methods exist for measuring electrode resistance, including four point probe, multi-point probe, and single-point probe techniques. While these conventional approaches are well-established for homogeneous thin films in other fields, they exhibit significant limitations when evaluating composite electrodes for lithium-ion batteries.
The four-point probe technique is a standard method for measuring thin-film surface resistance. Using four or more probe contacts, it provides accurate sheet-resistance measurements with simple operation. By applying basic equivalent-circuit models, the technique can separate anisotropic resistance components. When combined with electrode thickness measurement, four-point-probe data enable precise calculation of bulk resistivity and support comprehensive electrode characterization. However, its fundamental principle requires:
Smooth surfaces
Homogeneous materials
Insulating substrates
Lithium-ion battery electrodes present critical incompatibilities:
Inherently rough surfaces
Multi-component heterogeneity (active materials, binders, conductive additives)
Conductive current collector substrates
Consequently, four point probe measurements yield inconsistent data that defy theoretical modeling. Increasing probe quantity/complexity marginally improves reliability but introduces:
Structural impracticalities
Compromised measurement repeatability & reproducibility
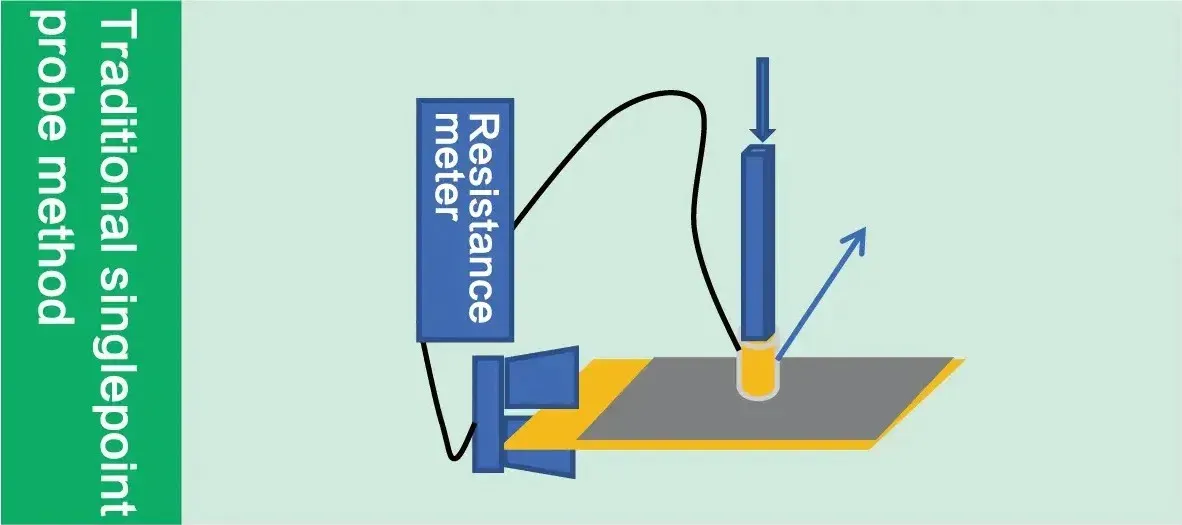
This industry-prevalent approach employs:
Fixed probe at current collector terminus
Mobile probe on electrode coating surface
Despite its simplicity (often implemented via user-assembled probes with resistance meters), it remains a rough empirical method neglecting critical variables:
Applied pressure consistency
Current path length variation
Substrate interference effects
Thus, single-point probing fails to deliver reliable or consistent electrode resistance data.
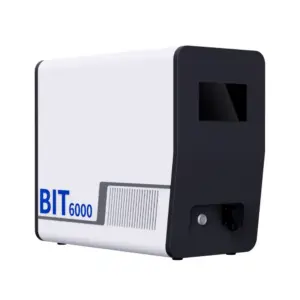
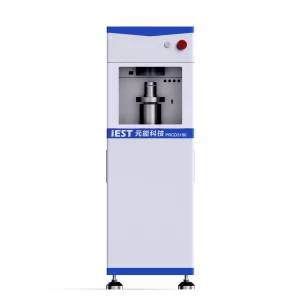
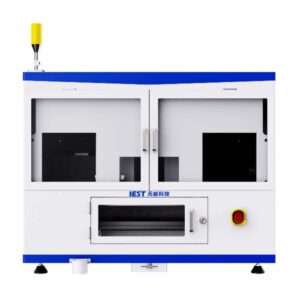
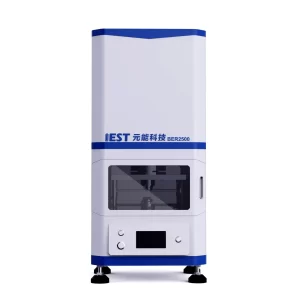
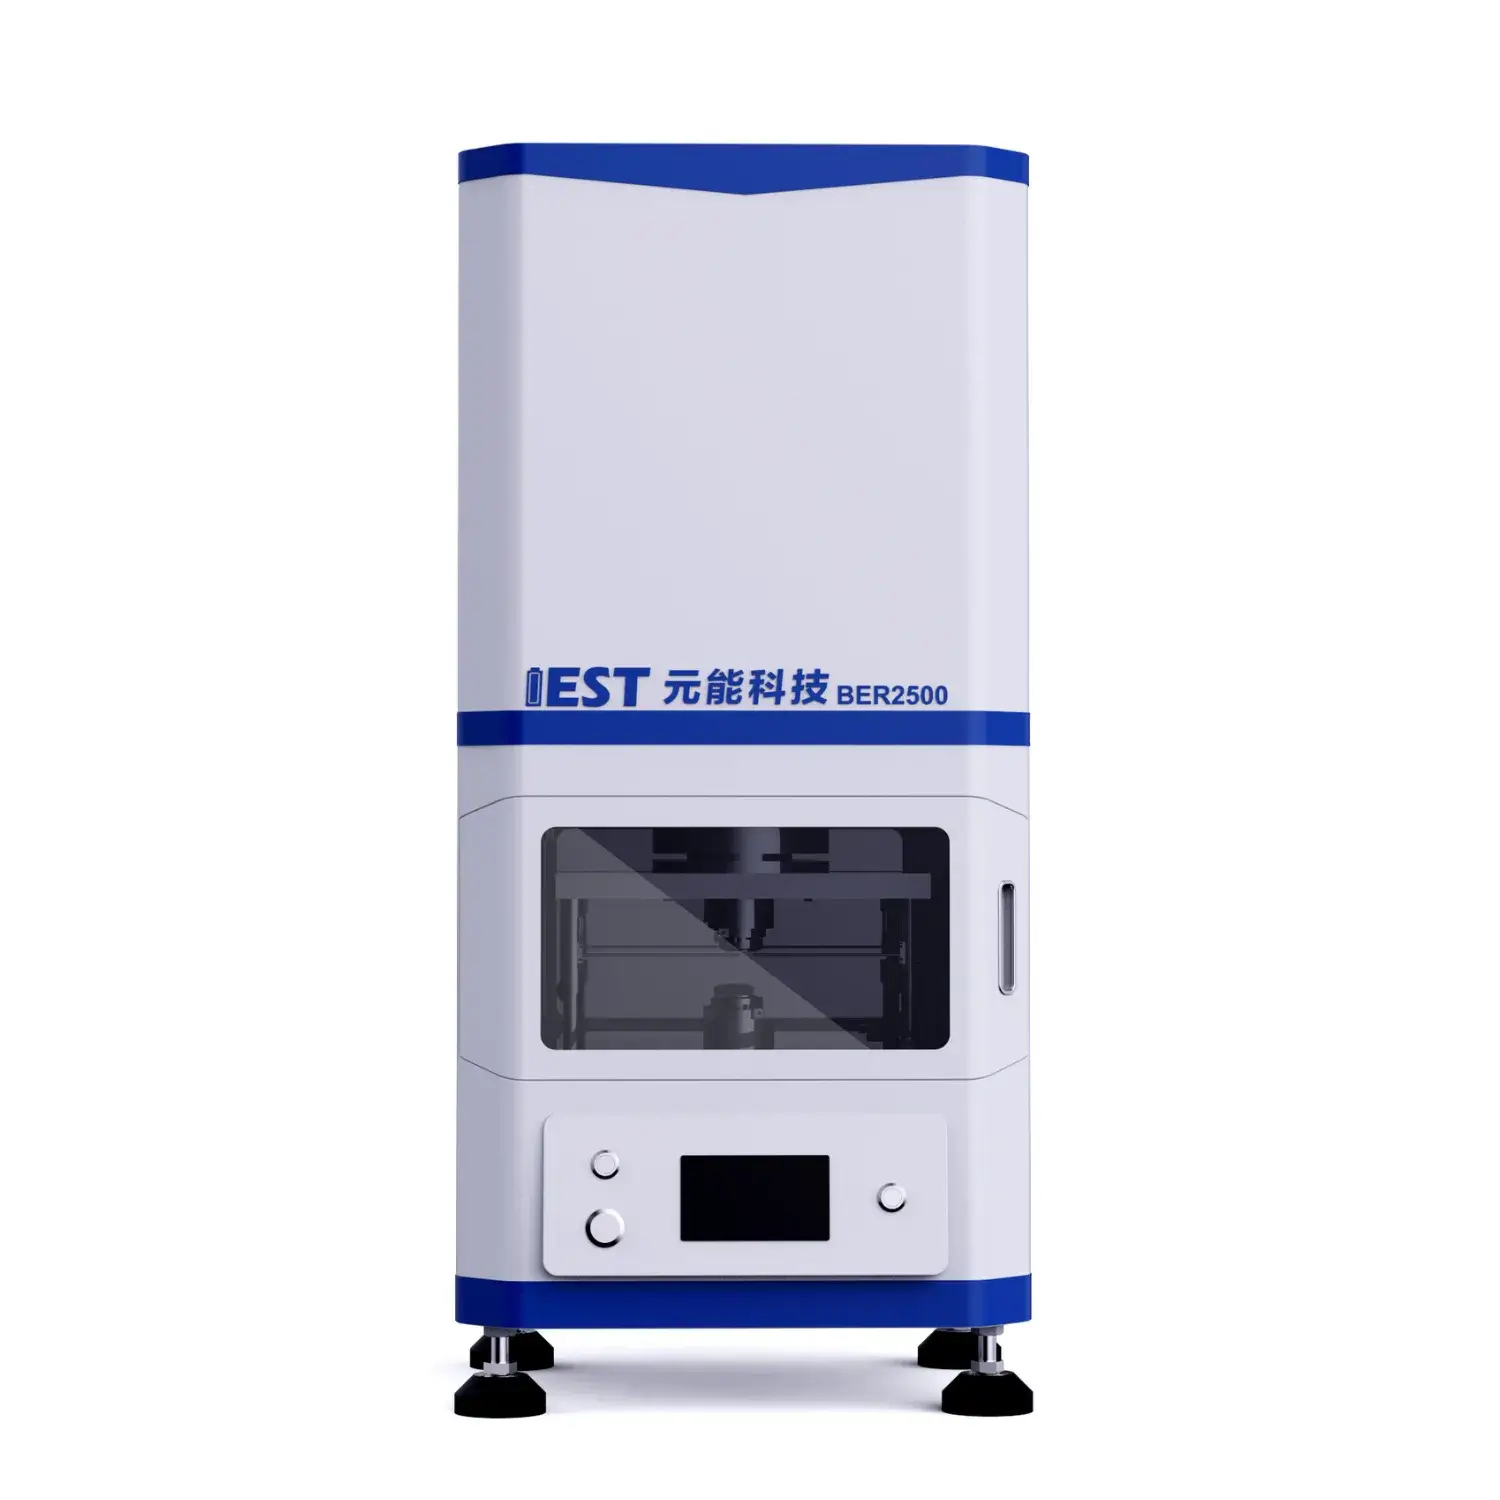
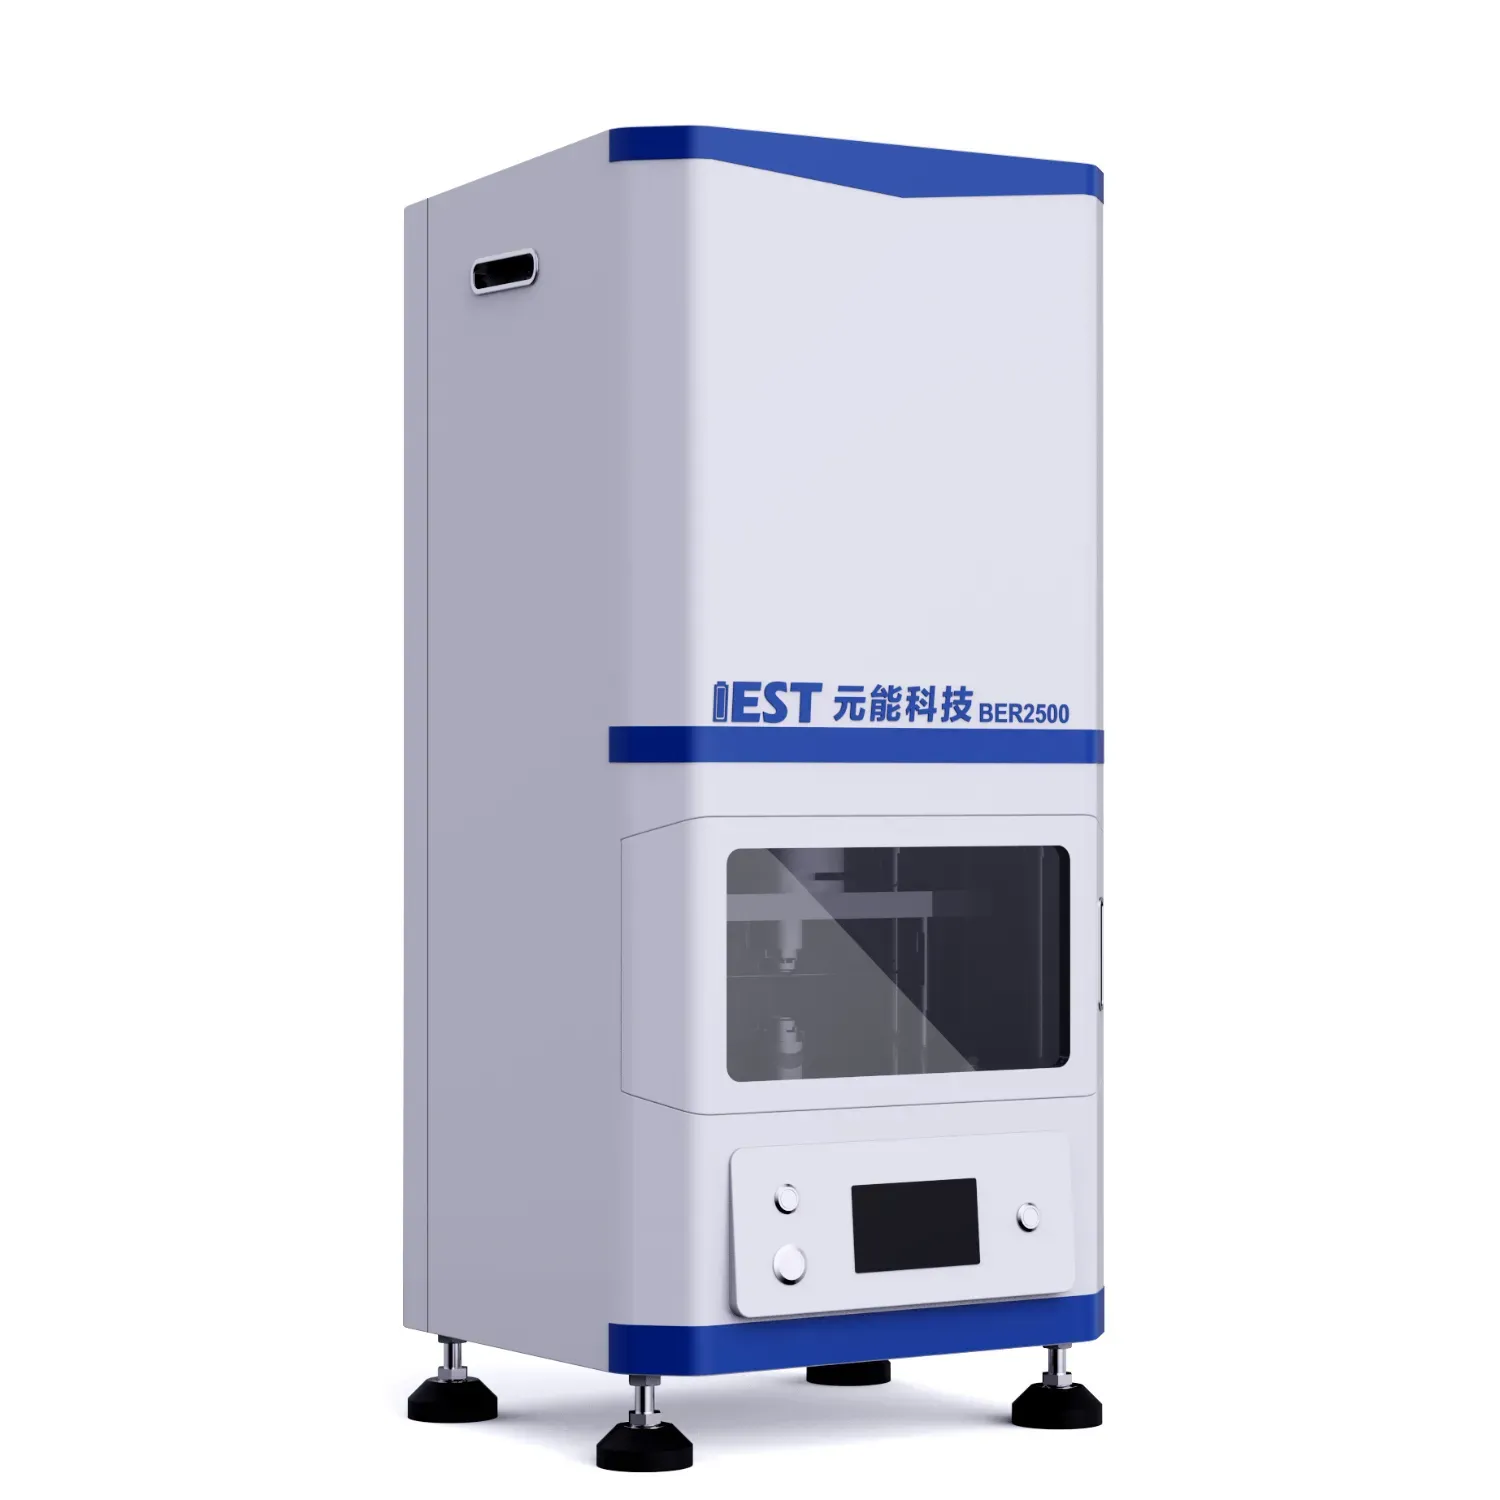
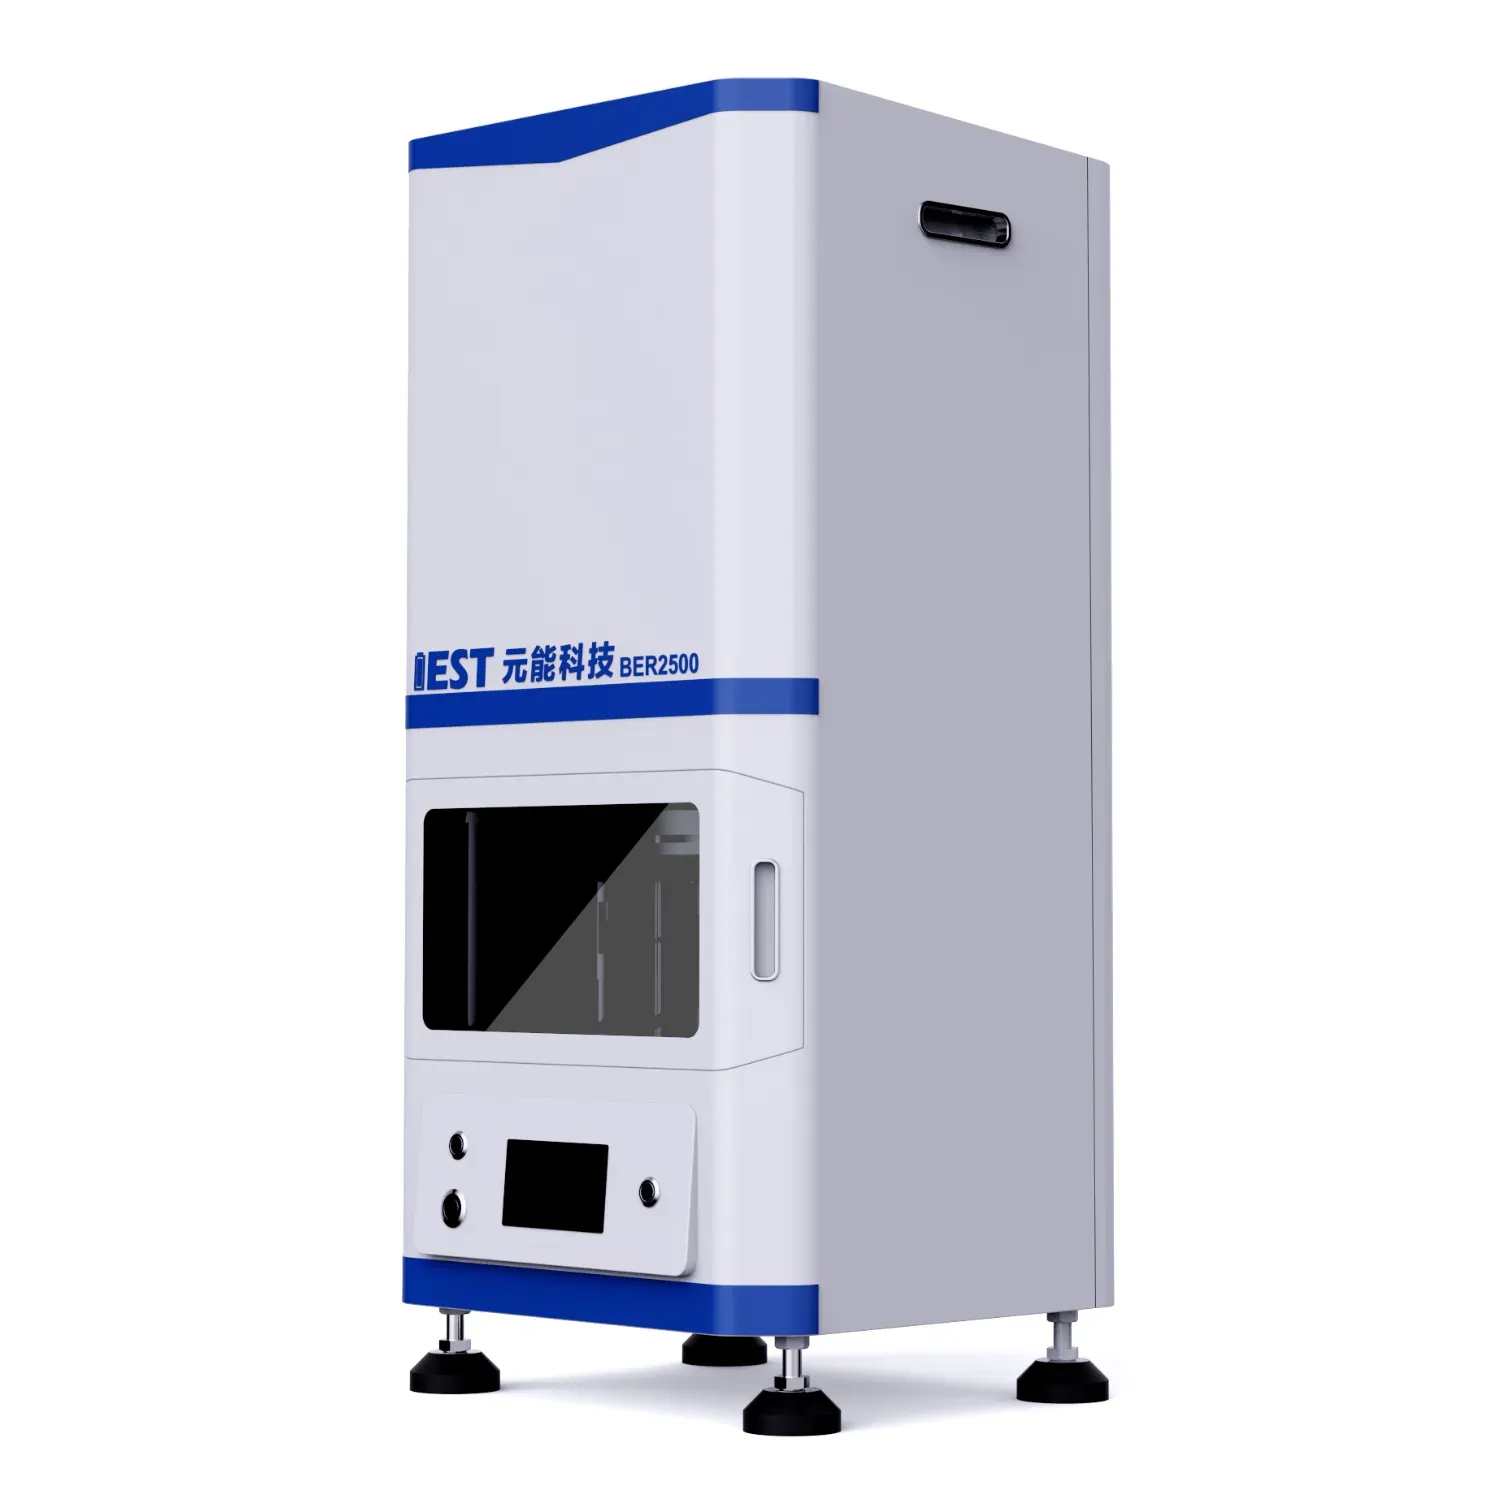
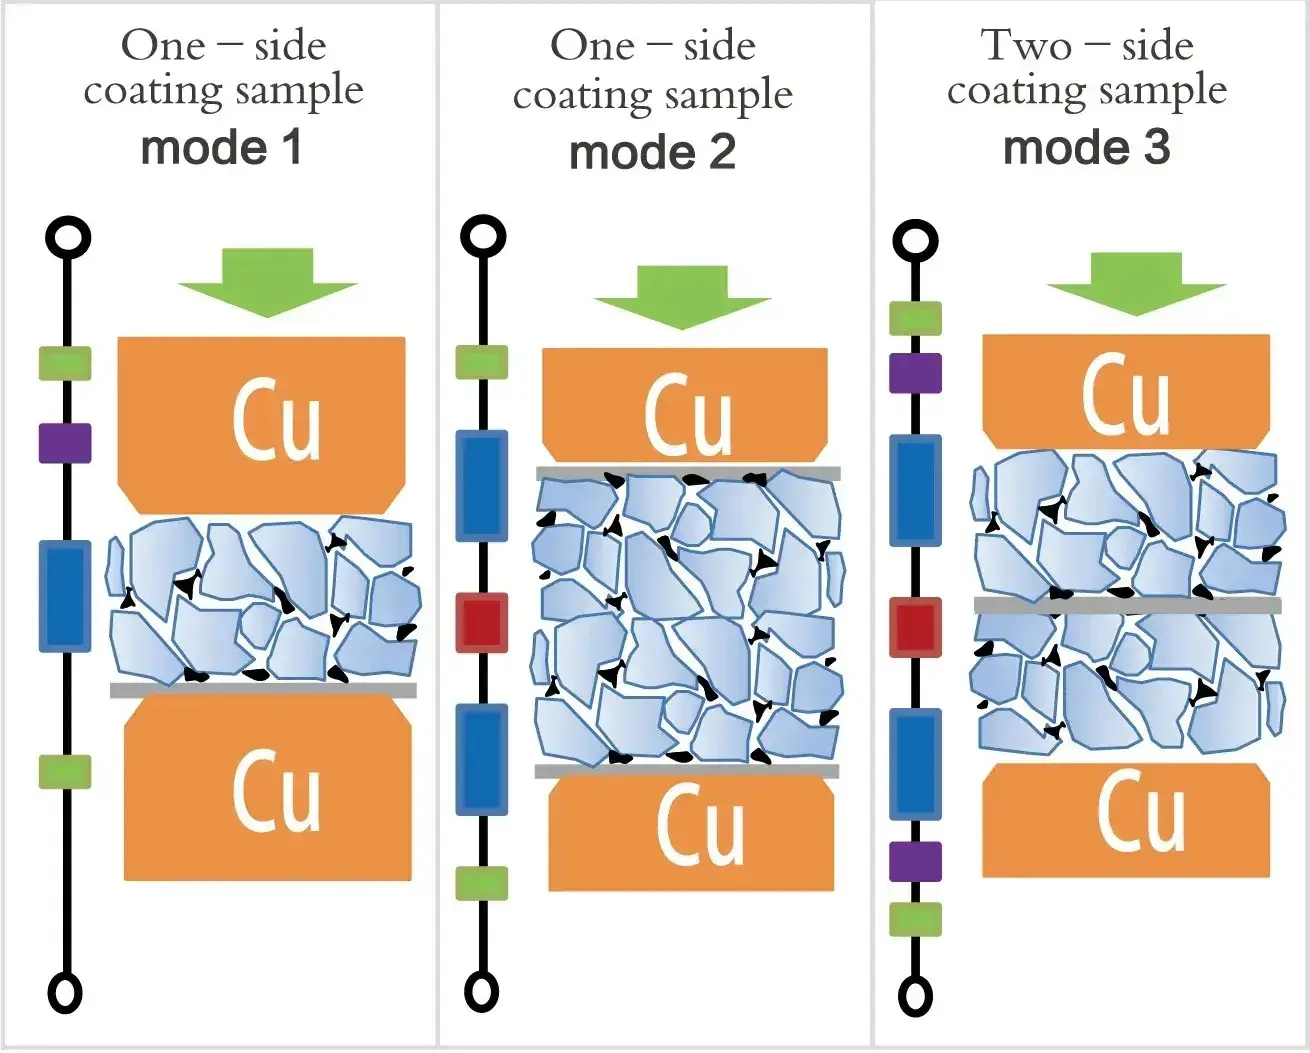
The BER Series Multifunctional Electrode Resistance Analyzer combines a high-precision pressure control system with integrated capabilities for electrode thickness measurement and resistance analysis. The BER Series adopts the dual-planar pressure-controlled disc electrode resistance method to directly measure the overall resistivity of real battery electrodes—comprising the sum of coating resistance, coating-to-current collector contact resistance, and current collector resistance. Jointly developed with CATL and Xiamen University. It is an ideal tool for electrode formulation development and process stability monitoring. 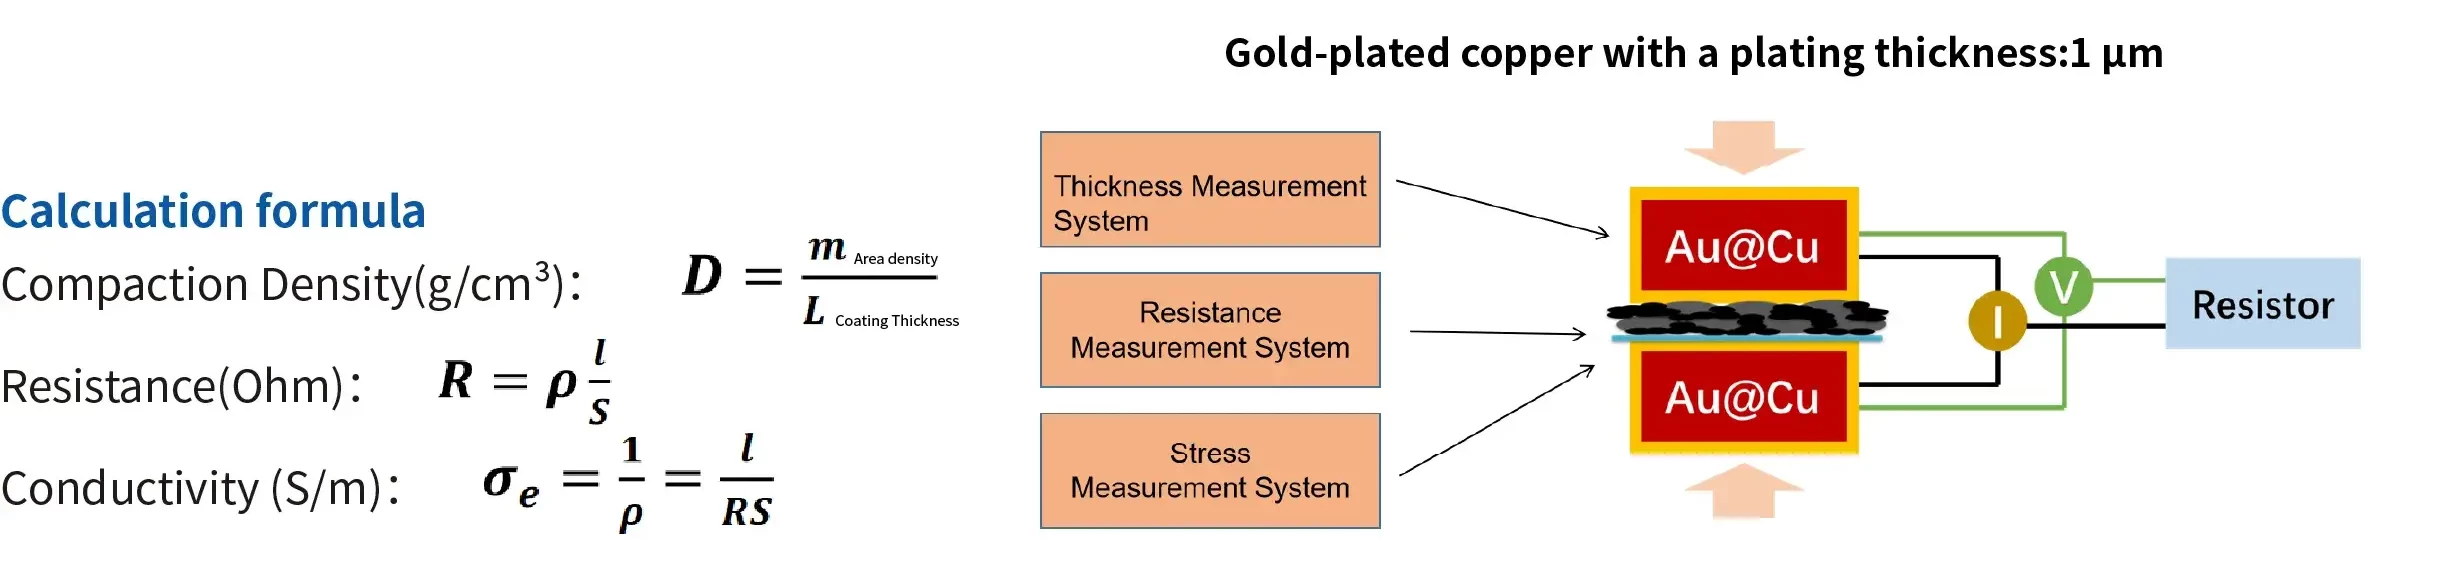

As an leading electrode resistivity tests manufacturer, IEST Instrument presents the BER Series battery electrode resistance analyzer. The BER Series employs two pressure-controllable planar probes to directly measure through-thickness electrode resistance, which can obtain the overal resislance and resistivity in the thickness directon of the electrode, includimng the contact the collector and the current.
The dual-plane, pressure-controllable, high-conductivity probe specially designed for composite electrode and micron-level flat surface treatment ensure the measurement accuracy, the high-precision resistance resolution and the attached calibration module ensure the stability and reliability of the results.
| Equipment | Four-Point & Multi-Probe Method | Single-Probe Method | BER Series Electrode Resistance Meter |
|---|---|---|---|
| Principle | 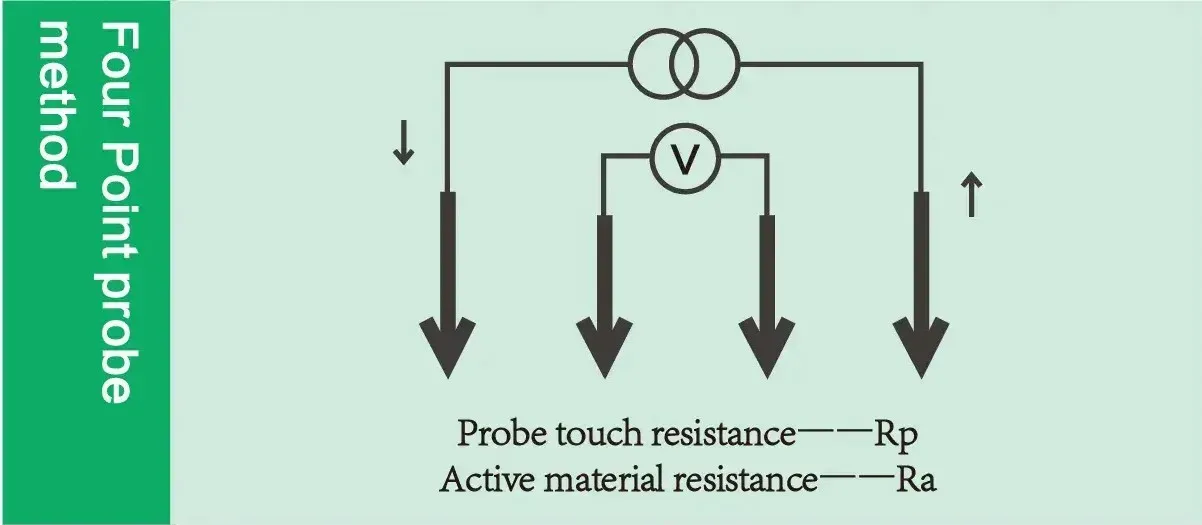 |
 |
 |
| Rtotal | Rtotal = Rcoating + Rcoating-collector + Rcollector | Rtotal = Rcoating-test electrode + Rcoating + Rcoating-collector + Rcollector-transverse | Rtotal = Rcoating-test electrode + Rcoating + Rcoating-collector + Rcollector-longitudinal |
| Applicable Samples | Single-component thin films with smooth surfaces (non-electrodes) | Composite electrodes with current collectors | Thicker composite materials with resistance gradients (electrodes / current collectors) |
| Function | Measure resistance and conductivity of single-component thin films with smooth surfaces | Measure resistance of composite electrodes with current collectors | Measure resistance and conductivity of battery electrodes, adjust testing pressure, and measure electrode thickness changes |
| Summary | 1. Traditional testing methods do not account for parameters such as pressure and contact area during testing. Furthermore, there is a significant discrepancy between theoretical calculation models of multi-point probes and actual samples, making the data results uncontrollable. 2. The BER series battery electrode resistance meter accurately controls testing parameters such as pressure and contact area to ensure stable and reliable results, and directly establishes the correlation between electrode compaction density and electrode resistance. |
||
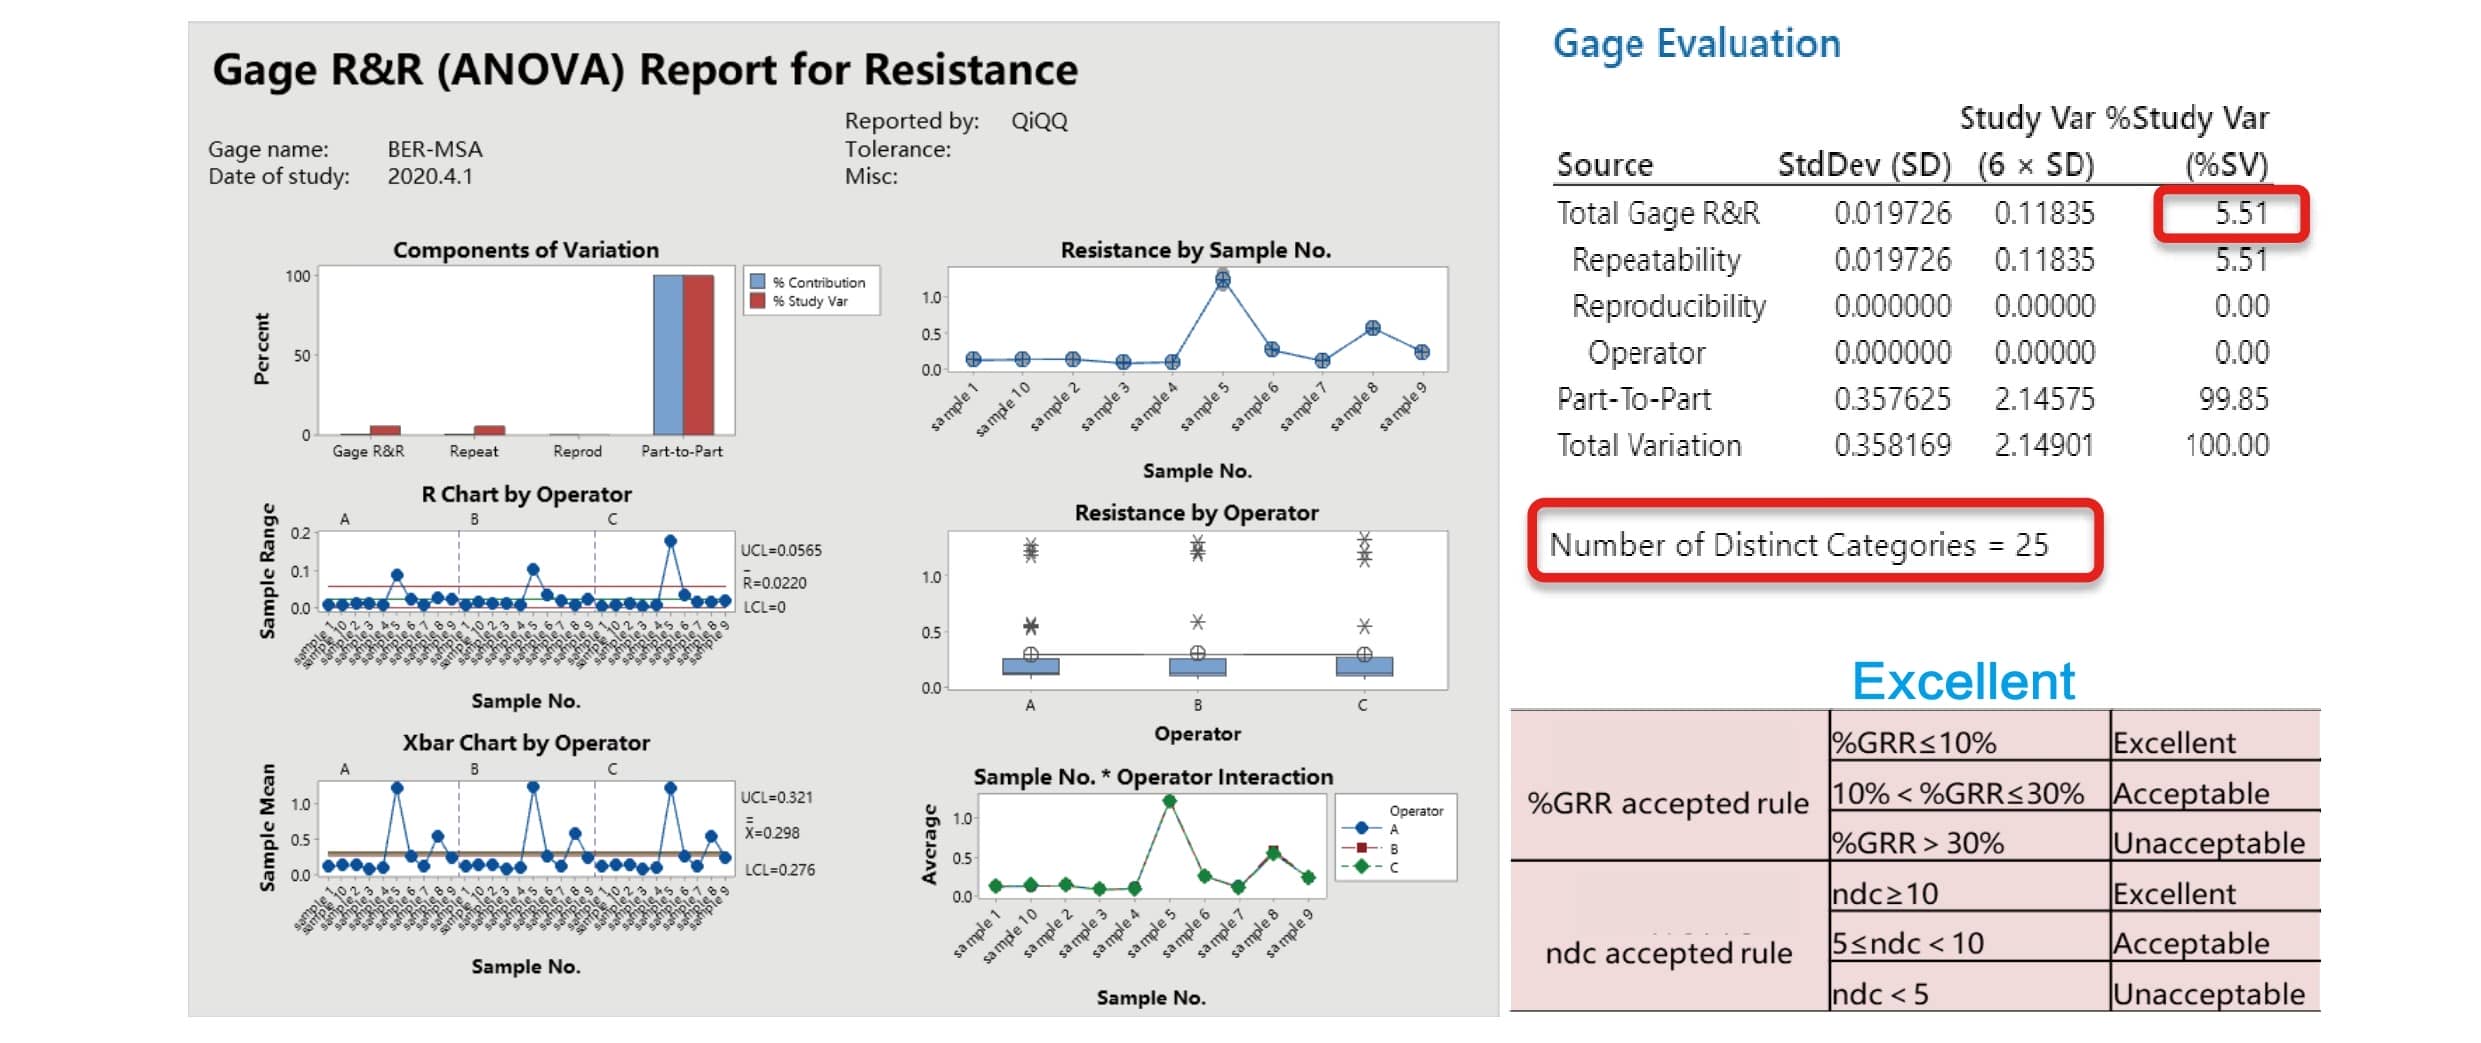
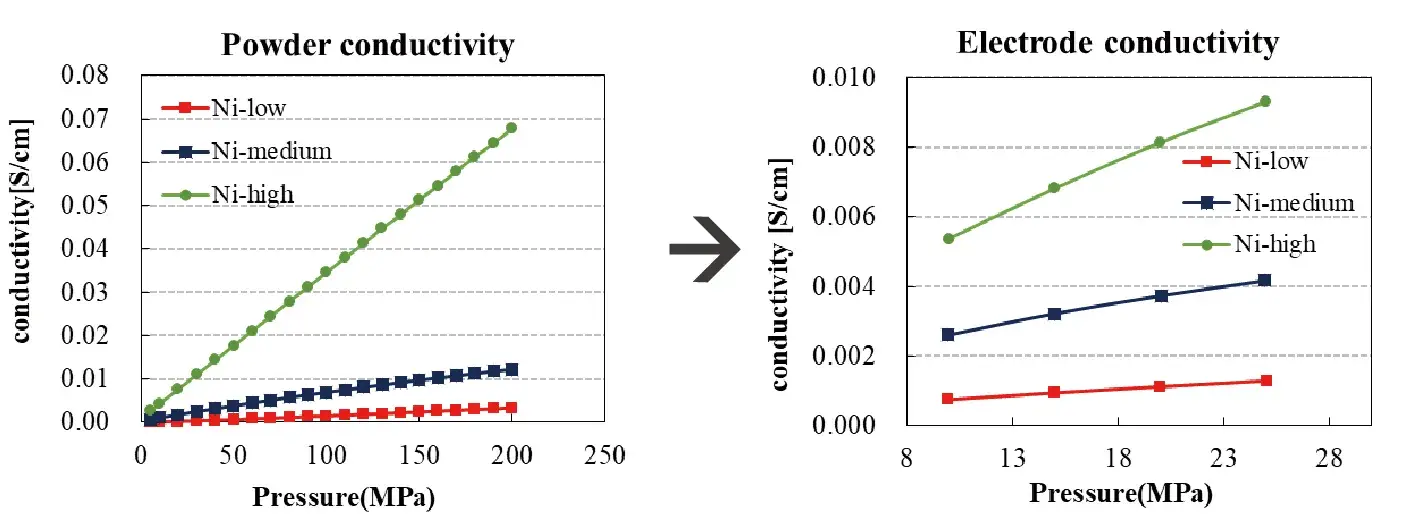
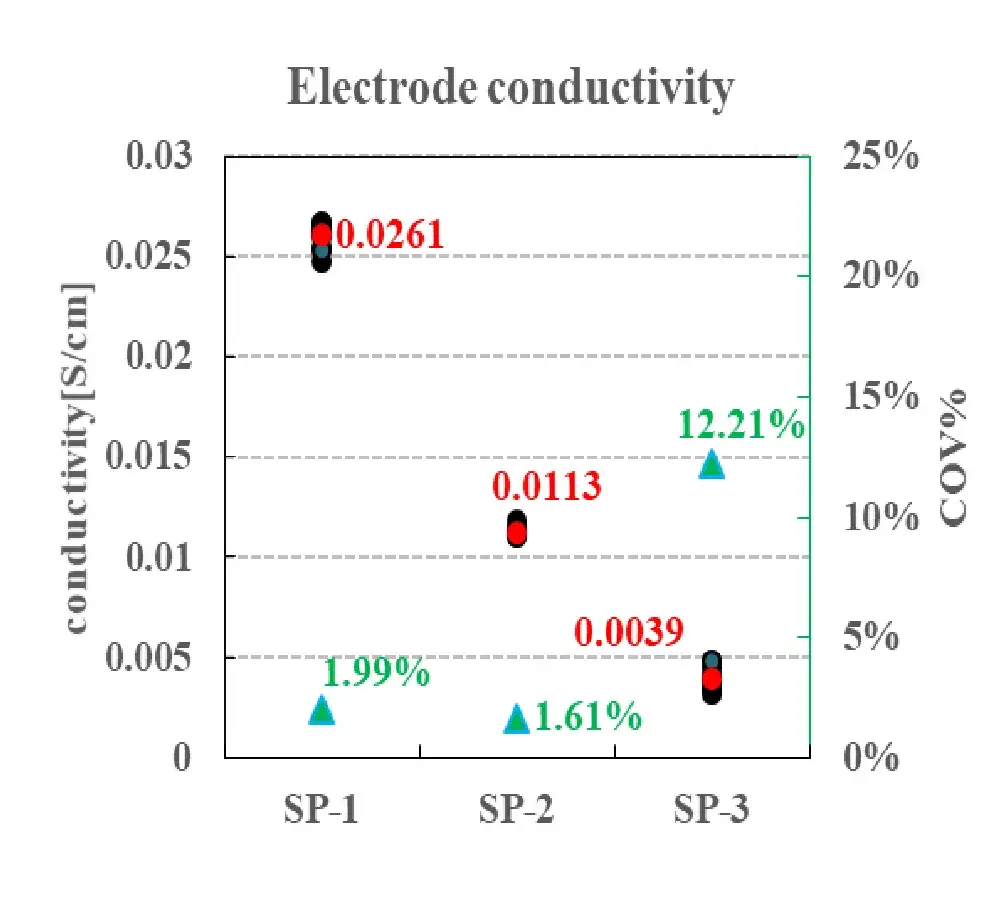
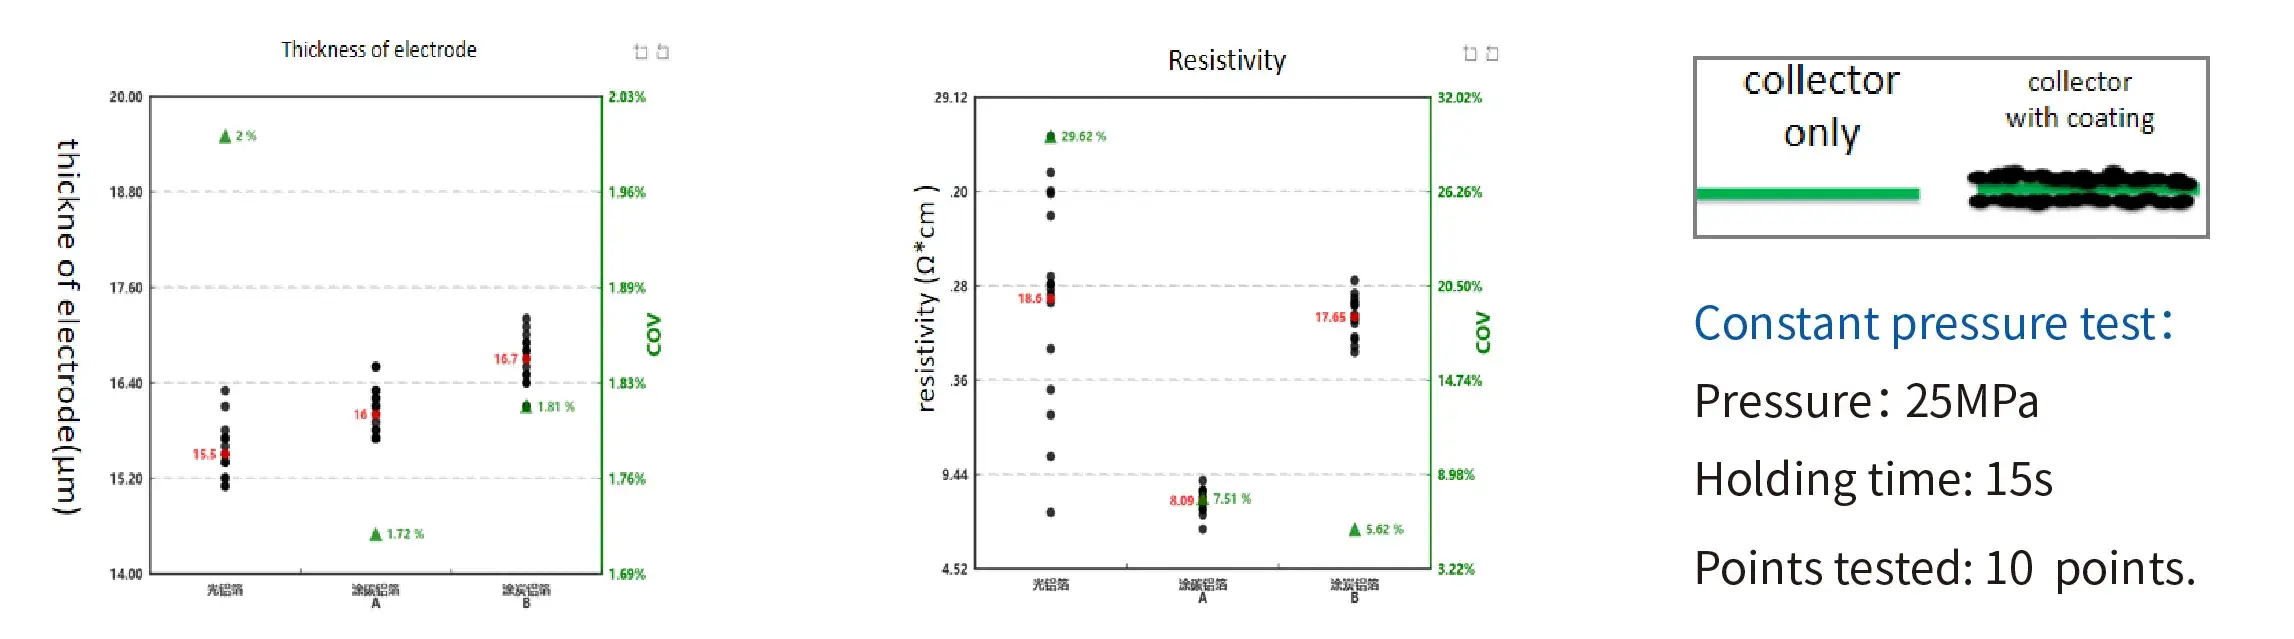
(Note: Coefficient of Variation(COV)=(Standard Deviation SD/Mean)×100%)
Constant pressure test
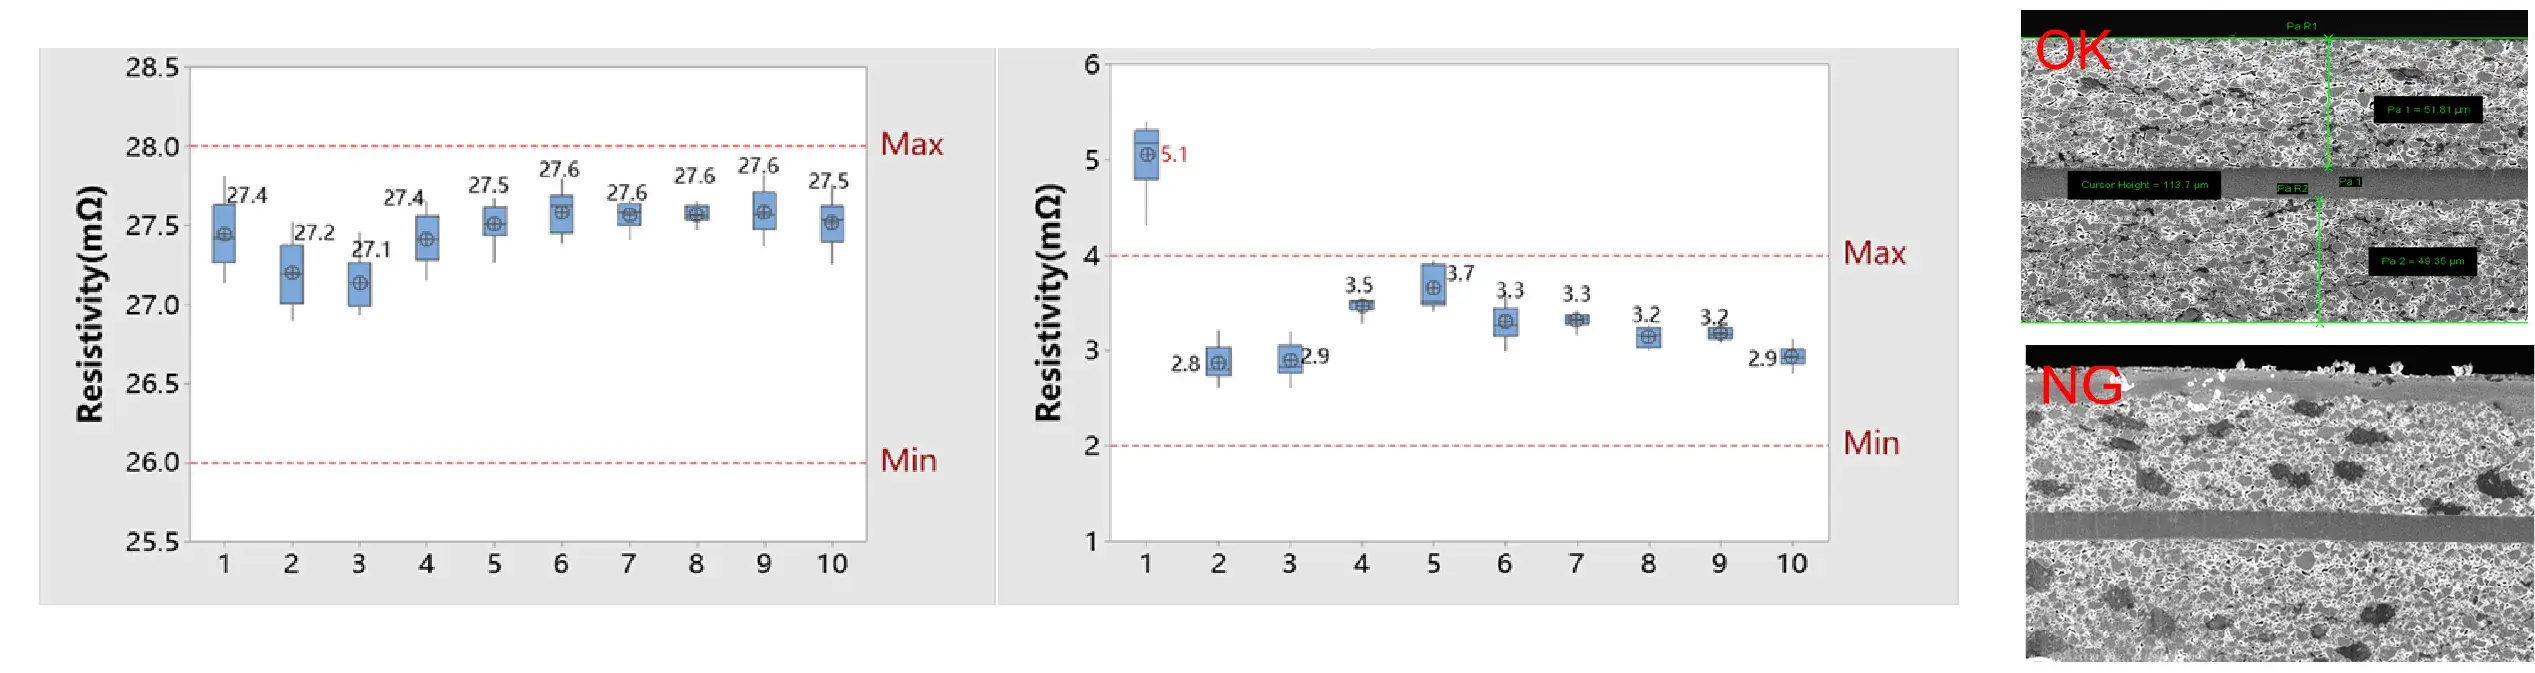
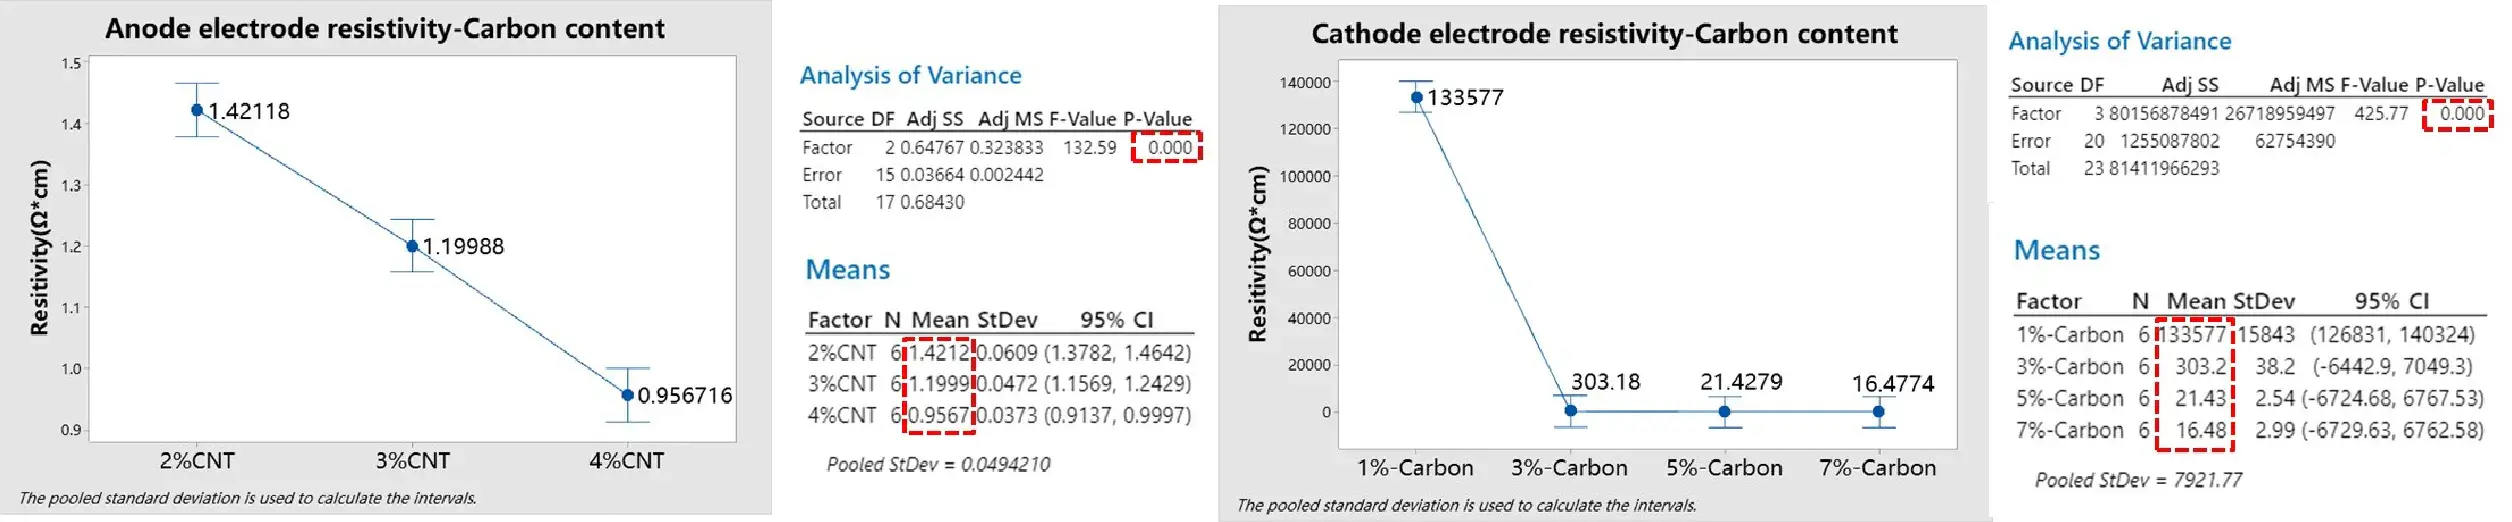
As conductive carbon content increases, the resistivity of NCM electrodes progressively decreases. When conductive carbon exceeds 5%, the reduction magnitude diminishes significantly. Conversely, graphite electrodes exhibit a near-linear reduction in resistivity.
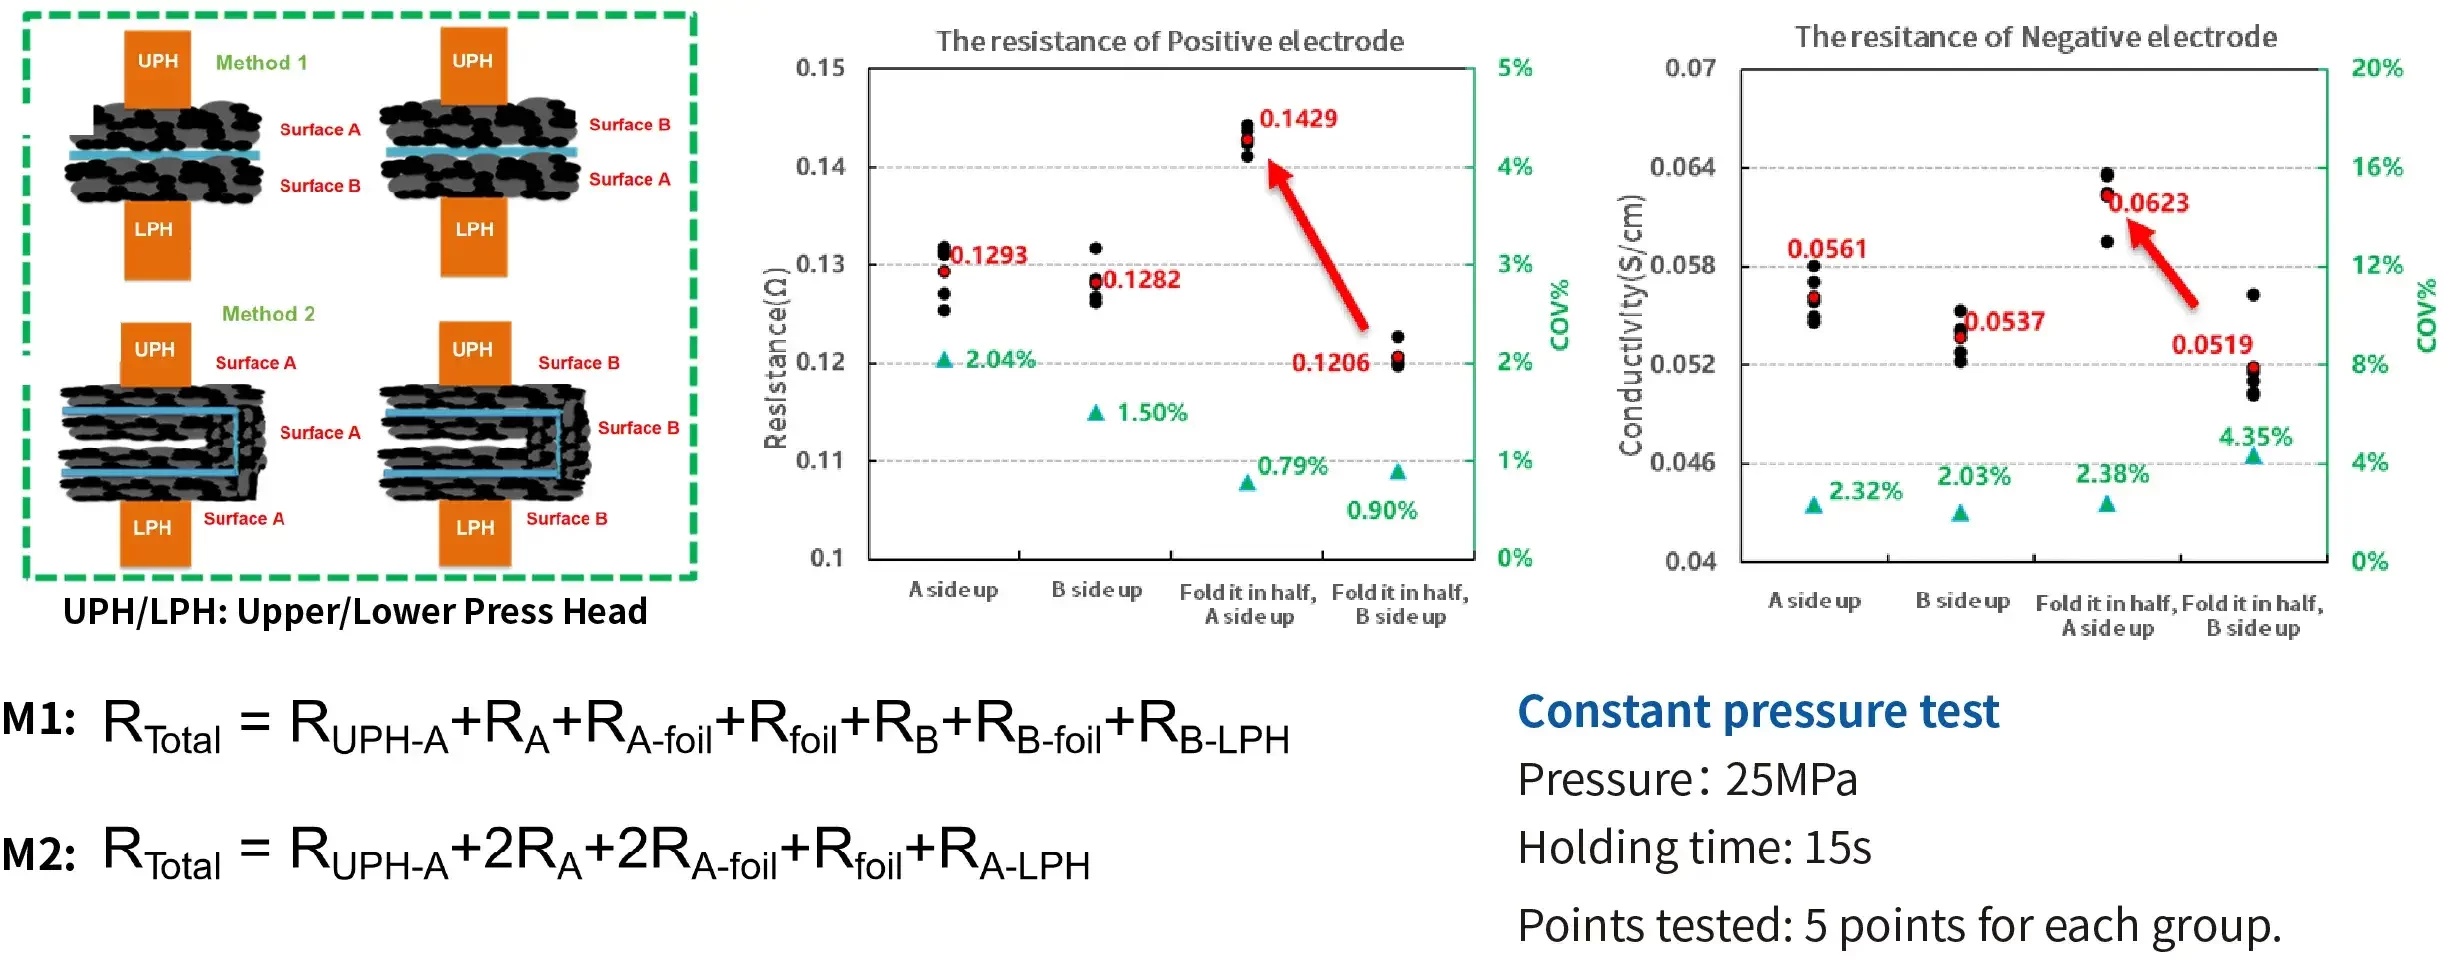
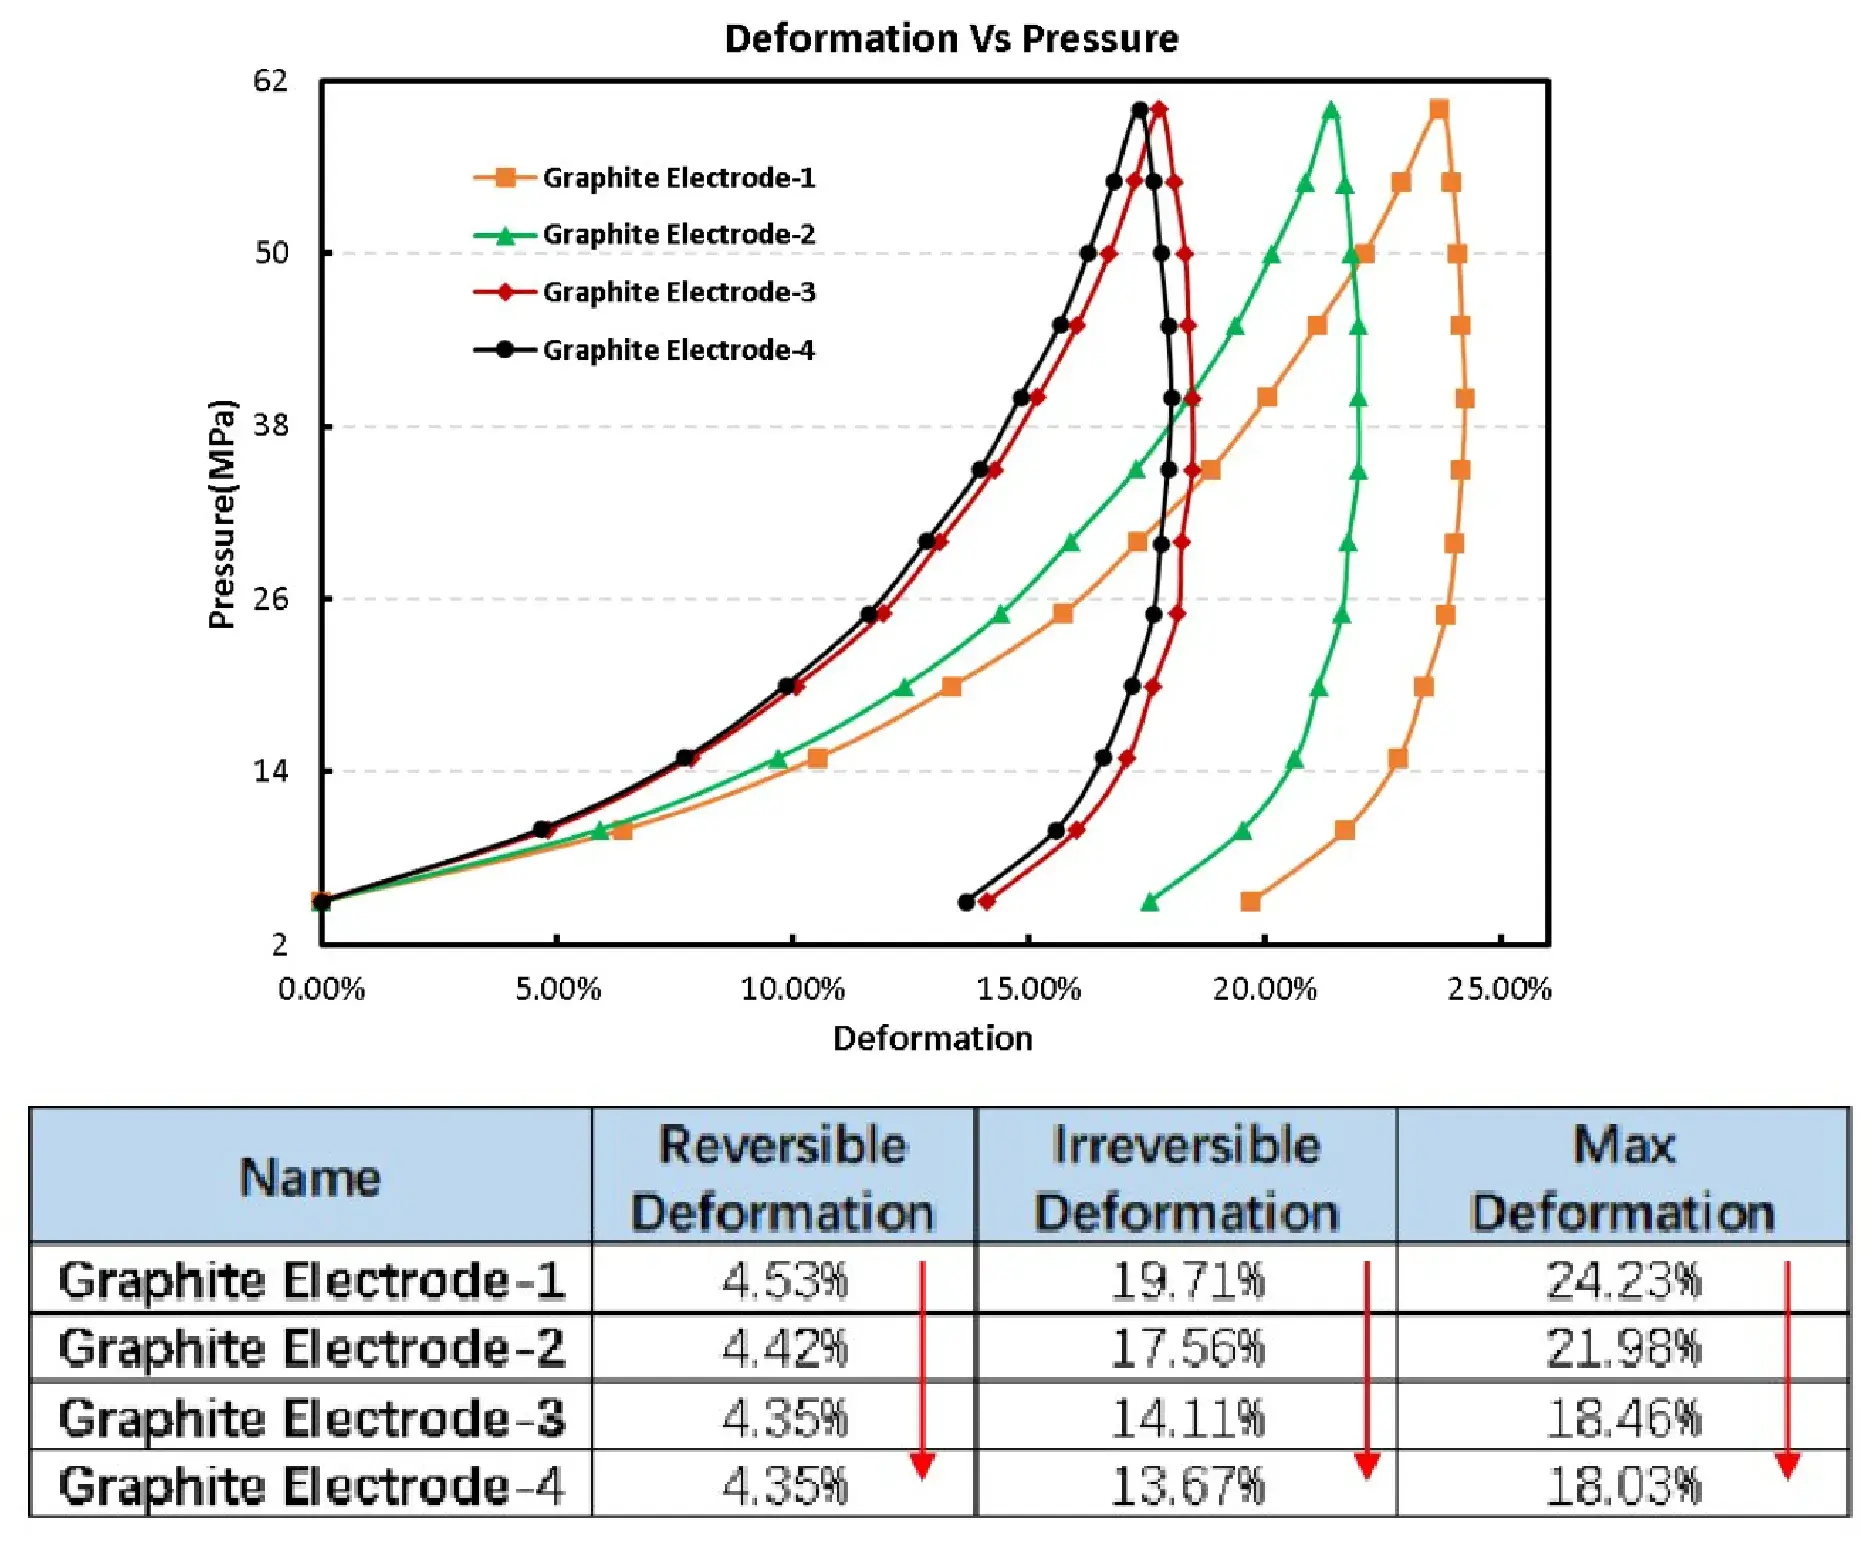

Dry electrodes exhibit the lowest resistance and the best resistance uniformity.
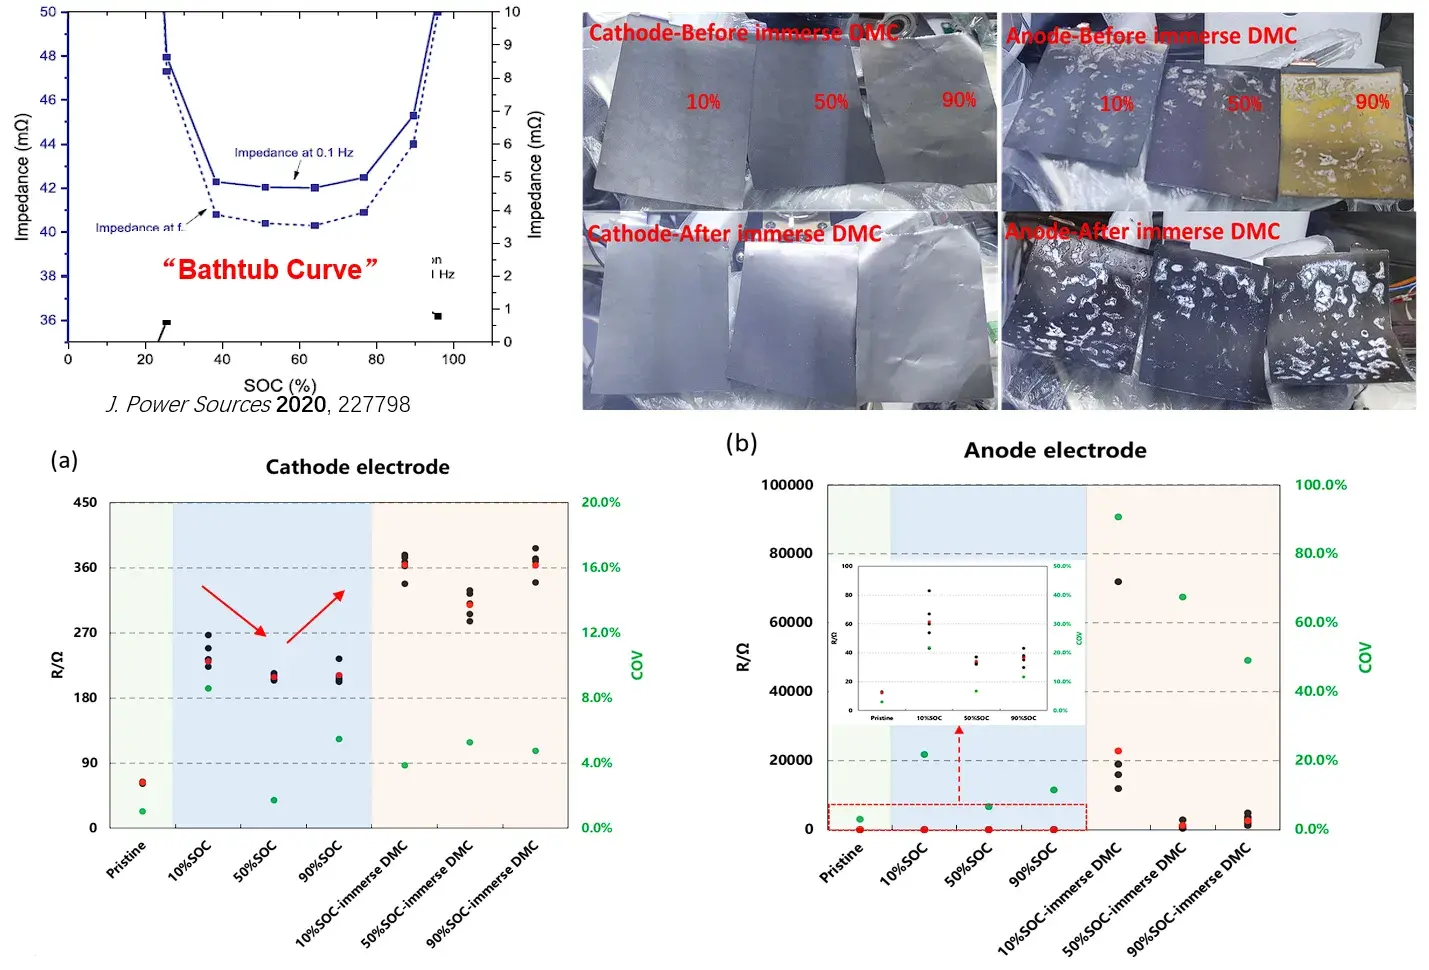
The electronic resistance test results of disassembled electrodes are consistent with the previously measured cell DCR trends.
| Model | BER2100 | BER2200 | BER2300 | BER2500 | |
|---|---|---|---|---|---|
| Pressurization Method | Pneumatic Cylinder (Requires air source, Pressure: 5 ~ 35 MPa) |
Servo Motor (No air source required, Pressure: 5 ~ 60 MPa) |
|||
| Measurable Parameters | Resistance, Force, Temp & Humidity | Resistance, Resistivity, Conductivity, Force, Pressure, Temp & Humidity | Resistance, Resistivity, Conductivity, Force, Pressure, Temp & Humidity | Resistance, Resistivity, Conductivity, Force, Pressure, Temp & Humidity, Thickness, Compacted Density | |
| Functions | Single-Point Test | ● | ● | ● | ● |
| Continuous Test | − | ● | ● | ● | |
| Variable Pressure Mode | − | − | ● | ● | |
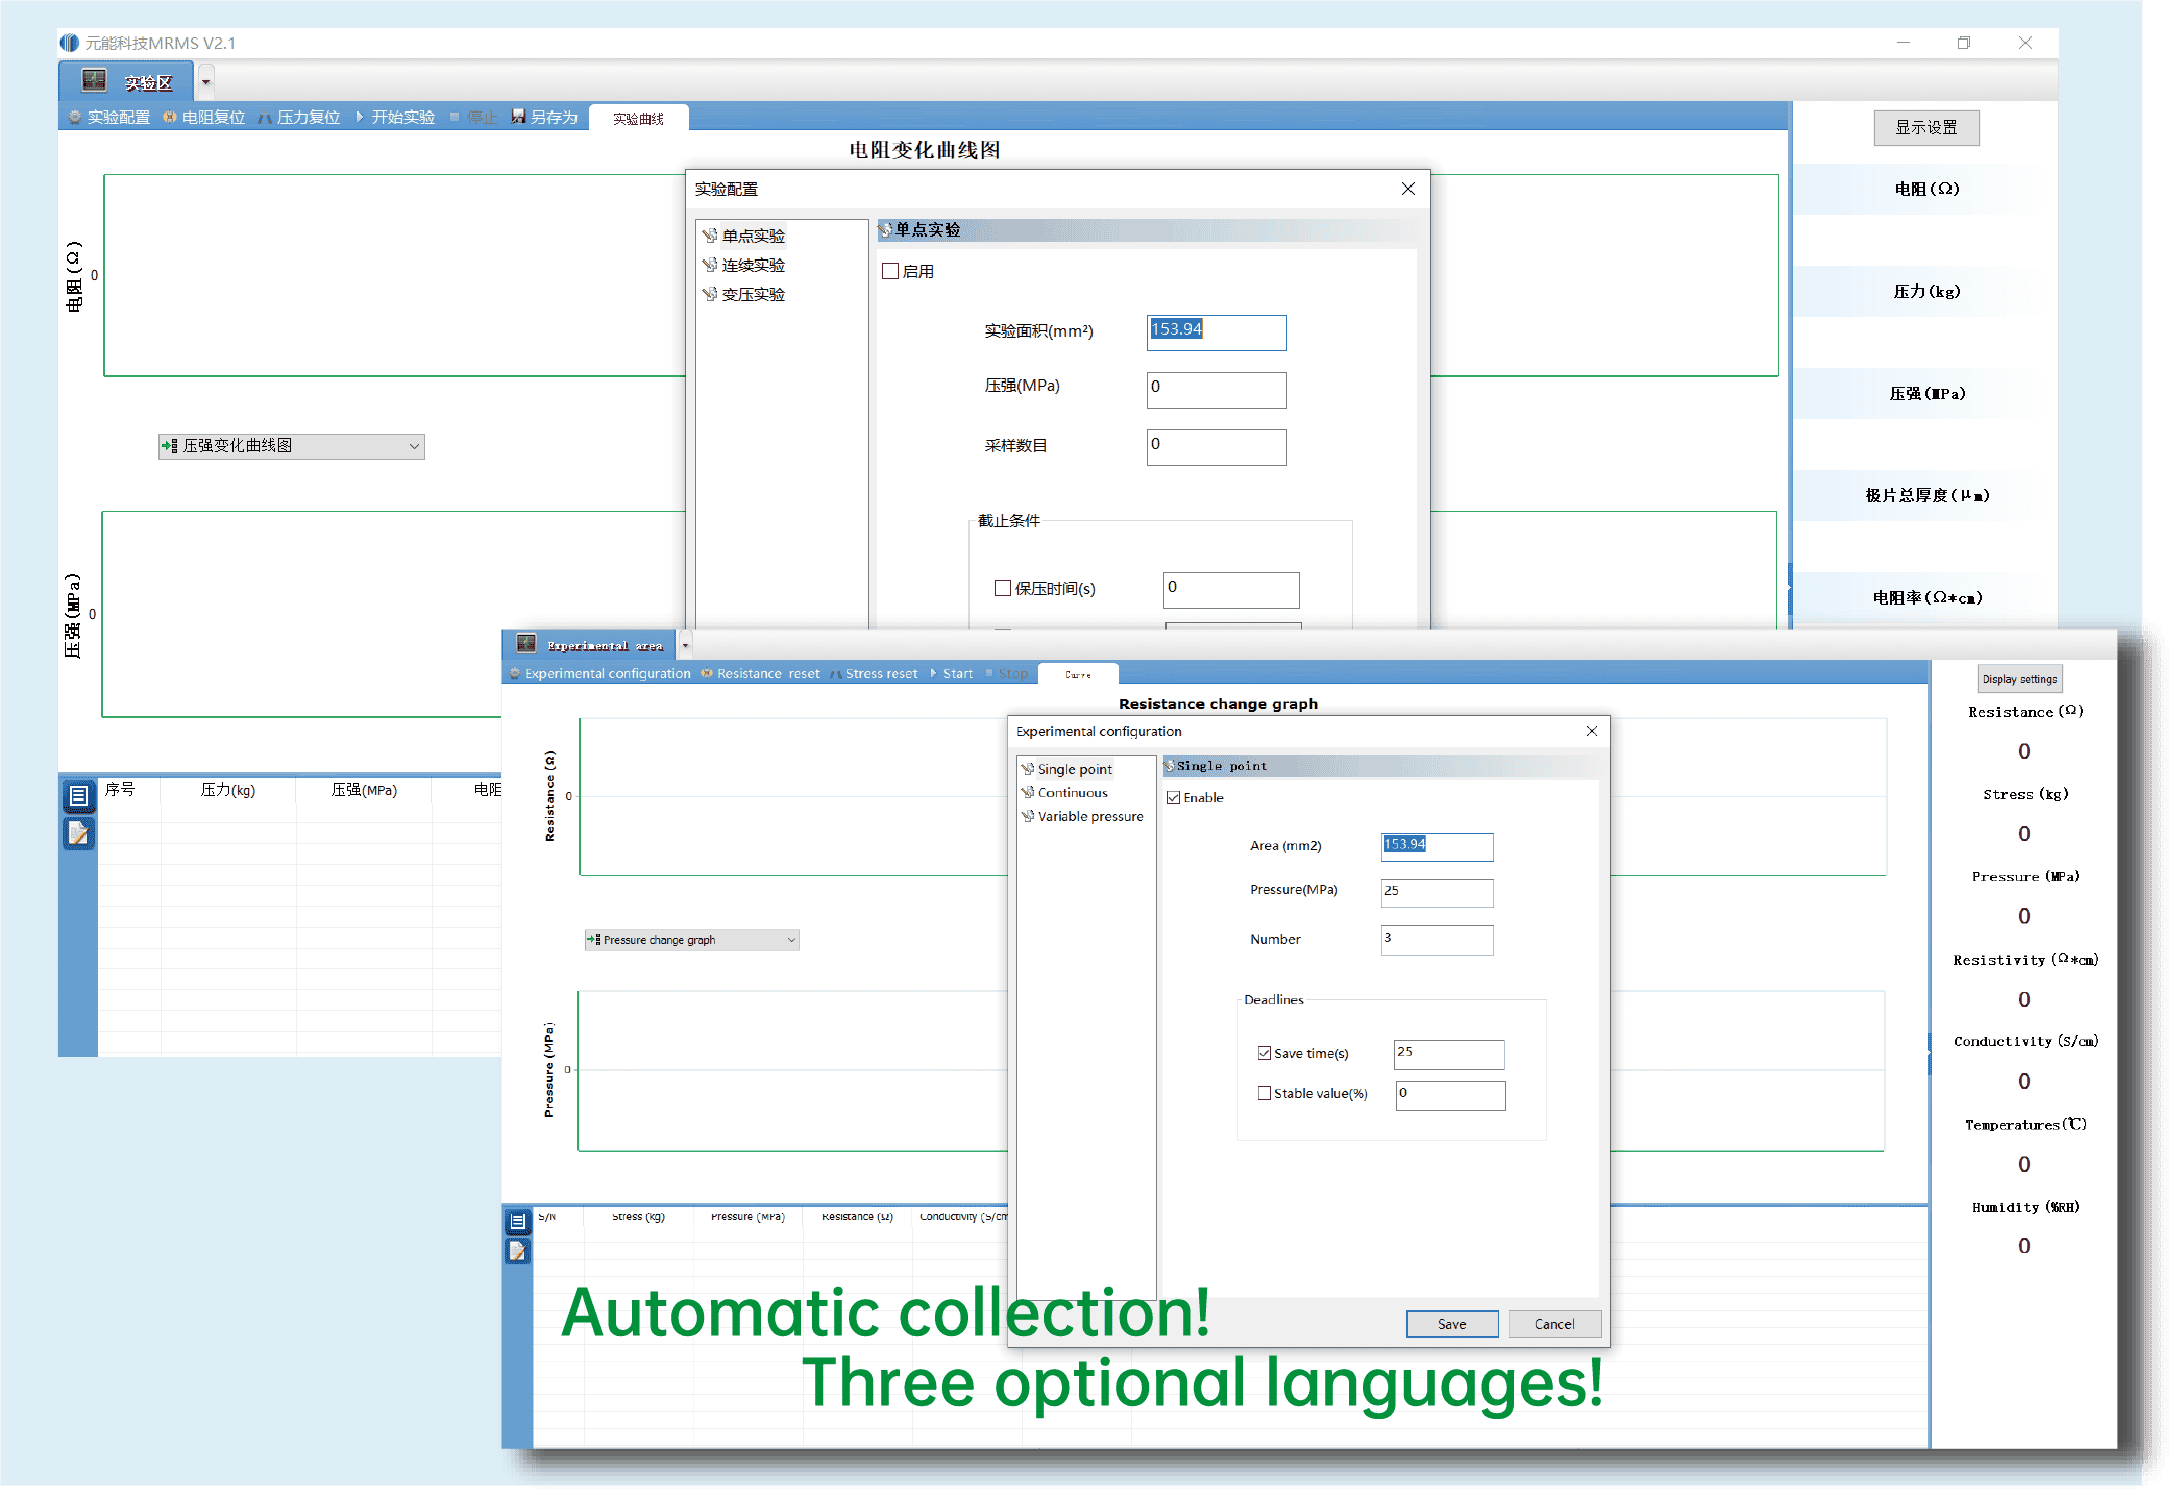
| Fully Automated Software | − | ● | ● | ● | |
| Thickness Measurement | − | − | − | Range: 0 ~ 5 mm Resolution / Accuracy: 0.1 μm / ±1 μm |
|
| Compacted Density Curve | − | − | − | Electrode resistance, resistivity, and conductivity vs. compacted density curves | |
| Optional Features | In-situ Double-Sided (A/B) Electrode Testing, Automatic Sample Feeder | ||||
| Specifications |
1. Dimensions (W×D×H): 355 × 321 × 560 mm
2. Weight: 70 kg
3. Rated Power: 100 W
|
1. Dimensions (W×D×H): 355 × 321 × 795 mm
2. Weight: 83 kg
3. Rated Power: 450 W
|
|||