-
iestinstrument

1. Abstract
Gas evolution during overcharge is a critical safety and performance concern for lithium-ion cells. Using a dual-channel, temperature-controlled In-Situ Gassing Volume Analyzer (GVM2200), we performed in-situ overcharge gas evolution tests on NCM523‖graphite pouch cells (nominal 1,000 mAh) to compare how two cathode variants (C1, C2) and two additive families (E1, E2) influence gas production. Cells were charged at 1C CC to 5.0 V at 25°C while the GVM2200 recorded real-time volume change, voltage, current, and capacity.
Key findings from this battery gas analysis:
- Cathode gas generation increases monotonically with additive loading (0 → 5 wt%) for both additive families.
- Cathode variant C2 releases substantially more gas than C1 under identical conditions, indicating material-dependent lattice oxygen release.
- Additive identity (E1 vs E2) shifts the onset voltage for gas evolution without significantly changing total gas volume at equivalent concentrations.
- At 5 wt% additive loading, many cells failed to reach the 5.0 V cutoff — rapid cathode gas formation degraded electrode contact and increased polarization.
2. Introduction: Why Gas Evolution During Overcharge Matters
Gas evolution in lithium-ion batteries during overcharge reflects the intersection of cathode structural instability and electrolyte reactivity — and understanding it through in-situ battery gas analysis is essential for both safety assurance and electrolyte formulation. Lithium-ion batteries undergo a complex set of chemical and electrochemical reactions during overcharging, including reversible phase transitions and irreversible structural changes in the electrode materials, as well as oxidation reactions of electrolyte components.
For Ni-rich cathode materials such as NCM, lattice oxygen — the oxygen atoms forming part of the layered oxide crystal structure — can be released from the cathode at high voltage and high SOC when the structure destabilizes. Lattice oxygen release refers to the process by which structurally bound oxygen in Ni-rich cathode lattice sites is expelled as the material approaches full delithiation, triggering further oxidation of adjacent electrolyte molecules and generating gases including CO₂, CO, and other volatile species. This cathode gas production causes cell swelling, increases internal pressure, and can trigger cascading thermal events under extreme conditions.
In-situ gas evolution testing with controlled overcharge conditions reveals both material vulnerabilities and electrolyte incompatibilities that remain hidden in standard cycling tests. Figure 1 shows in-situ gas composition changes during NCM811 overcharging monitored by OEMS, illustrating the range of species produced during cathode gas evolution.1
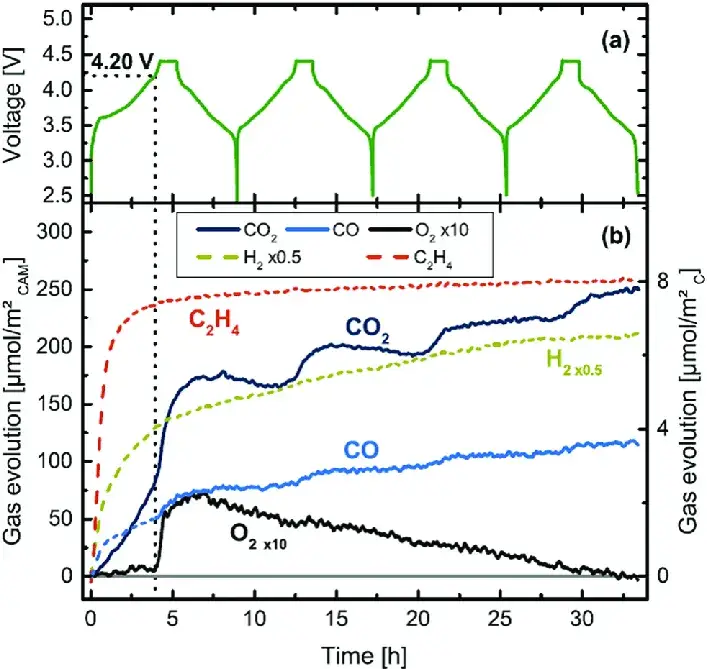
Figure 1. In-situ gas composition monitoring of NCM811 during overcharging.1
3. Experimental Equipment and Test Methods
3.1 Experimental Equipment
The IEST GVM2200 In-Situ Gassing Volume Analyzer was used for all gas evolution tests. The GVM2200 operates within a temperature range of 20°C to 85°C and supports simultaneous dual-channel testing (2 cells in parallel), enabling direct side-by-side battery gas analysis under identical conditions. Real-time volume change, temperature, current, voltage, and capacity are recorded continuously throughout the overcharge protocol.
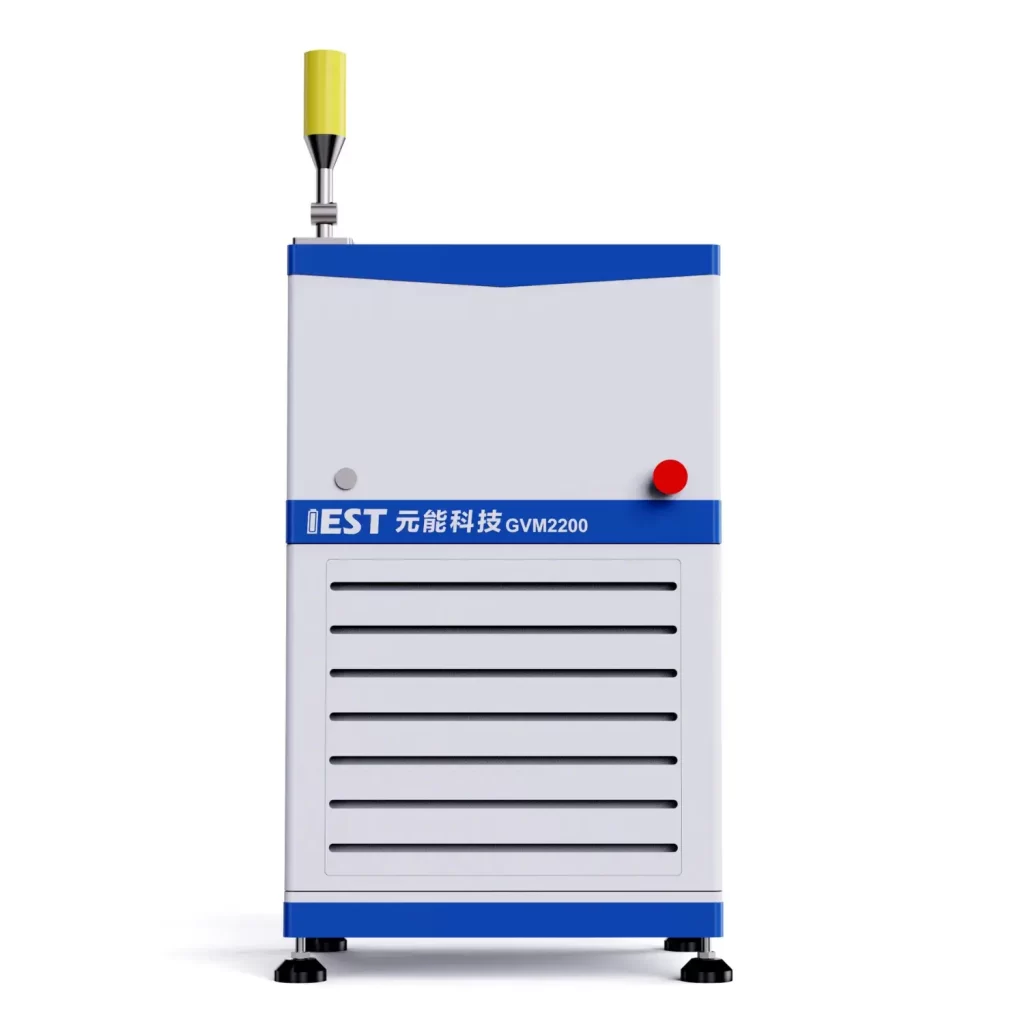
Figure 2. The IEST GVM2200 In-Situ Gassing Volume Analyzer
🔬 IEST GVM2200 In-Situ Gassing Volume Analyzer
The GVM2200 enables in-situ battery gas analysis throughout charge, discharge, formation, and overcharge protocols — without interrupting the electrochemical test or requiring cell disassembly.
- Volume resolution: 1 µL — captures early-onset cathode gas before swelling becomes macroscopic
- Temperature range: 20–85°C controlled oil-bath environment
- Channels: Dual-channel simultaneous testing for direct side-by-side battery gas analysis
- Synchronized data: Real-time volume, voltage, current, and capacity recorded together
- Software: MISG — automatic gas volume curve generation alongside electrochemical performance curves
3.2 Test Parameters
Cells were charged at 25°C using a 1C constant-current (CC) protocol until reaching a 5.0 V upper voltage limit. This overcharge protocol — extending well beyond the standard 4.2–4.35 V operating window — deliberately drives cathode structural instability to quantify gas evolution onset and total gas output under accelerated stress conditions.
3.3 Test Method
Each cell was initially weighed (m₀) before placement into the designated GVM2200 channel. Using the MISG software, the cell ID and sampling frequency were configured. The GVM2200 automatically recorded continuous data for volume change, temperature, current, voltage, and capacity throughout the gas evolution test, without interrupting the overcharge protocol.
4. In-Situ Overcharge Gas Evolution Analysis
4.1 Charge Curves and Volume Expansion vs Cathode Material and Additive
In-situ gas evolution measurements directly link voltage profile behavior to real-time cathode gas output — and both cathode chemistry and additive concentration exert independent, quantifiable effects. The voltage profiles and corresponding volume change curves for the cells are presented in Figures 3(a), 3(b), and 3(c). Two cathode materials (C1 and C2) were paired with two electrolyte additive types (E1 and E2) at varying concentrations (0%, 1%, 2%, 3%, 5%).
Three key observations emerge from the in-situ battery gas analysis data:
- Cathode material effect (Figures 3a vs 3b — same electrolyte, different cathode): Gas volume increases significantly with higher additive content for both cell groups, confirming that additive oxidation is a primary driver of cell swelling. The C2 cathode consistently produced higher total cathode gas volume than C1 under identical conditions — indicating that C2 possesses inferior structural stability at high voltages and releases more lattice oxygen to react with the electrolyte.
- Additive type effect (Figures 3a vs 3c — same cathode, different electrolyte): Gas volume again increases with additive concentration, but the total gas volume produced by E1 and E2 additive groups was nearly identical at equivalent concentrations. This result indicates that additive type does not significantly affect total cathode gas yield — its primary effect is on gas onset voltage.
- High additive loading (5 wt%): In all three datasets, cells with 5% additive failed to reach the 5.0 V cutoff. Excessive gas formation at this concentration impaired interfacial contact between electrodes and increased cell polarization before the voltage setpoint was achieved.
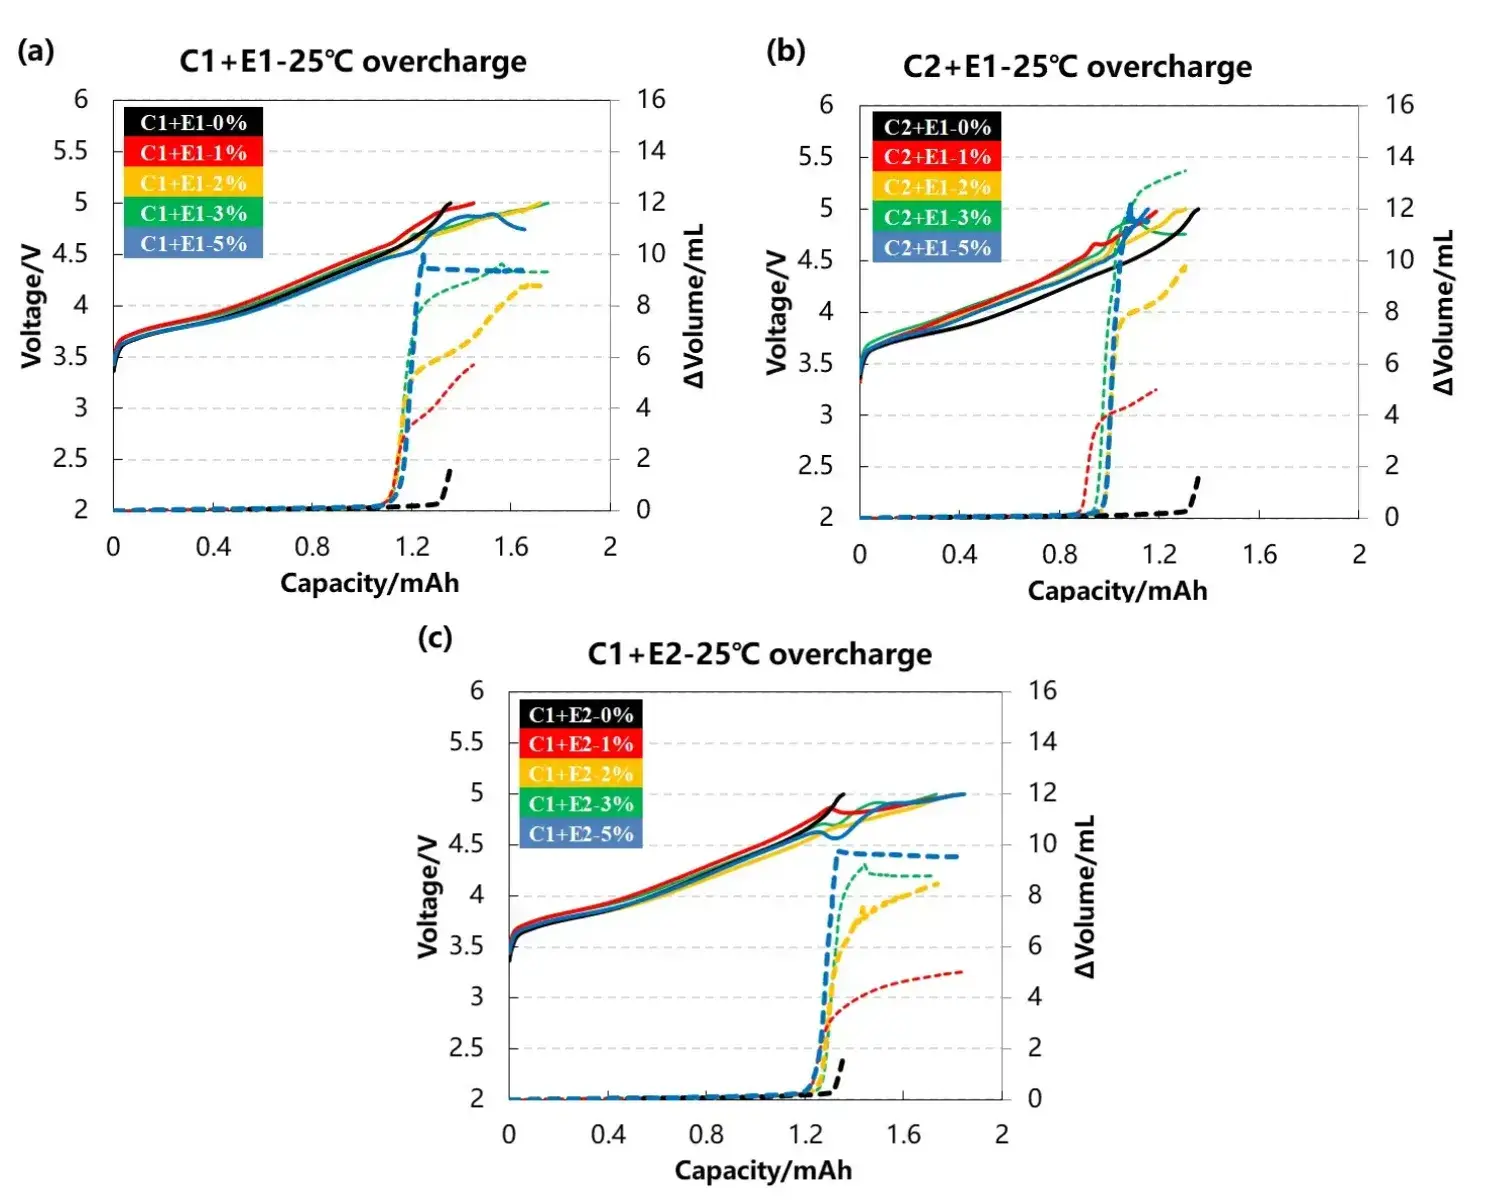
Figure 3. Cell voltage and gas evolution curves for different cathode materials (C1, C2) and electrolytes (E1, E2) at 0–5 wt% additive loading during overcharge.
4.2 Total Gas Volume and Gas Onset Voltage
Cathode material identity and additive concentration govern total gas volume, while additive type primarily controls gas onset voltage — these are independently tunable parameters for electrolyte formulation. Table 1 and Figure 4 summarize the total gas volume and inflection-point (onset) voltage from the gas evolution curves for all three cell groups.
As additive content increased from 0 to 5 wt%, total cathode gas volume rose progressively for both E1 and E2 additive types. Cells incorporating the C2 cathode material consistently exhibited markedly higher total gas evolution at every additive level. For a given additive type, increasing concentration from 1% to 5% produced only minor shifts in gas evolution onset voltage — confirming that onset voltage is a function of additive chemistry rather than additive loading.
| Cell Group | Cathode | Electrolyte | Total Gas Volume ↑ with wt% | Gas Onset Voltage | Key Finding |
|---|---|---|---|---|---|
| Group 1 (Fig 3a) | C1 | E1 (0–5 wt%) | Moderate increase | Reference | Lower cathode gas vs C2 |
| Group 2 (Fig 3b) | C2 | E1 (0–5 wt%) | Higher increase vs C1 | Similar to Group 1 | C2 releases more lattice oxygen |
| Group 3 (Fig 3c) | C1 | E2 (0–5 wt%) | Similar to Group 1 | Shifted vs E1 | Additive type shifts onset voltage |
| Electrolyte additive ratio | Gas production / ml | Inflection point Voltage / V | ||||
|---|---|---|---|---|---|---|
| C1+E1 | C2+E1 | C1+E2 | C1+E1 | C2+E1 | C1+E2 | |
| 0% | 1.625 | 1.625 | 1.625 | 4.99 | 4.99 | 4.99 |
| 1% | 5.708 | 5.068 | 5.005 | 4.61 | 4.583 | 4.77 |
| 2% | 8.786 | 9.783 | 8.457 | 4.54 | 4.543 | 4.70 |
| 3% | 9.335 | 13.479 | 8.785 | 4.57 | 4.58 | 4.70 |
| 5% | 9.391 | 11.522 | 9.549 | 4.52 | 4.52 | 4.65 |
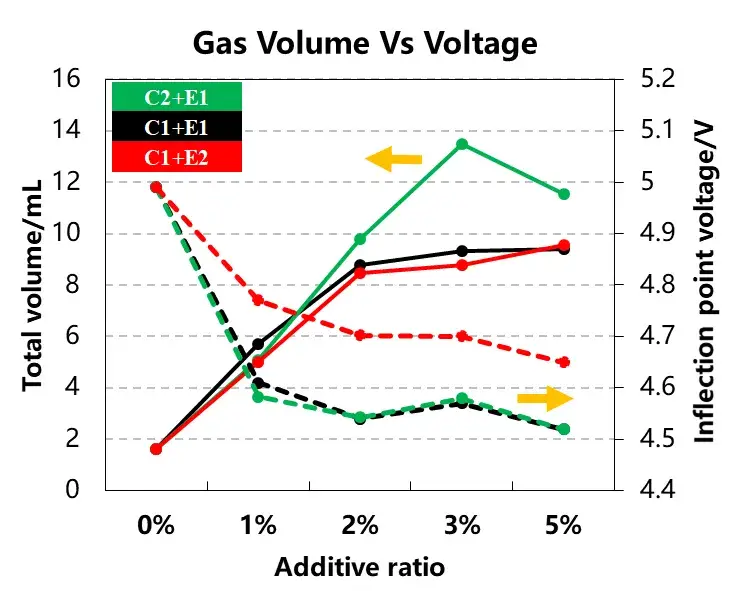
Figure 4. Gas volume and gas evolution onset voltage curves for different cathode materials and electrolytes.
5. Mechanistic Interpretation: Why Cathode Gas and Gas Onset Voltage Differ
Two primary mechanisms govern the observed patterns in this gas evolution test, and they interact synergistically:
-
Cathode lattice oxygen release: At high SOC and high potential, certain layered Ni-rich oxides destabilize and release lattice oxygen from the cathode structure. This freed oxygen oxidizes electrolyte molecules, producing CO₂, CO, and other gases — the primary source of cathode gas in this study. A cathode that releases more lattice oxygen at a given potential (C2 in these tests) will therefore show higher total gas output. The volume of gas that can be released at the cathode is directly proportional to the degree of structural instability at high voltage and SOC.
-
Electrolyte/additive oxidation pathways: Additives alter oxidative decomposition routes — either by forming protective cathode-electrolyte interphase (CEI) species that suppress lattice oxygen-driven reactions, or by generating reactive intermediates that accelerate gas-forming reactions. Higher additive concentrations increase the available reactant pool, explaining the monotonic rise in total gas volume with additive wt%. Additive identity — rather than concentration — determines which oxidation pathways are accessible, thereby shifting the gas onset voltage without proportionally changing total gas yield.
Critically, these two mechanisms interact: a cathode that releases lattice oxygen at lower potentials can trigger additive oxidation earlier, amplifying cathode gas evolution and reducing the effective gas onset voltage for the full cell.
6. Summary
This in-situ overcharge gas evolution test — conducted using the temperature-controlled IEST GVM2200 — quantified how cathode chemistry and electrolyte additive loading govern cathode gas production and gas onset voltage during overcharge of NCM523‖graphite pouch cells. Key conclusions:
- Additive wt% controls total gas volume: higher additive loading increases cathode gas output monotonically for both E1 and E2 additive families.
- Cathode material identity is the dominant gas driver: C2 produced significantly more gas than C1 at every additive level, pointing to material-dependent lattice oxygen release as the primary cathode gas mechanism.
- Additive type shifts gas onset voltage — an actionable design parameter for electrolyte formulation teams aiming to push gas evolution onset to higher potentials.
- 5 wt% additive loading is a practical ceiling: excessive gas formation at this concentration impairs electrode contact and prevents cells from reaching the target voltage cutoff.
Combining cathode selection, additive type and concentration tuning, and in-situ gas monitoring with the GVM2200 offers a systematic, data-driven route to control overcharge gas evolution, reduce cell swelling, and improve battery safety margins.
7. References
[1] Roland Jung et al. Oxygen release and its effect on the cycling stability of LiNixMnyCo2O2(NMC) cathode materials for Li-ion batteries. J. Electrochem. Soc. 2017, 164 A1361.
8. FAQs
8.1 What causes gas evolution during lithium-ion battery overcharge, and what gases are produced?
Gas evolution during overcharge is driven by two coupled mechanisms: cathode lattice oxygen release and electrolyte/additive oxidative decomposition. For Ni-rich cathodes like NCM, structural instability at high voltage and SOC causes lattice oxygen — bound within the layered oxide structure — to be expelled from the cathode. This freed oxygen oxidizes adjacent electrolyte molecules, generating CO₂, CO, and other volatile gases (the primary cathode gas species detected by in-situ OEMS). Simultaneously, electrolyte additives undergo oxidative decomposition at high potentials, with the extent of gas generation increasing with additive loading and the onset voltage depending on additive chemistry.
8.2 How is a gas evolution test performed in-situ on a battery cell?
An in-situ gas evolution test uses an instrument — such as the IEST GVM2200 — that immerses the pouch cell in a controlled-temperature fluid bath and continuously measures the total volume change of the cell in real time throughout charging or overcharging, without disassembly. The GVM2200 operates from 20–85°C and supports simultaneous dual-channel testing at 1 µL volume resolution, recording gas volume, voltage, current, and capacity synchronously. This in-situ battery gas analysis captures the exact voltage (gas onset voltage) at which gas generation begins and the total gas volume produced — information unavailable from endpoint-only or teardown measurements.
8.3 What is the difference between cathode gas and anode gas in lithium-ion batteries?
Cathode gas originates from oxidative decomposition driven by lattice oxygen released from the cathode structure (especially Ni-rich NCM or NCA) at high potentials, producing CO₂, CO, and other oxidation products. The volume of gas that can be released at the cathode scales with the degree of structural instability of the cathode material at the operating voltage. Anode gas, by contrast, typically originates from reductive electrolyte decomposition at the negative electrode (graphite or silicon) — primarily during SEI formation or after SEI breakdown — generating H₂ and hydrocarbons. Both can be quantified simultaneously using in-situ gas volume analyzers like the GVM2200.
8.4 How does electrolyte additive concentration affect battery gas evolution during overcharge?
Increasing electrolyte additive concentration (wt%) monotonically increases total gas volume during overcharge, for both additive families tested in this study (E1 and E2 at 0–5 wt%). This is because higher additive loading increases the available pool of reactants for oxidative gas-forming reactions triggered by cathode lattice oxygen. Importantly, the additive type — not concentration — is what shifts the gas onset voltage: E1 and E2 produced nearly identical total gas volumes at equivalent concentrations, but their different oxidation pathways produced different onset potential windows. At 5 wt% loading, gas evolution was severe enough to prevent cells from reaching the 5.0 V cutoff, as electrode contact degradation increased polarization.
8.5 What is gas onset voltage and why is it important for battery safety?
Gas onset voltage (also called gas evolution onset potential) is the cell voltage at which the rate of gas production rises sharply above baseline — the inflection point in the volume-vs-voltage curve from an in-situ gas evolution test. It marks the threshold at which electrochemical conditions become sufficient to drive cathode lattice oxygen release and electrolyte oxidation at a meaningful rate. A higher gas onset voltage is generally desirable: it means the cell can operate at higher SOC without triggering dangerous gas buildup. In this study, additive identity (rather than concentration) was the key variable shifting the gas onset voltage, making additive selection an important lever for battery gas management and safety window design.
