

A lithium-ion battery operates as a “rocking-chair” system, where lithium ions shuttle between the cathode and anode through the electrolyte (Figure 1). During charging, lithium ions migrate from the cathode to the anode, while electrons flow through the external circuit. In discharging, the opposite occurs, generating usable electric power. Since lithium-ion transport directly impacts charging/discharging efficiency, cycle life, and temperature performance, accurate GITT test analysis of ion diffusion is essential for battery optimization.
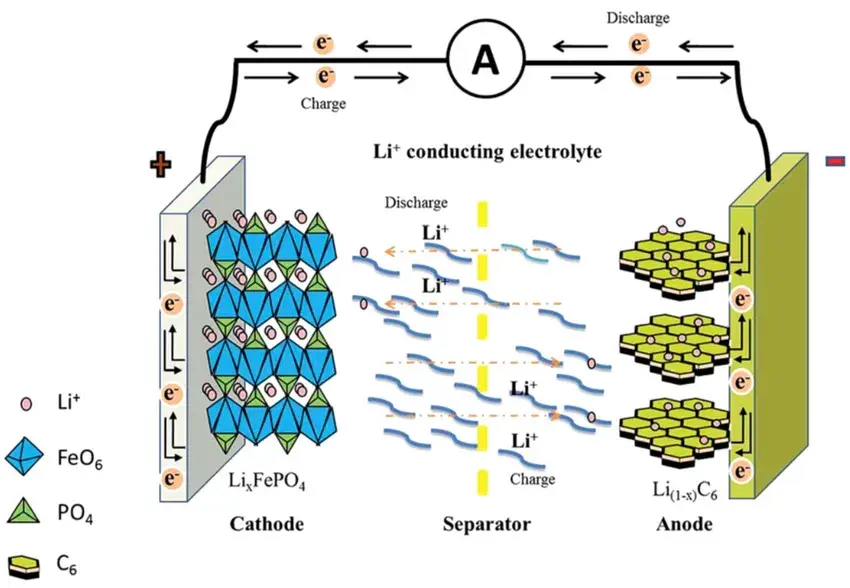
Figure 1. Lithium-ion battery operation measured by the rocking-chair mechanism, demonstrating Li+ ion shuttling between cathode and anode during charge and discharge.
The Galvanostatic Intermittent Titration Technique (GITT) is a widely used electrochemical measurement method for evaluating the lithium-ion diffusion coefficient in battery electrode materials. As a core GITT battery characterization tool, it provides insight into how lithium ions move through electrodes by analyzing the relationship between voltage and time during intermittent current pulses.[1][2]
Before detailing the GITT procedure, it is useful to note where the GITT method sits relative to other kinetic characterization tools. While cyclic voltammetry (CV) and electrochemical impedance spectroscopy (EIS) each capture aspects of reaction kinetics, GITT analysis is distinguished by producing a continuous $D_{Li^{+}}$ profile across the entire SOC range using a single, direct measurement sequence — a comparison developed further in Section 6.3.
The overall GITT process consists of a series of “pulse–constant current–relaxation” steps (Figure 2). Each pulse–relaxation step charges or discharges the battery by applying a constant current for a fixed period of time, then disconnecting the current and recording the resulting voltage change over time. The two critical inputs to the GITT test are the constant current magnitude and the accuracy of the recorded voltage. During the relaxation phase after the current is disconnected, lithium ions must be allowed to diffuse fully within the active material; the diffusion coefficient is then calculated from the relationship between voltage and time.
To satisfy the core GITT assumption that diffusion mainly occurs in the surface layer of the solid-phase material, the test conditions must meet the following limitations:
Key conditions for GITT analysis:
The pulse time $\tau$ must be short enough to satisfy the condition \( \tau \ll L^2/D \), where L is electrode thickness and D is diffusion coefficient.
The relaxation time must be long enough to allow lithium ions to reach equilibrium within the active material.
Through this approach, the GITT battery method effectively captures the voltage response linked to ion transport kinetics.
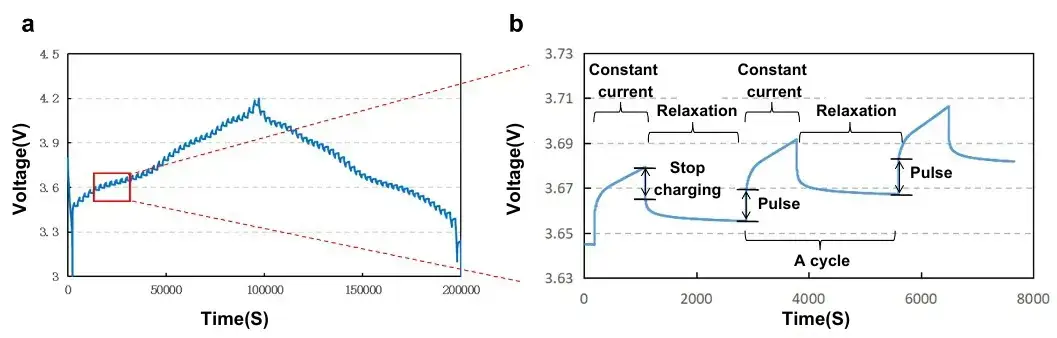
Figure 2. (a) GITT test curve and (b) localized zoomed-in schematic
GITT test data allows the corresponding diffusion coefficient to be calculated using the following core GITT equation:
Validity Condition: \( \tau \ll L^2/D \), where \( \tau \) is the current pulse duration, \( L \) is the electrode thickness, and \( D \) is the diffusion coefficient to be determined. This condition is essential to ensure the test conforms to the “semi-infinite diffusion” model.
$D$ = lithium-ion diffusion coefficient
$m_B$ = active material mass
$V_m$ = molar volume of electrode
$M_B$ = relative molecular mass
$S$= electrode surface area
\( \tau \) = relaxation time
\( \Delta E_t \) = voltage change during current pulse
\( \Delta E_s \) = voltage change during relaxation phase
By substituting $\Delta E_s$, $\Delta E_t$, and the material constants into the equation, precise values for $D$ are obtained. The voltage changes recorded during a GITT test reflect not only surface diffusion but also the voltage change associated with the SOC shift. The central challenge in GITT analysis is accuracy: shorter pulse times improve theoretical precision but reduce the magnitude of $\Delta E_s$, requiring highly accurate instruments. For example, the IEST analyzer achieves 0.01% measurement accuracy across 8 testing channels, supporting reliable GITT battery characterization.
Researchers investigated changes in the lithium-ion diffusion coefficient during charging and discharging of LiNi0.8Co0.1Mn0.1O2 (NCM811) using the GITT test.[3] The value of $D_{Li^{+}}$ varied significantly across different SOC states:
At the start of charging, $D_{Li^{+}}$ increased as lithium ions were released, reached a maximum at a lithium content of approximately 0.5, and then gradually decreased; the diffusion coefficient dropped rapidly once lithium content fell below 0.2. During discharge, $D_{Li^{+}}$ was extremely high at the outset, decreased slightly, and remained high as lithium ions were inserted. When lithium-ion embedding content reached 0.8, $D_{Li^{+}}$ dropped sharply by three orders of magnitude — a low embedding kinetics effect that explains the capacity loss observed in the first cycle.
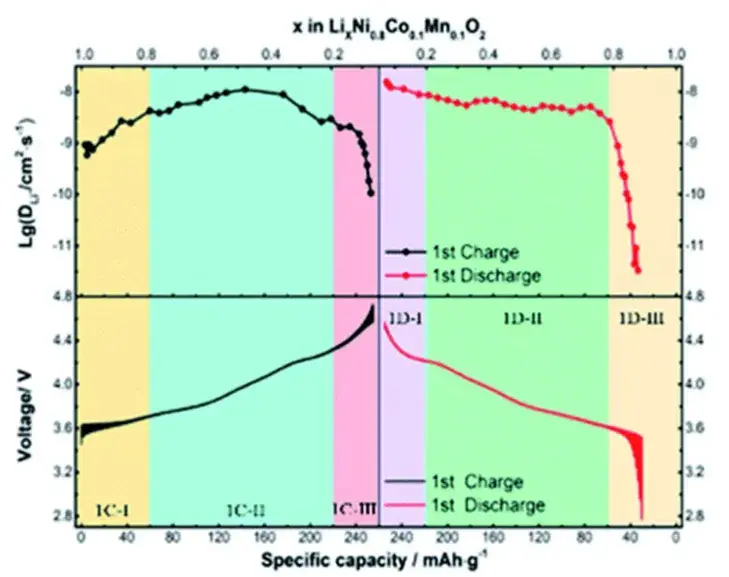
Figure 3. LiNi0.8Co0.1Mn0.1O2 (NCM811) measured by GITT test, demonstrating $D_{Li^{+}}$ variation of 10-7 to 10-11 cm2 s-1 across the first charge–discharge cycle.
Researchers introduced high-entropy elements (Cr, Mn, Fe, Zn, Al) into the NASICON-structured Na3V2(PO4)3 (NVP) to obtain Na3V1.8(CrMnFeZnAl)0.2(PO4)3 (HE-NVP-0.2), aiming to tune the material’s crystal structure and diffusion ability.[4] The GITT battery study results (Figures 4a and 4b) show that the HE-NVP-0.2 electrode exhibits improved Na+ diffusion kinetics after the introduction of high-entropy elements. After NVP and HE-NVP-0.2 were assembled into half-cells and rate performance was tested, HE-NVP-0.2 showed significantly better rate performance than the NVP sample (Figure 4c).
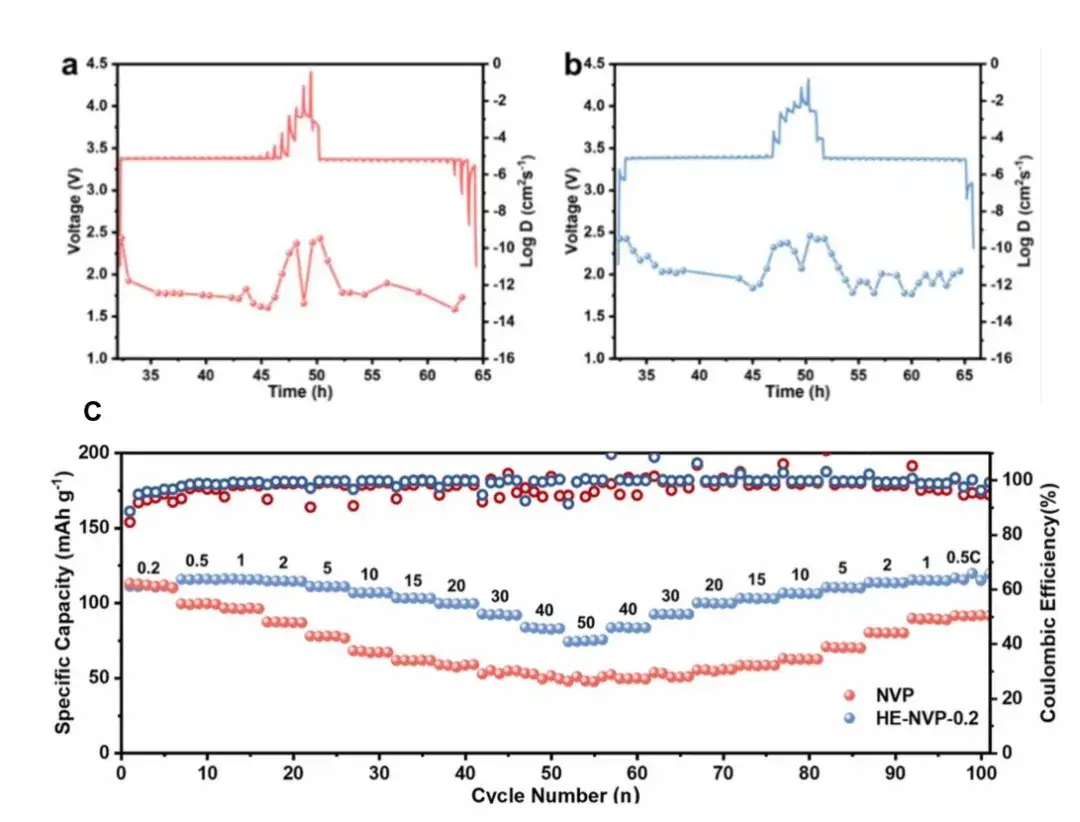
Figure 4. (a) GITT curves and corresponding Na ion diffusion coefficients for NVP and (b) HE-NVP-0.2
| Testing Matrix | Cyclic Voltammetry (CV) | Electrochemical Impedance Spectroscopy (EIS) | GITT Method | Implication for Fast-Charging / Electrode Design |
|---|---|---|---|---|
| Data type | Redox peak snapshot at set scan rates | Frequency-domain impedance spectrum | Continuous DLi+ profile across the full SOC range | GITT supports SOC-resolved charging protocol design; CV/EIS give single-point or model-dependent views |
| Modeling dependency | Low | High — depends on equivalent circuit fitting | Low — direct semi-infinite diffusion relationship | GITT reduces interpretation ambiguity from circuit-model assumptions |
| Primary output | Reaction potential, reversibility | Charge-transfer resistance, SEI resistance | Lithium-ion diffusion coefficient DLi+ | Use GITT specifically to locate SOC ranges with kinetic bottlenecks |
While CV provides a snapshot of redox peaks, GITT analysis provides a continuous map of diffusion kinetics across the entire SOC range. Unlike EIS, which depends heavily on equivalent circuit modeling, the GITT method offers a more direct measurement of ion transport within the solid-phase lattice.
Translating the theoretical framework of GITT analysis into reliable, publication-grade data hinges on the precision and stability of the testing equipment. The core challenge in performing a GITT test lies in accurately measuring the subtle voltage changes—\( \Delta E_s \) (steady-state voltage change after relaxation) and ΔEt (voltage change during the current pulse)—which are fundamental to the GITT diffusion coefficient calculation.
The accuracy of these measurements is critically dependent on two factors: the exceptional stability of the galvanostatic (constant current) source and the microvolt-level resolution of voltage measurement. Any drift or noise can significantly distort these small signals, especially when using short pulse times (\( \tau \)) to satisfy the fundamental assumption \( \tau \ll L^2/D \) for semi-infinite linear diffusion.
To ensure valid data, the instrumentation must reliably capture microvolt-level changes in \( \Delta E_s \) (steady-state voltage change) and ΔEt (voltage change during the pulse). The IEST High-Precision Electrochemical Analyzer addresses these core pain points through:
Exceptional Measurement Precision: With a measurement accuracy of 0.01% FS, the device ensures that even minute voltage fluctuations are recorded with high signal-to-noise ratios.
Aviation-Grade Stability: Reliable multi-channel control allows for consistent current application during short pulses, which is critical for satisfying the theoretical condition \( \tau \ll L^2/D \)
High-Resolution Data Capture: By capturing high-fidelity data even at low magnitudes of \( \Delta E_s \) , the IEST analyzer directly supports more reliable and reproducible GITT analysis across varying SOC states.
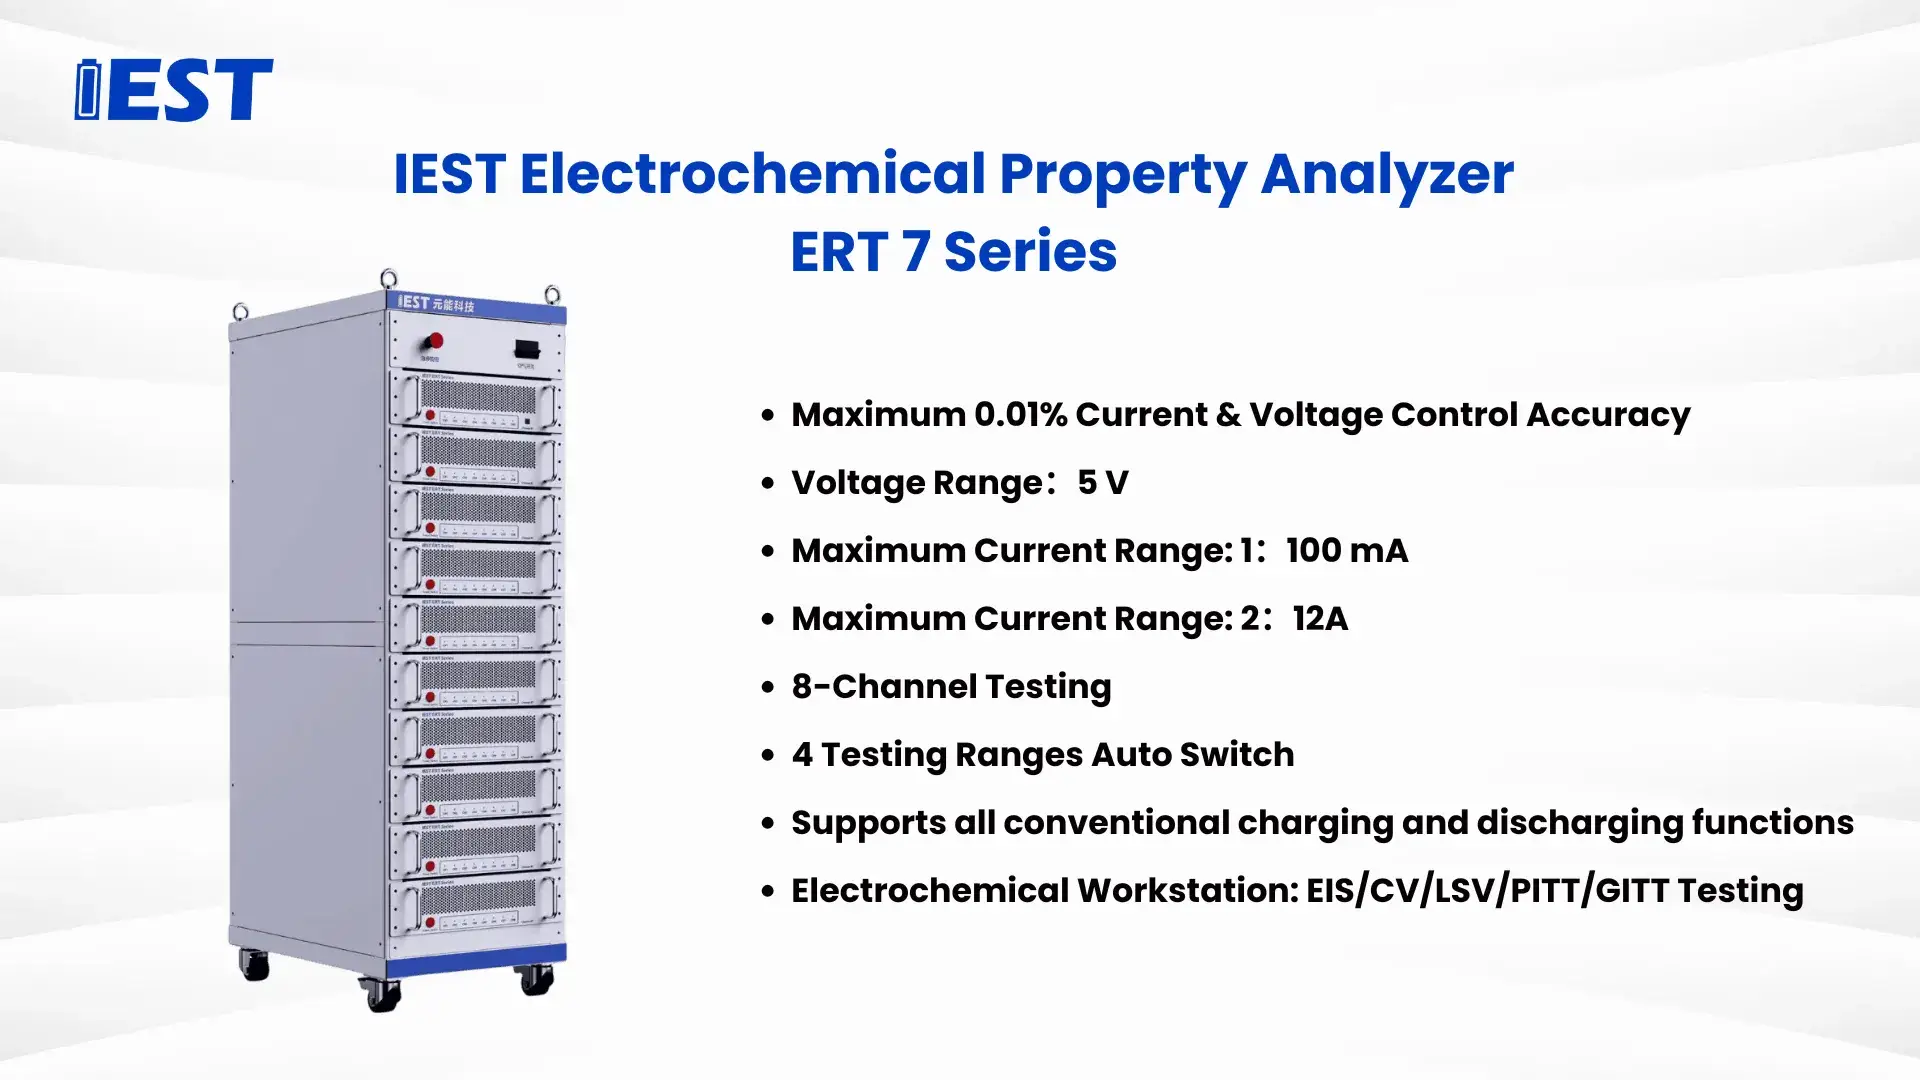
Figure 5. IEST ERT-7 Series Electrochemical Property Analyzer, demonstrating the 8-channel, 0.01% FS accuracy platform used for GITT diffusion coefficient calculation.
A successful GITT test requires careful attention to experimental detail. Beyond understanding what GITT is theoretically, avoiding these common pitfalls is key to obtaining meaningful diffusion kinetics data.
Choosing the correct current pulse time is paramount:
A practical approach is to estimate the diffusion coefficient ($D_{est}$) from literature or a quick experiment, then confirm that the chosen $\tau$ satisfies $\tau \ll L^2/D$.
A common mistake is using a fixed, arbitrary relaxation time. Instead, a voltage stabilization threshold should define the endpoint. For instance, the relaxation phase can be considered complete when the open-circuit voltage changes by less than 0.1 mV over a 5-minute period. This ensures lithium-ion concentration reaches equilibrium throughout the electrode, a prerequisite for an accurate \( \Delta E_s \) value.
A powerful internal check for data quality involves plotting the steady-state voltage change \( \Delta E_s \) for each step against the square root of the pulse time \( \sqrt{\tau} \). For a valid test under Fickian diffusion, this plot of \( \Delta E_s \) versus \( \sqrt{\tau} \) should yield a straight line passing through the origin. Significant deviation from linearity suggests that the test conditions may not meet the model’s assumptions, calling for a re-examination of parameters like pulse duration or electrode homogeneity.
The calculated absolute value of the diffusion coefficient $D$ is directly proportional to the square of the electrode thickness $L$ and is sensitive to the active material mass $m_B$ and coating density. Inaccurate measurement of these geometric and mass parameters is not a minor error — it is systematically magnified in the final result. Meticulous characterization of the electrode itself is therefore as important as the electrochemical measurement for reliable GITT diffusion coefficient calculation.
The diffusion behavior of lithium ions within the active material reflects the microscopic kinetic performance of the battery and strongly affects overall battery performance. Segmented analysis of electrochemical reactions at different charging and discharging depths can effectively identify the key factors driving polarization at each stage. The GITT test provides a direct route to determining the lithium-ion diffusion coefficient $D$, and by extension, a clearer picture of the kinetic processes governing battery behavior.
The IEST ERT-7 Series Electrochemical Property Analyzer provides 0.01% FS measurement accuracy across 8 independent channels, supporting reproducible GITT diffusion coefficient calculation for cathode, anode, and solid-state electrode research.
[1] Nickol A, Schied T, Heubner C, et al. GITT analysis of lithium insertion cathodes for determining the lithium diffusion coefficient at low temperature: challenges and pitfalls[J]. Journal of The Electrochemical Society, 2020, 167(9): 090546.
[2] Tang K , Yu X , Sun J ,et al. Kinetic analysis on LiFePO4 thin films by CV, GITT, and EIS[J].Electrochimica Acta, 2011, 56(13):4869-4875.
[3] Hong C, Leng Q, Zhu J, et al. Revealing the correlation between structural evolution and Li+ diffusion kinetics of nickel-rich cathode materials in Li-ion batteries[J]. Journal of materials chemistry A, 2020, 8(17): 8540-8547.[4] Zhou Y, Xu G, Lin J, et al. A Multicationic-Substituted Configurational Entropy-Enabled NASICON Cathode for High-Power Sodium-Ion Batteries[J]. Nano Energy, 2024: 109812.
GITT is a precise electrochemical method used to measure the lithium-ion diffusion coefficient (D) inside battery electrode materials. It applies short, constant-current pulses followed by relaxation periods, analyzing the voltage response to quantify how fast ions move within the solid phase — a key input to understanding rate capability and reaction kinetics.
The GITT diffusion coefficient calculation primarily uses the formula: D = (4/πτ) * (mB Vm / MB S)² * (ΔEs / ΔEt)², where τ is pulse time, ΔEs is the steady-state voltage change after relaxation, and ΔEt is the voltage change during the current pulse. Accurate measurement of these small voltage steps is critical, requiring high-precision instrumentation.
The core assumption is that the current pulse time (τ) must be very short relative to the diffusion time constant (τ << L²/D), ensuring ion diffusion is confined near the electrode surface. If the pulse is too long, the calculation becomes invalid. Additionally, the method assumes one-dimensional diffusion and negligible charge-transfer resistance, which may not always hold true.
A standard charge/discharge curve shows voltage against continuous capacity at a constant current. A GITT curve instead shows a staircase pattern of alternating current-pulse segments and open-circuit relaxation segments, from which ΔEs and ΔEt are extracted at each step for diffusion coefficient calculation.
The GITT method applies a constant current pulse for a fixed duration, records the voltage drop ΔEt, then rests the cell until voltage stabilizes to record ΔEs, and repeats this sequence across the SOC range. Selecting the right GITT test equipment depends on current stability and voltage resolution; the IEST ERT-7 Series Electrochemical Property Analyzer supports this workflow with 0.01% FS accuracy across 8 channels.
