-
iestinstrument
High-Frequency Impedance Spectroscopic Analysis of Argyrodite-Type Sulfide-based Solid Electrolyte upon Air Exposure
1. Abstract
Sulfide-based solid electrolyte have attracted considerable attention for application in solid-state lithium batteries because of their high ionic conductivities, suitable mechanical properties, and successful operation with various active anode and cathode materials. However, sulfides react with traces of moisture to generate toxic H2S gas. This undesirable degradation reaction reduces lithium ionic conductivity, which is crucial to solid-state batteries. To understand the effect of moisture degradation on solid electrolyte particles, impedance spectroscopic measurements at high frequencies (up to 100 MHz) were performed at various temperatures. From the spectral analysis results, we separated the impedance components into grain boundaries and the internal bulk of the solid electrolyte particles before and after exposure to moist air. By calculating the activation energy of lithium ionic conduction from the temperature dependence of each impedance component (Arrhenius plot), we determined that the impedance and activation energy of the grain boundaries between the solid electrolyte particles increased. This indicates that lithium ionic conduction between the solid electrolyte particles was inhibited during the initial stage of exposure to moist air.
From the electrochemical impedance spectroscopy results, the authors compared the impedance of sulfide solid electrolyte particles before and after exposure to humid air, focusing on ion transport through the particle interiors and grain boundaries. By analyzing the ionic impedance at various temperatures and calculating the activation energy of ionic conductivity (using an Arrhenius plot), it was found that as the temperature increases, the ionic impedance and activation energy at the grain boundaries of the solid electrolyte also increase. This indicates that in the initial stage of exposure to humid air, lithium-ion conduction between the solid electrolyte particles is inhibited.
2. Sample Preparation and Testing
The argyrodite-type sulfide solid electrolyte Li7-xPS6-xClx (LPSCl, x~1, D50~3.5 μm, Mitsui Mining & Smelting, Japan) was used as the experimental subject. The LPSCl powder was exposed to air with a dew point temperature of -20°C at a flow rate of 0.8 L*min-1 for 1 hour. The samples were designated as Ref.SE and Exposed.SE, respectively.
An EIS measurement system equipped with a temperature control module (4990EDMS120K, Lakeshore 33x, TOYOTech, Japan) was used to conduct EIS measurements in the high-frequency range (up to 100 MHz). Prior to measurement, the solid electrolyte powder was pressed into pellets through the following steps: 50 mg of the solid electrolyte powder sample was placed in a zirconia cylinder with an inner diameter of 7 mm and pressed into a pellet under a pressure of 200 MPa. The pellet was then removed for measurement. The EIS measurement frequency range was from 100 MHz to 20 Hz, with temperatures ranging from 180 to 298 K. The normalized impedance value Z (unit = [Ω·cm]) was calculated as Z = (Zm × S) / d, where S is the pellet area (diameter of 7 mm) and d is the thickness (typically 0.9 ± 0.01 mm).
The powder resistivity and compaction density tester(PRCD), independently developed by IEST, can be used for pellet testing. Equipped with a custom-made sealing mold, this device allows in-situ testing of the ionic conductivity of solid electrolytes under different pressures, up to a maximum of 600 MPa. Figure 1 shows the equivalent circuit diagram fitted from the EIS data.
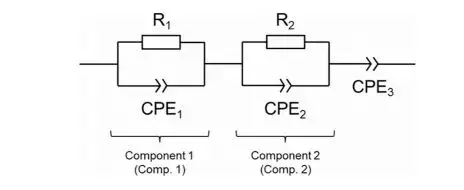
Figure 1. Equivalent circuit diagram fitted from the EIS data
3. Results Analysis
Figure 2 shows the EIS data measured at 298 K before and after exposure of the sample to air. In the Nyquist plot, the Exposed SE exhibits a larger semicircle, indicating an increase in ionic resistance after air exposure. Through fitting calculations, the lithium ion conductivity of the sample was approximately 0.70 mS*cm−1 before exposure and 0.28 mS*cm−1 after exposure to air, representing a decrease to 40% of its original conductivity. This trend is consistent with data reported in relevant literature. However, at room temperature, the Nyquist and Bode plots do not distinctly separate the bulk impedance and grain boundary impedance components of the material. This is because sulfide-based solid electrolytes exhibit high ionic conductivity, resulting in small absolute impedance values even at high frequencies like 100 MHz, without clear differentiation. Therefore, at room temperature, it is challenging to quantitatively determine whether the decrease in lithium-ion conductivity after air exposure is predominantly influenced by bulk impedance or grain boundary impedance of the material.
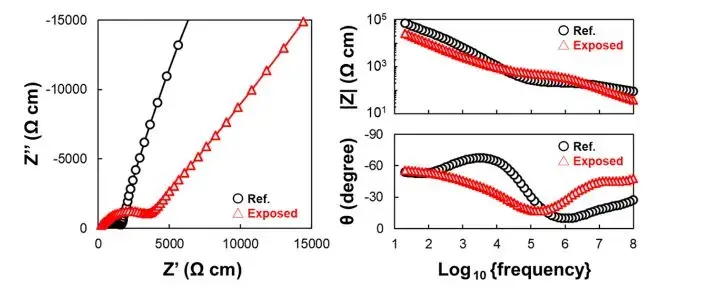
Figure 2. Nyquist and Bode plots of the solid electrolyte before and after exposure to air
Therefore, to more accurately distinguish between the bulk impedance and grain boundary impedance components of the material, the authors conducted EIS measurements at lower temperatures on the sample not exposed to air (Ref.SE) and calculated its ionic conductivity activation energy. The test results are shown in Figure 3. Figures 3a-d depict Nyquist and Bode plots obtained for the samples before and after exposure to air at temperatures ranging from 180 to 250 K. In comparison to the spectra at 298 K (Figure 2), the Nyquist plots clearly show pseudo-capacitive components existing in the form of two semicircles representing different elements. Figure 3e summarizes the capacitance values C1 and C2 calculated from the equivalent circuit fitting at each temperature, revealing consistent values of approximately ~10−12 and ~10−11F for C1 and C2, respectively, which align with results reported in relevant literature. Specifically, the two parallel R-CPE components, R1-CPE1 and R2-CPE2, correspond to bulk impedance and grain boundary impedance of the material.
Figure 3 presents the Arrhenius plot of the ionic conductivity components at different temperatures. The linear fits yielded activation energies Ea1 and Ea2 for the bulk and grain boundary ionic conductivities, respectively, measured at 33 and 36 kJ*mol−1. Notably, the activation energy for ionic conductivity at the grain boundaries of the solid electrolyte interface is slightly higher. This is attributed to the presence of trace substances such as carbonates or adsorbed water on the particle surfaces, which have a certain impact on ion transport even in the absence of exposure to air.
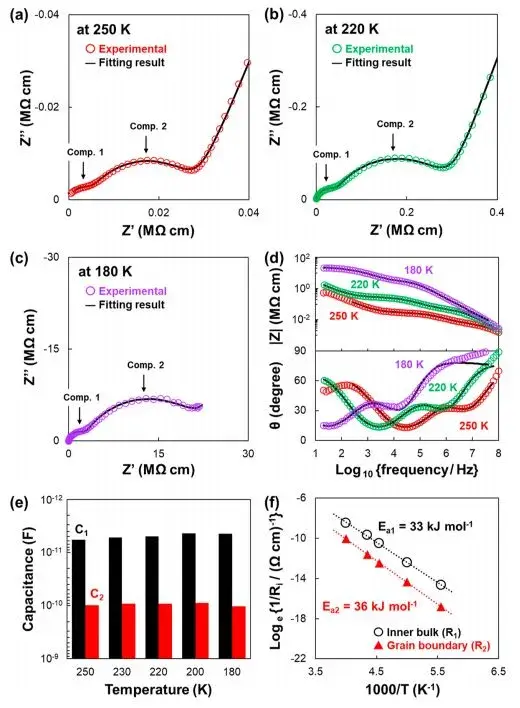
Figure 3. EIS test results and Arrhenius plots for samples not exposed to air (Ref. SE)
Similar tests were also conducted on the sample exposed to air (Exposed SE), and the results are shown in Figure 4. In the low-frequency region, a significant increase in impedance component R2, corresponding to the grain boundary, can be observed, indicating an increase in interfacial impedance between particles after air exposure. Additionally, the activation energy Ea2 corresponding to the grain boundary component of ionic conductivity also increased. Meanwhile, even after exposure to air, there were no significant changes observed in the particle bulk impedance R1 component and activation energy Ea1. As shown in Figure 5, combining the EIS data plots before and after exposure to air at 220 K clearly demonstrates minimal change in impedance component 1 (internal volume) while component 2 (grain boundary) shows a significant increase.
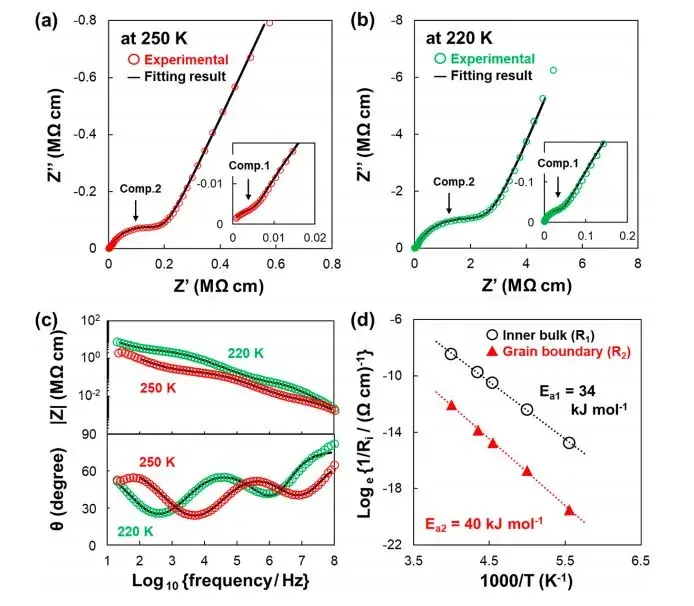
Figure 4. Presents the EIS test results and Arrhenius plot for the sample exposed to air (Exposed SE).
In summary, the internal bulk impedance of the solid electrolyte is almost unaffected by the moisture content in the air. This is consistent with the XRD testing results previously conducted by the authors, which indicated no significant changes in the internal volume regions of the solid electrolyte particles during the early stages of exposure to air. The study also demonstrates the decrease in ionic conductivity, which our extensive surface analysis previously confirmed is due to various decomposition products such as phosphates (P-O bonds), sulfates (S-O bonds), carbonates (CO32-), thiols (-SH groups), and hydration species on the surface of the solid electrolyte particles exposed to trace amounts of humid air. Since the ionic conductivity of the first three compounds is significantly lower than that of argyrodite-type sulfides, these phases inhibit ion conductivity at grain boundaries. Therefore, the decomposition products on the particle surfaces are considered one of the reasons for the increased grain boundary impedance. The observed increase in grain boundary impedance components in related studies corresponds to hydrolysis and hydration reactions on the surface of solid electrolyte particles. Degradation reactions initiate from the particle surfaces and may diffuse depending on the conditions of air exposure. Combining the results from Figures 2 and 5, after exposure to air, the spectra of the CPE3 component in the lowest frequency region exhibit a relatively flat slope, attributed to electrochemical heterogeneity at the interface between the solid electrolyte and stainless steel electrode.
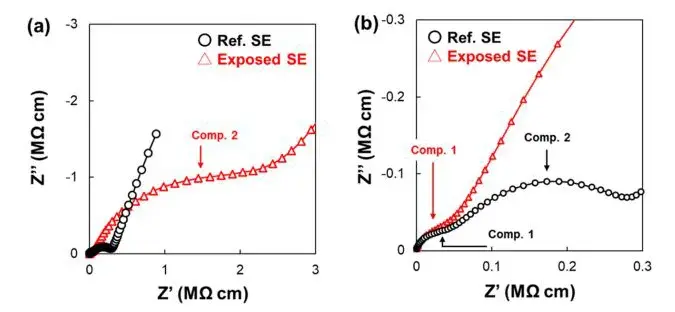
Figure 5. Nyquist plot and enlarged high-frequency region plot of the sample before and after exposure to air at 220 K.
Another possible reason for the increase in grain boundary impedance is the formation of new grain boundaries between the solid electrolyte and nanocrystals during further hydrolysis processes. However, it is challenging to distinguish between nano-crystal impedance and the impedance caused by surface hydrolysis solely through EIS testing. Despite these limitations, high-frequency EIS impedance spectroscopy measurements up to 100 MHz still contribute to identifying positions where the ion conductivity deteriorates due to exposure to air, which makes this measurement method a powerful tool for analyzing the effects of material modifications on sulfide-based solid electrolytes and optimizing the manufacturing processes of all-solid-state batteries.
4. Conclusion
Using a high-frequency (100 MHz) EIS measurement system, we analyzed the argyrodite-type sulfide-based solid electrolyte powder exposed to air at a dew point of -20°C for 1 hour. This measurement system effectively separates impedance components into bulk and grain boundary impedances, which is challenging with traditional low-frequency measurement methods. Analysis of the EIS results showed a significant increase in impedance and activation energy at the grain boundaries after exposure to air. In contrast, the impedance component in the internal bulk volume of the solid electrolyte particles remained nearly unchanged. This increase in specific region impedance is likely associated with localized hydrolysis of sulfide-based solid electrolyte particles and reactions with water on the surface, while the internal volume regions did not undergo corresponding reactions. Thus, the authors successfully demonstrated that using an EIS measurement system with frequencies up to 100 MHz can identify areas where changes in ion conductivity of sulfide-based solid electrolyte powder occur, even when exposed to air with trace moisture content.
5. References
Morino Y, Sano H, Kawaguchi S, et al. High-Frequency Impedance Spectroscopic Analysis of Argyrodite-Type Sulfide-Based Solid Electrolyte upon Air Exposure[J]. The Journal of Physical Chemistry C, 2023, 127(37): 18678-18683.
6. IEST Related Testing Equipment Recommendation
IEST has pioneered a multifunctional testing system specifically designed for solid electrolyte samples (SEMS), an automated device that integrates pressing, testing, and calculating the electrochemical performance of solid electrolytes. The system features an all-in-one design, including a pressing module, electrochemical testing module, density measurement module, and ceramic pressing and clamping module, making it suitable for in-situ testing of various electrolytes such as oxides, sulfides, and polymers.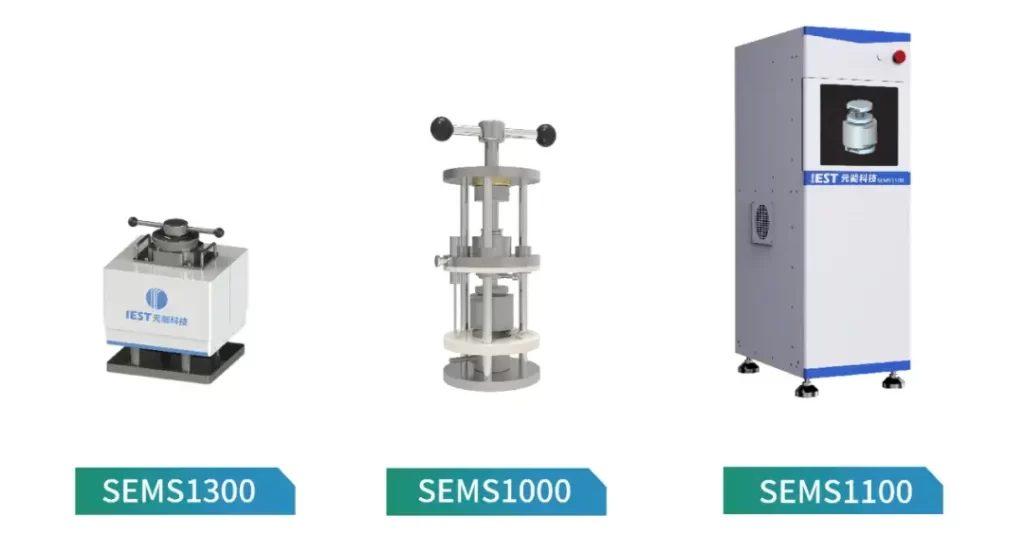
Subscribe Us
Contact Us
If you are interested in our products and want to know more details, please leave a message here, we will reply you as soon as we can.


