-
iestinstrument
In-situ Testing of Volume-Stress-Thickness Variation of Different Silicon Anodes in Pouch Cells
1. Author Information and Article Abstract
In 2017, the J.R.Dahn research group used the in-situ characterization method to test the volume, stress and thickness changes of the electrodes for pouch cells with different silicon-composite negative electrodes, combined with the calculation method, the volume swelling ratio of each component of the silicon composite electrode is quantitatively analyzed, so as to lay the foundation for a deep understanding of the swelling mechanism of silicon-based materials.
2. Experimental Protocol
2.1 In This Experiment, Make Three Kinds of Pouch cells:
(A) Li(Ni1-x-yCoxAly)O2 (NCA)/SiO-graphite (supplier A), fully charged to 4.2V corresponds to 260 mAh;
(B) LiCoO2 (LCO)/Si Alloy-graphite (supplier B), fully charged to 4.35V, the corresponding capacity is 230 mAh;
(C) Li(Ni1-x-yCoxAly)O2 (NCA)/nano Si-C (supplier C), fully charged to 4.4V, the corresponding capacity is 165 mAh;
2.2 In-situ Test Method
2.2.1 In-situ Volume Swellling Test
Archimedes’s law of buoyancy, test the buoyancy change of the battery cell in silicone oil, as shown in Figure 1.

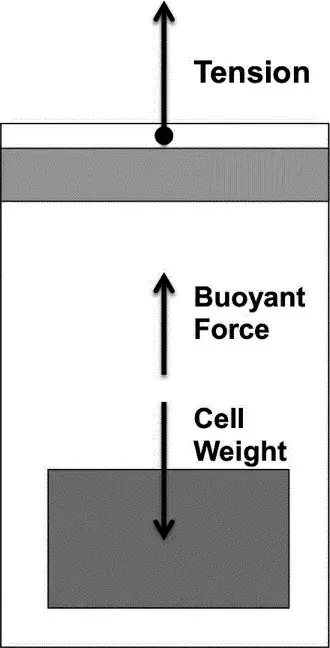
Figure 1. Schematic diagram of volume expansion test
2.2.2 In-situ Stress Swellling Test
Real-time monitoring of stress changes during charging and discharging by fixing a pressure sensor on the surface of the cell, as shown in Figure 2a and 2b.
2.2.3 In-situ Thickness Swellling Test
The displacement sensor monitors the up and down movement of the aluminum plate on the surface of the battery cell to monitor the thickness change during charging and discharging, as shown in Figure 2C.
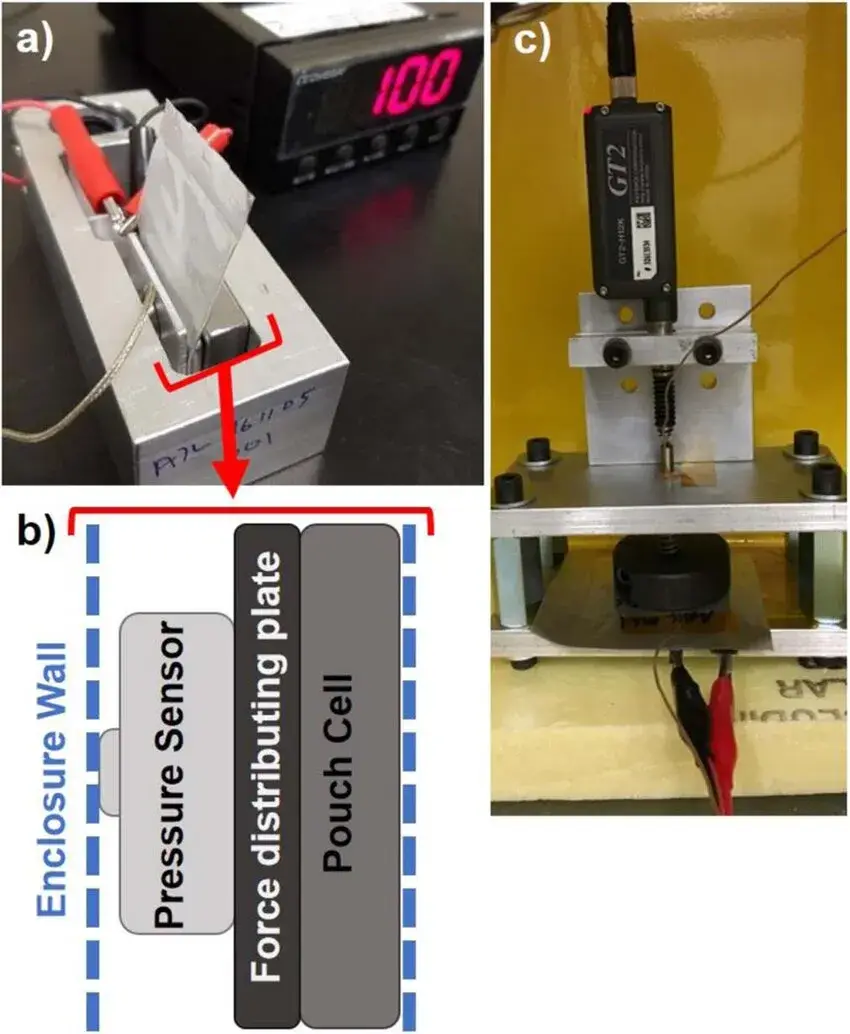
Figure 2. Swelling force and swelling thickness test equipment
3. Result Analysis
3.1 In-situ volume, stress, and thickness variation curves for three systems of electric cores
Figure 3 is the test curves of volume, stress and thickness swelling of three types of batteries during charge and discharge. From the results, the volume swelling and stress swelling of batteries A and B are equivalent, which is larger than the swelling of battery C, and the swelling curves of batteries A and C in the high voltage range have similar plateau areas, the swelling curve of battery B in the high voltage region is steeply increasing or decreasing. Since the result of this curve is caused by the common swelling of the positive and negative electrodes, when analyzing the contribution of the individual negative electrodes, it is necessary to know the swelling of the corresponding individual materials.
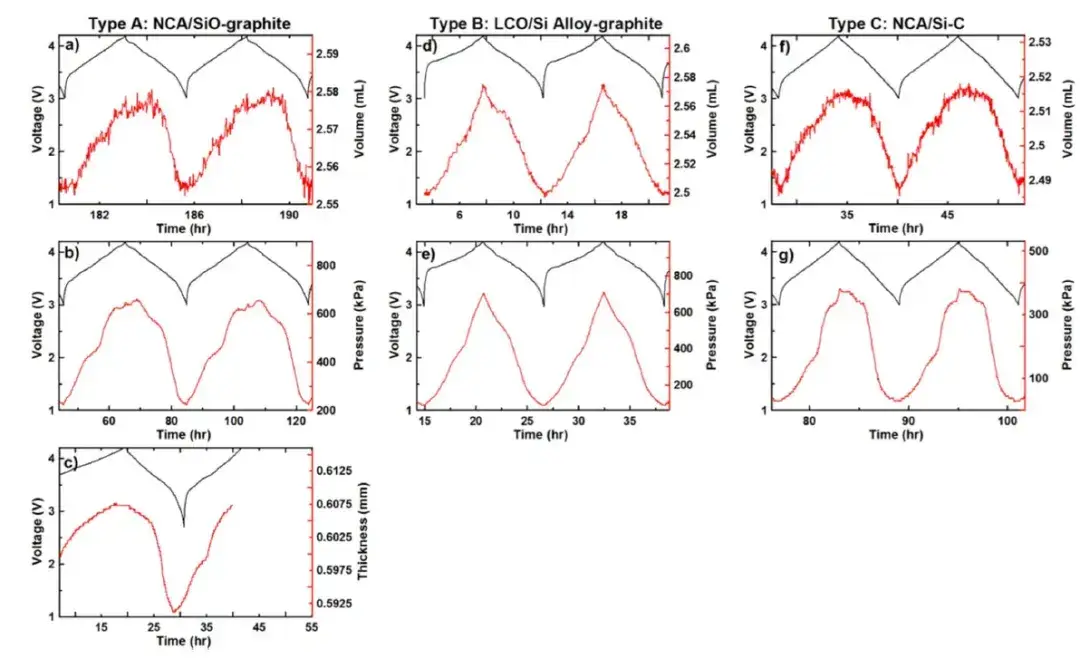
Figure 3. The volume, stress and thickness swelling test curves of the three types of batteries during charge and discharge
3.2 Positive and negative electrode expansion analysis
The curves (a) and (b) of Figure 4 are the volume swelling ratios of pure Si and pure graphite in the charging and discharging process obtained in other related literatures, Figure (c) is the swelling ratio of the NCA material obtained by in-situ XRD in this article. It can be seen from the results that silicon and graphite will produce volume swelling of 280% and 10% respectively during the charging process, and the swelling curve of silicon shows a linear increase trend with the increase of SOC. However, the swelling curve of graphite will have a step in the phase transition process of 2L→2 order, and there is no obvious volume swelling at this stage. The swelling trend of NCA during charge and discharge is opposite to that of silicon and graphite. The volume shrinkage of 4.5% will occur during the entire charging process, and the most important shrinkage occurs in the high SOC interval.
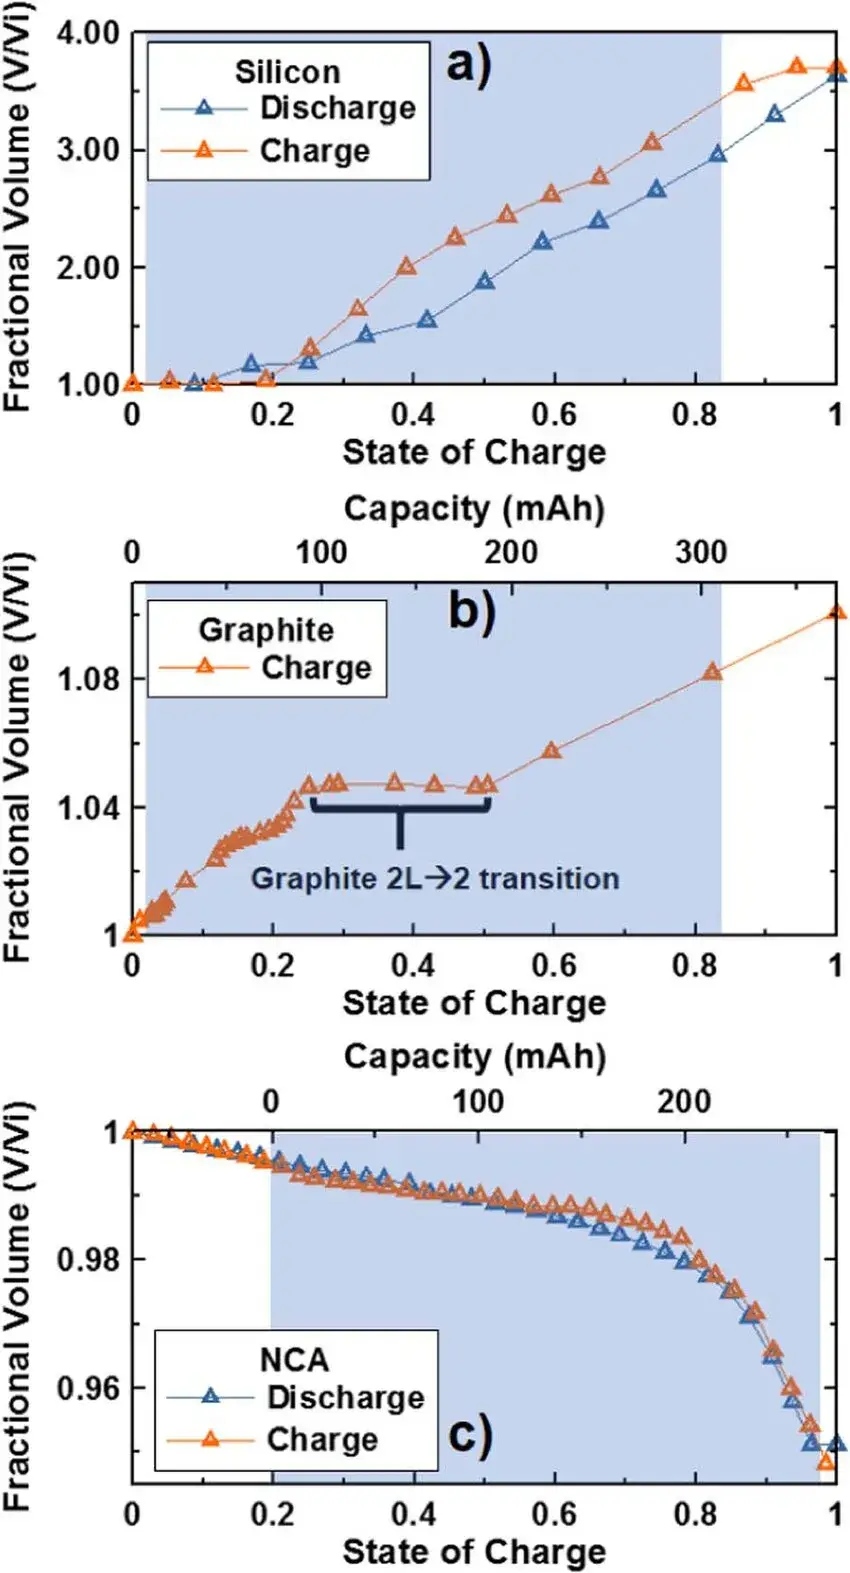
Figure 4. Volume change ratio curves of three pure electrode materials during charge and discharge process
3.3 Quantitative calculation of positive and negative expansion of pouch cells A
The authors used the dV/dQ analytical fitting software to split the voltage curves of the silicon-composite negative electrode of the pouch cells A during charging and discharging, respectively, as shown in Figure 5. Combined with the expansion curves of the positive and negative electrode materials individually, the total volumetric expansion curves of the cell A can be further split with three stages of change: i) the stage plateau is the graphite 2L→2 phase transition; ii) there are two mechanisms of action in the stage: the contraction of the NCA counteracts the expansion of the graphite and the absence of volumetric contraction during the graphite 2→2L phase transition; and iii) the stage is mainly due to the delithiation reaction of the lithium-silicon alloys in the SiO resulting in rapid volume contraction.
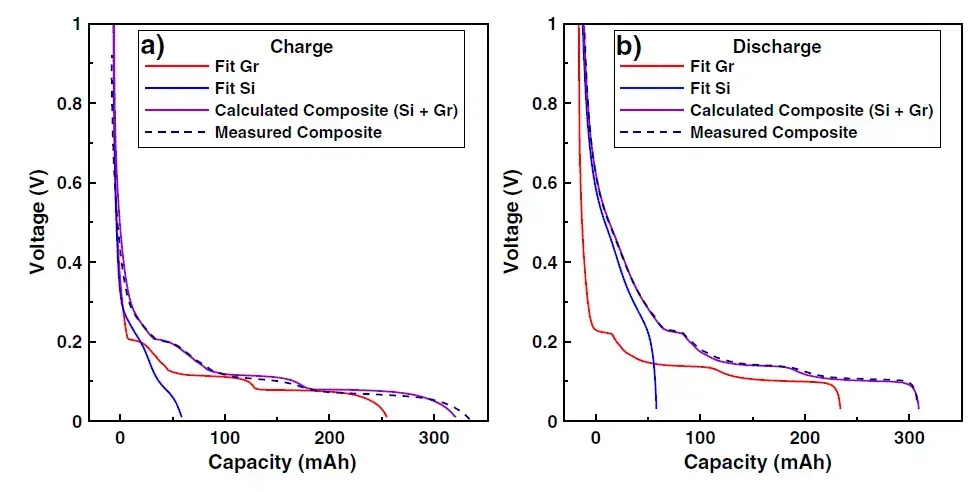
Figure 5. Composite voltage capacity curve fitting of Si and Gr
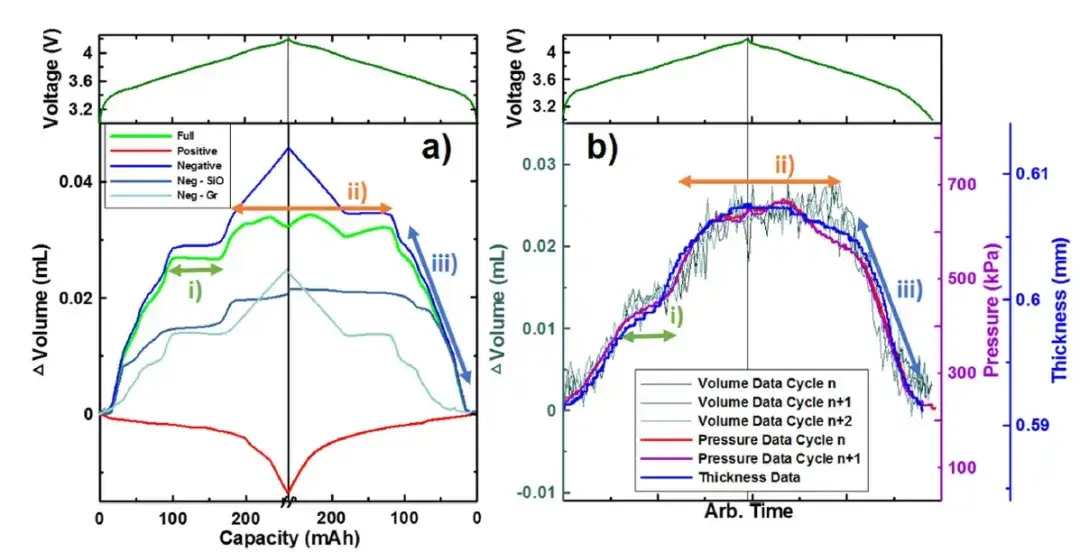
Figure 6. Decomposition of the volume swelling curves of the components corresponding to the full battery of SiO/Gr composite electrodes and NCA electrodes
3.4 Comparison of long-cycle stress curves of pouch cells B and C
Figure 7 shows the swelling force and capacity change curves of pouch cells B and C during the long cycle, comparing the cycle and swelling performance of the two cells, the irreversible swelling force and capacity decay rate of the LCO/Si alloy carbon-doped cells are greater than those of the NCA/Si-C cells.
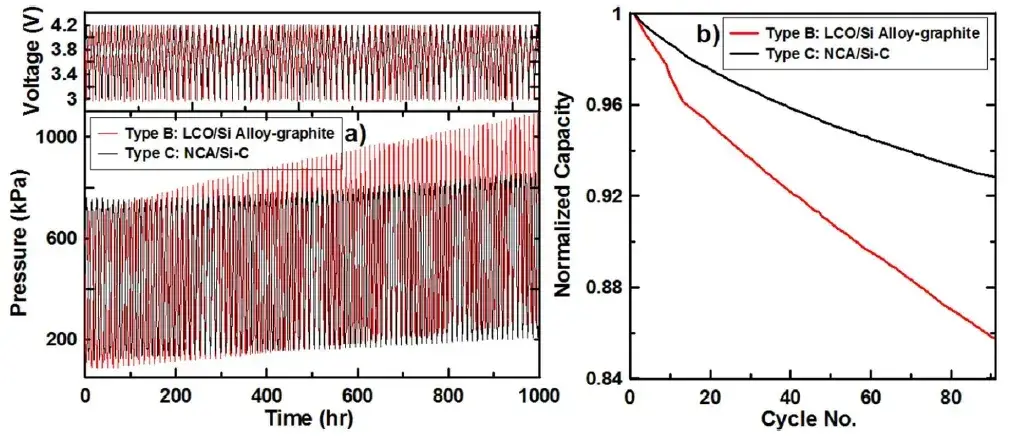
Figure 7. The long cycle expansion force and capacity curves of pouch cells B and C
4. Summary
In this paper, the author used the in-situ characterization method to test the volume, stress and thickness changes of the electrode, combined with the calculation method, quantitatively analyzed the volume swelling ratio of each component of the silicon composite electrode, to lay the foundation for an in-depth understanding of the swelling mechanism of silicon-based materials.
5. Original Article
A.J. Louli, Jing Li, S. Trussler, Christopher R. Fell, and J. R. Dahn. Volume, Pressure and Thickness Evolution of Li-Ion Pouch Cells with Silicon-Composite Negative Electrodes. Journal of The Electrochemical Society, 164 (12) A2689-A2696 (2017).
6. IEST Related Test Equipment Recommendation
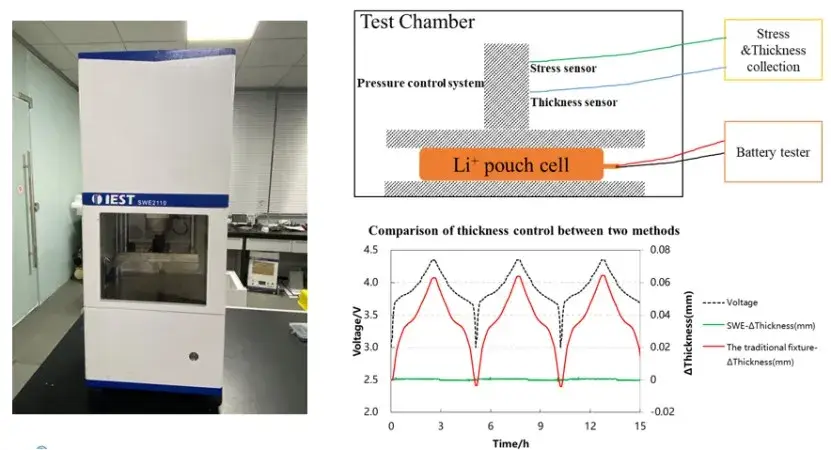
SWE Series In-situ Swelling Analysis System (IEST): Using a highly stable and reliable automation platform, equipped with a high-precision thickness sensor, it can measure the thickness change and change rate of the battery throughout the charging and discharging process, and can realize the following functions:
- The battery swelling thickness curve is tested under constant pressure conditions.
- Test battery swelling force curve under constant gap condition.
- Battery compression performance test: stress-strain curve-compression modulus.
- Step-by-step test of battery swelling force.
- Different temperature control: -20 ~ 80 ℃.
Contact Us
If you are interested in our products and want to know more details, please leave a message here, we will reply you as soon as we can.


