-
iestinstrument
Li-Rich Mn-Based Cathode Materials for Precise Control of Initial Coulombic Efficiency
1. Background
The rapidly evolving energy storage sector urgently demands advanced cathode materials to develop lithium-ion batteries with higher energy densities. Li-rich Mn-based cathode materials (LRM) exhibit exceptional specific capacities through additional anionic redox reactions. However, oxygen evolution induced by anionic redox at high voltages exacerbates parasitic reactions at the electrode/electrolyte interface, leading to irreversible active lithium loss. Furthermore, irreversible phase transitions, byproduct formation, and increased Li⁺ diffusion barriers collectively limit electrochemical reversibility, resulting in reduced initial Coulombic efficiency (ICE) and compromised rate/capacity retention. Precise ICE regulation is thus critical for optimizing the comprehensive electrochemical performance of LRM.
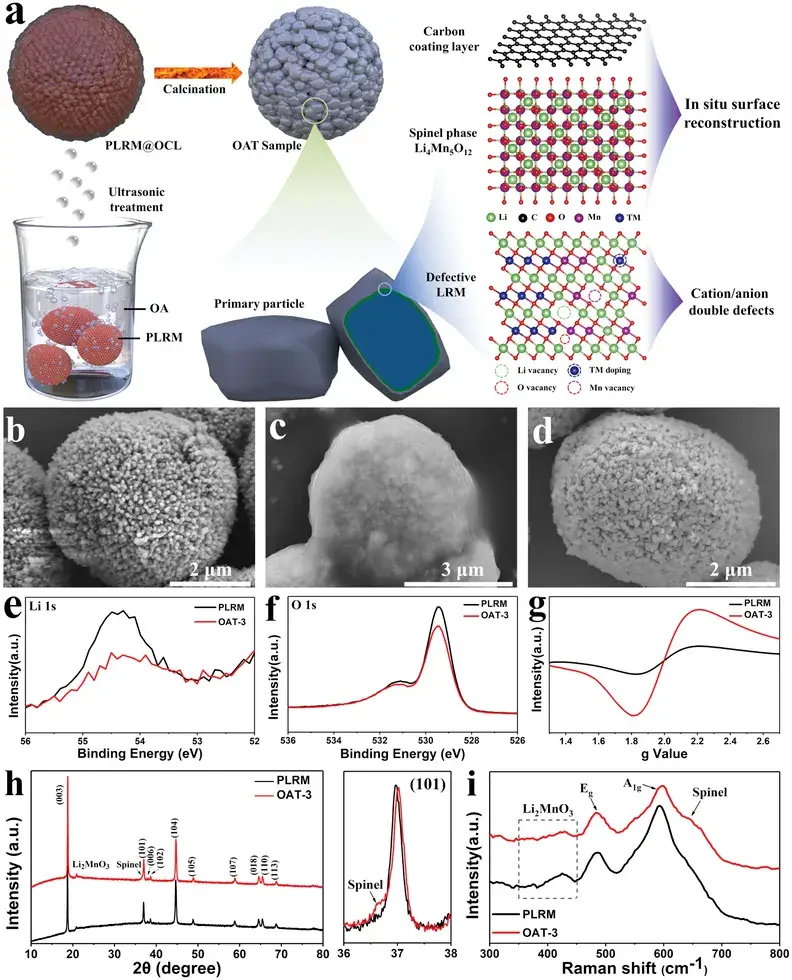
Figure 1. a) Schematic diagram of OA-assisted interface engineering. b-d) SEM images of PLRM (b), PLRM@OCL (c) and OAT-3 (d). e) Li 1s and f) O 2p high-resolution XPS spectra. g) Electron spin resonance (ESR) spectra, h) XRD and i) Raman spectra of PLRM and OAT-3.
2. Key Findings
In a recent publication in Advanced Materials, Professor Dongliang Peng and Associate Professor Qingshui Xie from Xiamen University presented the paper titled “A Universal Strategy toward the Precise Regulation of Initial Coulombic Efficiency of Li-Rich Mn-Based Cathode Materials”. This work introduces a simple oleic acid (OA)–assisted interface engineering strategy that precisely controls ICE, effectively enhancing both the reversible capacity and rate performance of LRM. Using this strategy, the ICE of LRM can be precisely tuned from 84.1% to 100.7%, yielding a high specific capacity of 330 mAh g⁻¹ at 0.1 C along with excellent rate capability. Theoretical calculations indicate that the introduction of dual cation/anion defects reduces the Li⁺ diffusion barrier, while the in situ formed surface reconstruction layer induces a self-built electric field that stabilizes the lattice oxygen at the surface. Importantly, the simplicity and generality of this interface engineering strategy render it applicable to other types of LRM.
3. Research Highlights
3.1 OA-Assisted Interface Engineering
This strategy is employed to manufacture Li-Rich Mn-Based cathode materials exhibiting dual cation/anion defects and an in-situ surface reconstruction layer.
3.2 Mechanism of ICE Improvement
Oleic acid provides abundant H⁺ ions that exchange with Li⁺ in the Li-rich Mn-based cathode materials, generating lithium vacancies. Additionally, OA aggregates on the surface of the Pristine Li-rich Mn-based cathode materials (termed PLRM) to form a uniform organic coating layer (OCL).
4. Illustrated Overview
PLRM particles have an approximate diameter of 5 µm. Due to OA aggregation during ultrasonic treatment, a uniform and translucent OCL is formed on the surface of PLRM (resulting in PLRM@OCL). Subsequent calcination causes the disappearance of the OCL, yielding OAT-3 (obtained after 3 hours of OA ultrasonic treatment) with well-preserved morphology and no apparent damage.
Figure 1e demonstrates that the Li 1s peak intensity in OAT-3 decreases, confirming the partial loss of Li⁺ from the outer surface. In the O 1s region, two peaks at 529.5 and 531.4 eV correspond to lattice oxygen and the oxygen in carbonate groups, respectively. The decrease in these peak intensities indicates that some lattice oxygen is extracted and less lithium carbonate remains on the surface of OAT-3. Figure 1g reveals that the ESR signal intensity of OAT-3 is significantly higher than that of PLRM, attributable to an increased concentration of oxygen vacancies induced by lattice oxygen extraction. Therefore, the dual cation/anion defects have been successfully introduced into the OAT-3 sample.
In the XRD patterns, both PLRM and OAT-3 display nearly identical features corresponding to the α-NaFeO₂ structure with space group R-3m and the monoclinic Li₂MnO₃-like structure with space group C2/m. Upon careful examination near the (101) peak, an accompanying feature corresponding to the (311) plane of the spinel phase Li₄Mn₅O₁₂ (space group Fd-3m) is identified in OAT-3.
The Raman spectra in Figure 1i show two main peaks at 485 and 595 cm⁻¹, corresponding to the bending (E_g) and stretching (A₁g) modes of the R-3m layered structure, respectively. Additional weak peaks in the range of 350–450 cm⁻¹ are associated with monoclinic Li₂MnO₃. In comparison with PLRM, the broad peak near 645 cm⁻¹ in OAT-3 belongs to the Mn–O vibration of the spinel phase Li₄Mn₅O₁₂. The XRD and Raman results confirm that the interface engineering induces the in situ formation of the spinel phase Li₄Mn₅O₁₂.
High-angle annular dark-field scanning transmission electron microscopy (HAADF-STEM) was employed on thin slices cut by focused ion beam to observe OAT-3 particles. Figure 2a shows a HAADF image of the monoclinic Li₂MnO₃ phase viewed along a specific orientation. In the near-surface region of the primary particle, the spinel phase Li₄Mn₅O₁₂, a transitional region, and ordered monoclinic Li₂MnO₃ are sequentially arranged. During the OA treatment, the proton-exchange reaction extracts part of the Li and O from the monoclinic Li₂MnO₃ and the Ni and Co from the layered R-3m phase, resulting in the formation of abundant dual cation/anion surface defects. During subsequent calcination, transition metals (TMs: Mn, Ni, and Co or their mixtures) migrate outward, and due to the carbothermal reduction reaction, further extraction of lattice oxygen occurs. Hence, the outermost defect-rich monoclinic Li₂MnO₃ gradually transforms into the spinel phase Li₄Mn₅O₁₂, while in the intermediate spinel/layered heterostructure region, the lithium sites are occupied by migrating TMs, forming a transitional zone.
Figure 2b shows a HAADF-STEM image of OAT-3 along a certain direction of the Li₂MnO₃ structure. In the HAADF-STEM images, which are insensitive to light elements such as Li, dark spots represent lithium and bright spots represent transition metals. In contour I (red histogram), the dark spots correspond to Li sites a in the TM layer; in contour II (red histogram), the dark spots are Li sites b in the lithium layer. Figure 2c displays energy-dispersive X-ray spectroscopy (EDX) mapping, indicating that Mn is primarily located in the TM layer. Therefore, in intensity contrast profiles I and II, peaks correspond to Mn sites while valleys correspond to Li sites a and b. The consistent intensity at Mn sites and the lack of distinct peaks at Li sites a and b suggest that the Mn sites, as well as the two different Li sites in localized regions, are occupied by Mn and Li atoms, respectively. In contrast, weaker peaks observed at Mn sites in contours III–VI indicate the presence of Mn vacancies and local TM doping at Li site a. Additionally, stacking faults induced by interlayer Mn site misalignment are observable in the blue histograms. Hence, a significant number of defects have been introduced into the modified primary particles.
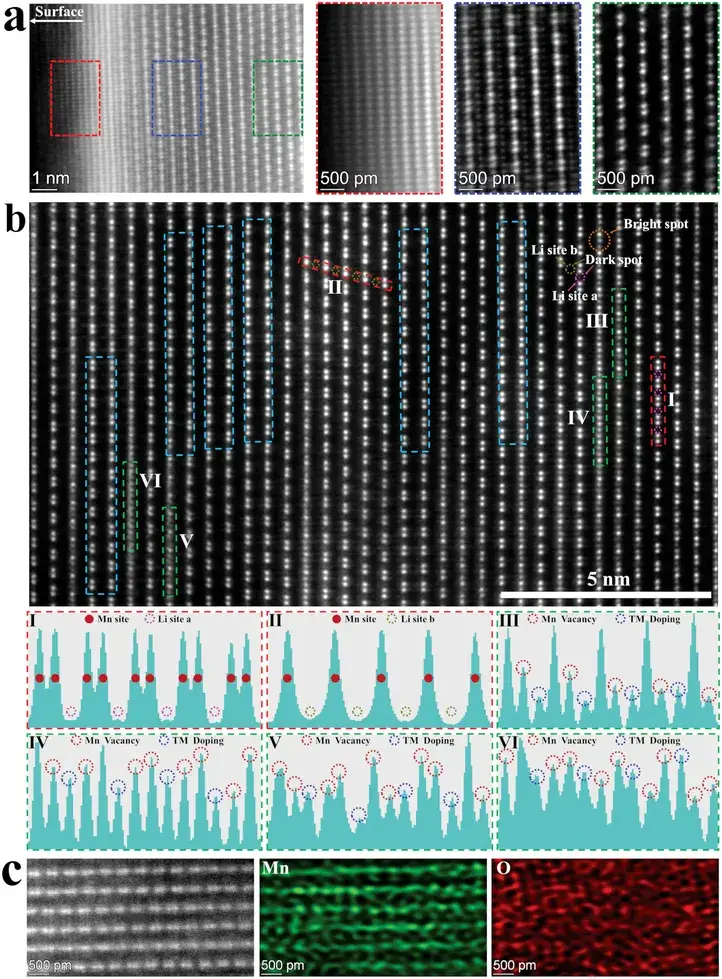
Figure 2. a) HAADF‐STEM image of the surface region of OAT‐3. The red, blue, and green histogram profiles correspond to the spinel phase Li4Mn5O12, transition region, and monoclinic Li2MnO3, respectively. b) HAADF‐STEM image of the inward of OAT‐3. The contrast profiles along with I, II, III, IV, V, VI histograms. c) HAADF‐STEM image and atomic‐resolution EDX mappings of the inward of OAT‐3.
Figures 3a and 3b illustrate that with prolonged OA treatment, the initial charge capacity gradually decreases; however, when the OA treatment time reaches 3 hours, the initial discharge capacity first increases to 296 mAh g⁻¹ and then decreases with further treatment, resulting in an ICE increase from 84.1% to 100.7%. Thus, by simply adjusting the OA treatment time, ICE can be precisely controlled, with OAT-3 demonstrating the best overall performance.
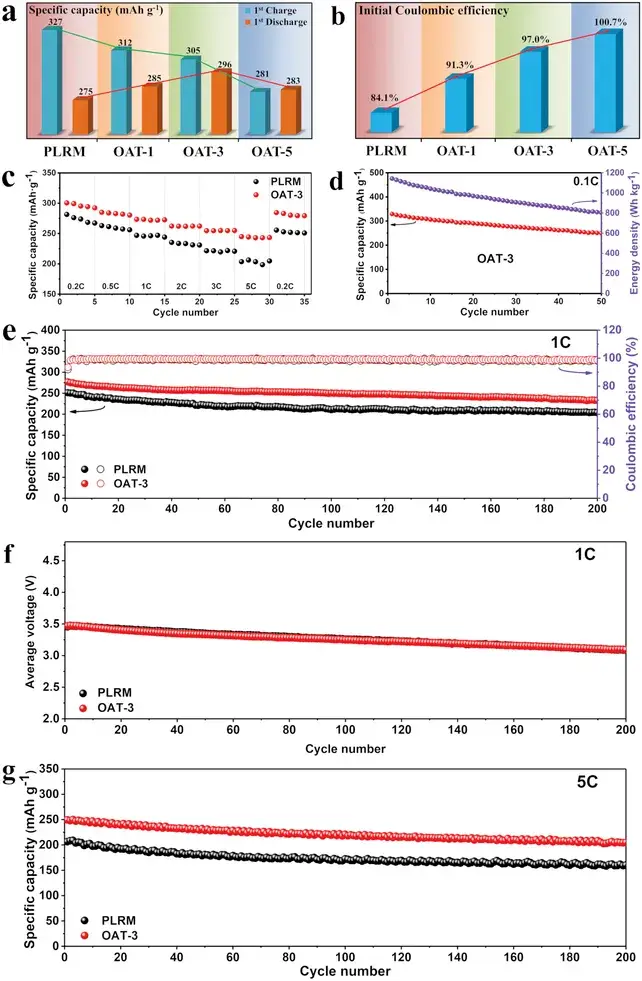
Figure 3. a) Initial charge-discharge specific capacity and b) ICE of PLRM, OAT-1, OAT-3, and OAT-5 at 0.2 C. c) Rate performance of PLRM and OAT-3. d) Specific capacity and energy density of OAT-3 at 0.1 C. Cycling performance of PLRM and OAT-3 at e, f) 1 C and g) 5 C.
Figure 3c compares the rate performance of PLRM and OAT-3, showing that OAT-3 exhibits superior rate capability, indicating improved electrochemical reaction kinetics and enhanced structural stability. At 0.1 C, OAT-3 shows a high specific capacity of 330 mAh g⁻¹ with an energy density of 1143 Wh kg⁻¹. Furthermore, Figures 3e–3g demonstrate that OAT-3 has excellent long-cycle performance, with specific capacities remaining as high as 233 mAh g⁻¹ at 1 C and 205 mAh g⁻¹ at 5 C after 200 cycles. In contrast, the capacity retention of PLRM at 1 C and 5 C is 81.3% and 77.3%, respectively, compared to 84.1% and 82.0% for OAT-3. Additionally, the average voltage of the PLRM and OAT-3 cathodes at 1 C are 3.456 V and 3.471 V, respectively, during the initial cycle, and they remain at 3.087 V and 3.093 V, respectively, after 200 cycles. The minimal difference in average voltage between PLRM and OAT-3 indicates that the OA-assisted interface engineering does not compromise voltage stability.
To determine the structural evolution of PLRM and OAT-3, in situ XRD measurements were carried out to characterize the evolution of the (003) diffraction peak between 18° and 19° during the first two cycles at 0.5 C. With Li⁺ insertion and extraction, both PLRM and OAT-3 exhibit similar trends in the shift of diffraction peaks. The key difference is that, as shown by the symmetric peak position changes in the white histogram contour in Figure 4b, the in situ induced spinel phase Li₄Mn₅O₁₂ at the surface of OAT-3 causes the (111) peak to shift toward lower angles during Li⁺ insertion and toward higher angles during Li⁺ extraction. Moreover, the overall peak shift in OAT-3 is slightly larger than that in PLRM, particularly when the voltage rises to 4.8 V, due to the formation of Li vacancies which result in a lower Li content and a higher state of delithiation after charging. In summary, although OAT-3 achieves a deeper delithiated state, the synergistic effect of the dual cation/anion defects and the in situ surface reconstruction layer effectively suppresses oxygen release from the lattice, thereby enhancing the structural stability and overall electrochemical performance.
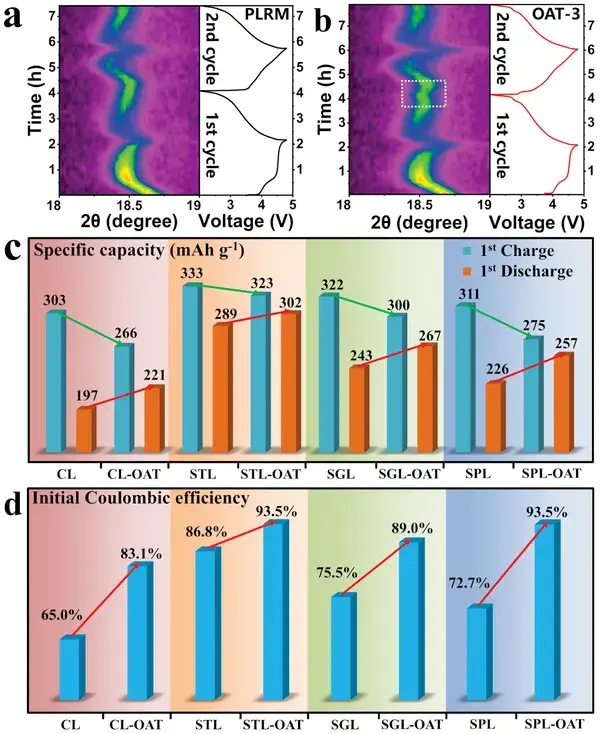
Figure 4. a,b) In situ peak (003) evolution during the first two cycles for PLRM and OAT‐3. c) Initial charge–discharge specific capacities and d) corresponding ICEs of CL, CL‐OAT, STL, STL‐OAT, SGL, SGL‐OAT, SPL, and SPL‐OAT at 0.2 C.
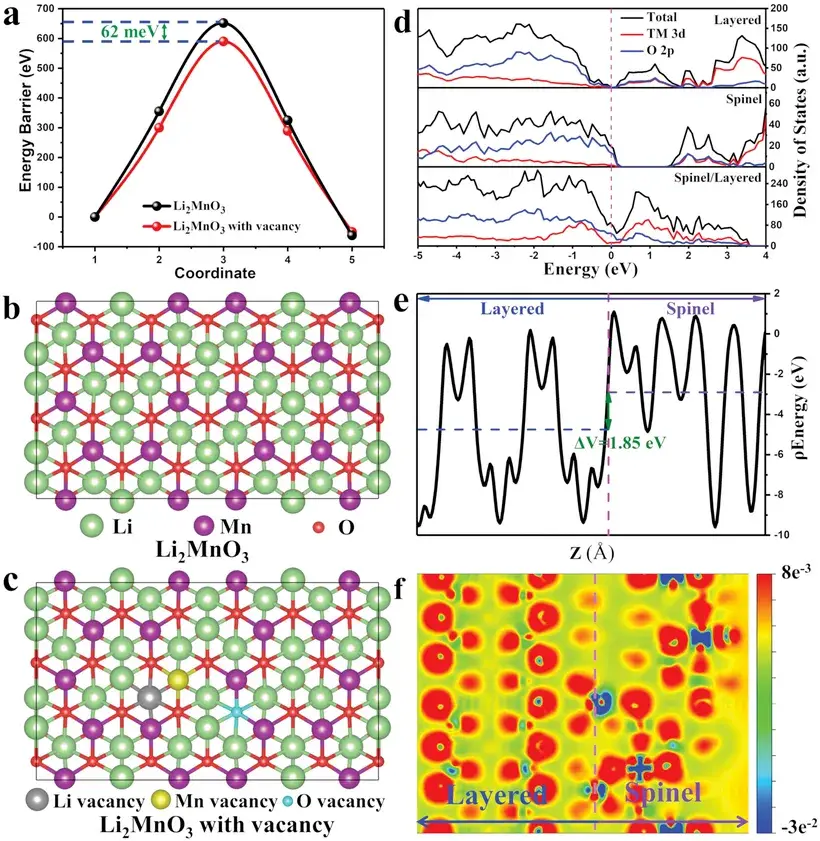
Figure 5. a) The diffusion energy barriers of Li⁺ ions in Li2MnO3 and Li2MnO3 with vacancy. b,c) The corresponding top views of Li2MnO3 (b) and Li2MnO3 with vacancy (c). d) The calculated density of states of the layered, spinel, and spinel/layered heterostructure. e) The planar averaged electrostatic potential and f) charge density difference of spinel/layered heterostructure.
Figure 5d reveals that the density of states (DOS) at the Fermi level of the spinel/layered heterostructure is significantly higher than that of the individual layered and spinel phases, indicating that constructing the heterostructure interface markedly enhances electronic conductivity. Additionally, an internal self-built electric field (ISE) is generated at the spinel-layered heterointerface. The average electrostatic potential difference across the spinel/layered heterostructure is 1.85 eV, which is sufficient to induce the ISE effect. As shown in Figure 5f, the charge density difference analysis demonstrates electron transfer from the spinel to the layered phase, resulting in hole accumulation on the spinel side and electron enrichment on the layered side. This electron-rich state in the layered phase effectively suppresses surface lattice oxygen release. Consequently, the ISE induced at the heterointerface significantly improves the stability of surface lattice oxygen.
5. Summary and Outlook
The introduction of dual cation/anion defects and an in situ surface reconstruction layer into Li-rich Mn-based cathode materials via a simple OA-assisted interface engineering approach enables the precise tuning of ICE from 84.1% to 100.7% while significantly enhancing both the reversible capacity and rate performance. The introduced defects reduce the Li⁺ diffusion barrier, thereby improving the Li⁺ diffusion coefficient, and the in situ surface reconstruction layer increases electronic conductivity and induces an ISE effect that stabilizes surface lattice oxygen. As a result, the optimized OAT-3 delivers a high specific capacity of 330 mAh g⁻¹ at 0.1 C, an energy density of 1143 Wh kg⁻¹, and commendable capacities of 276 and 250 mAh g⁻¹ at 1 C and 5 C, respectively. Moreover, the OA-assisted interface engineering strategy demonstrates excellent universality in industrial production and can be extended to other layered cathode materials.
6. References
Weibin Guo, Chenying Zhang, Yinggan Zhang, Liang Lin, Wei He, Qingshui Xie,* Baisheng Sa, Laisen Wang, Dong-Liang Peng,* A Universal Strategy toward the Precise Regulation of Initial Coulombic Efficiency of Li-Rich Mn-Based Cathode Materials, Adv.Mater., 2021, DOI:10.1002/adma.202103173.
7. IEST Related Test Equipment Recommended
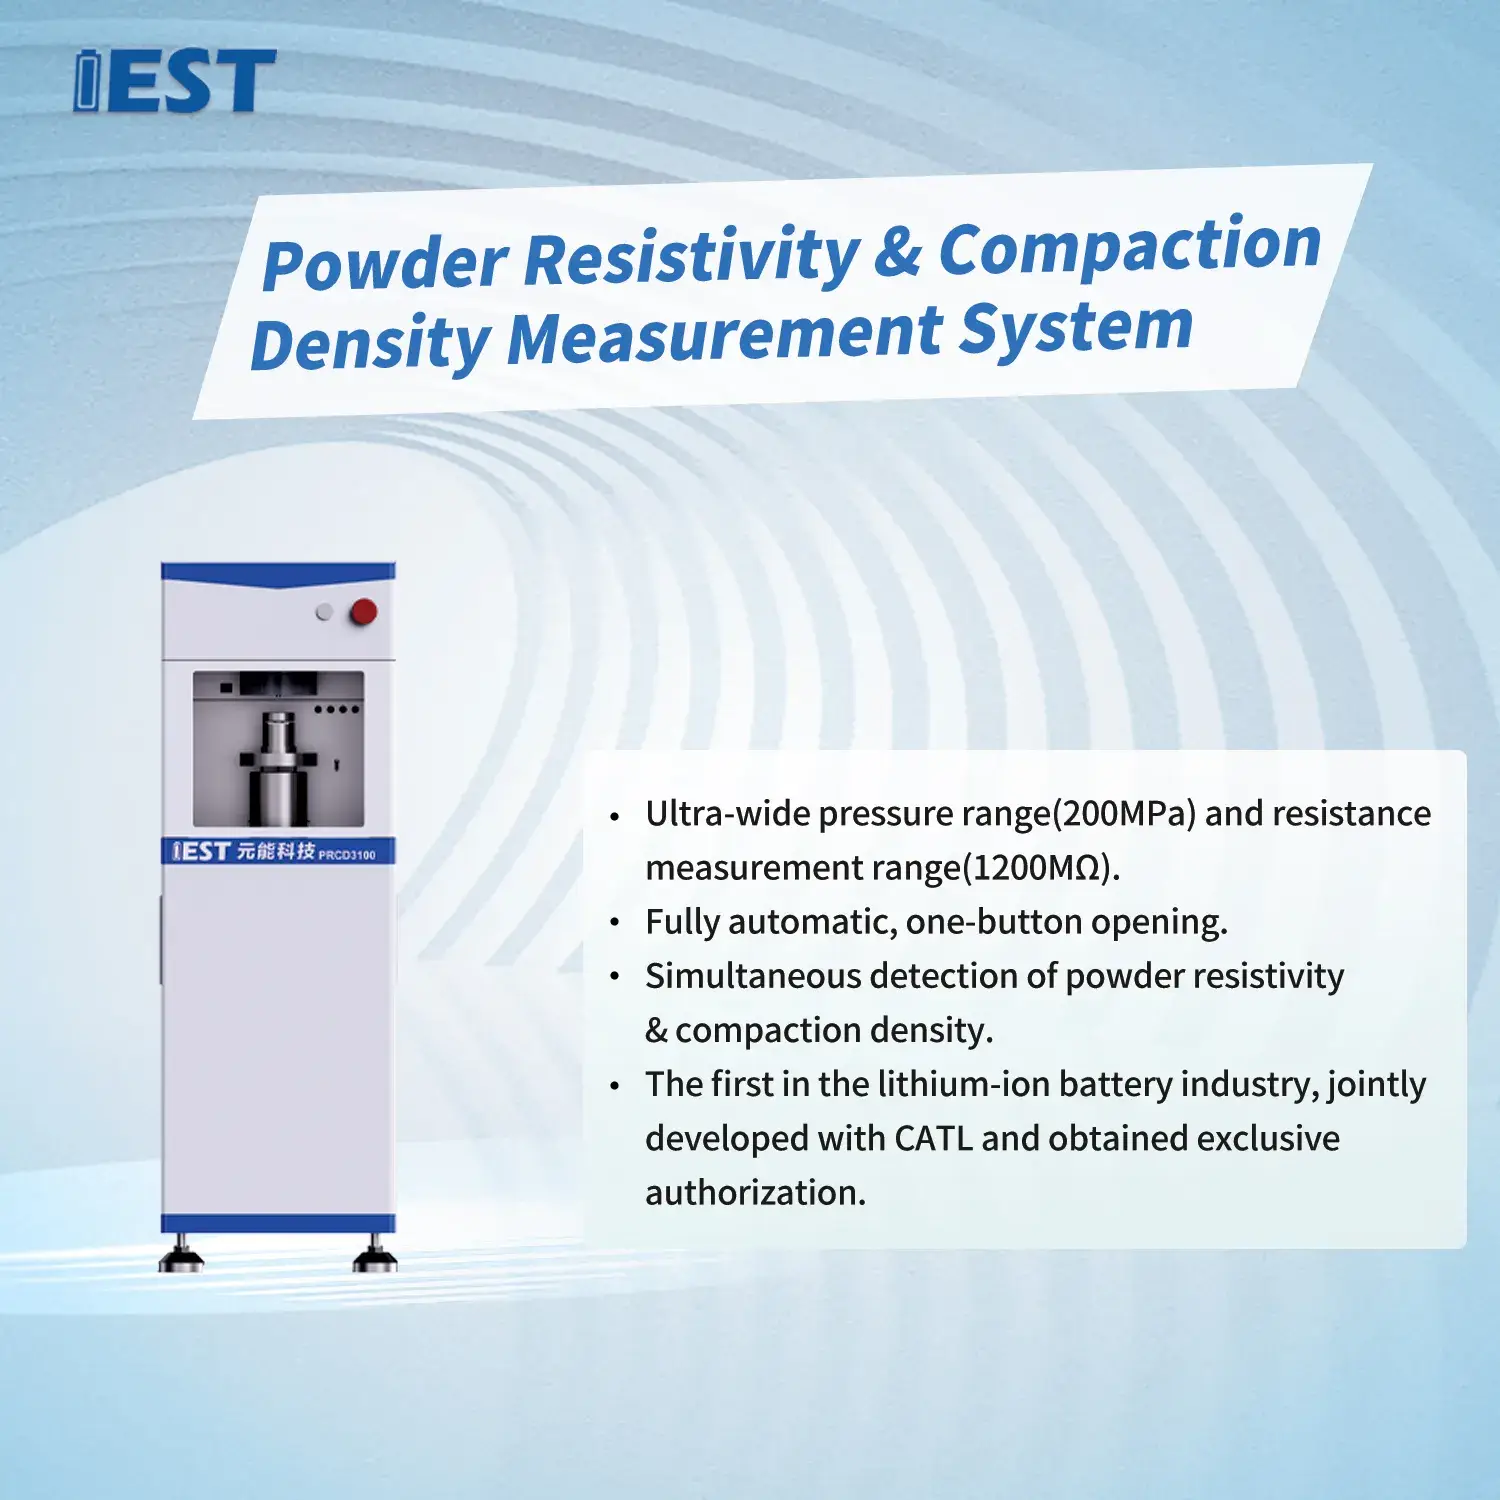
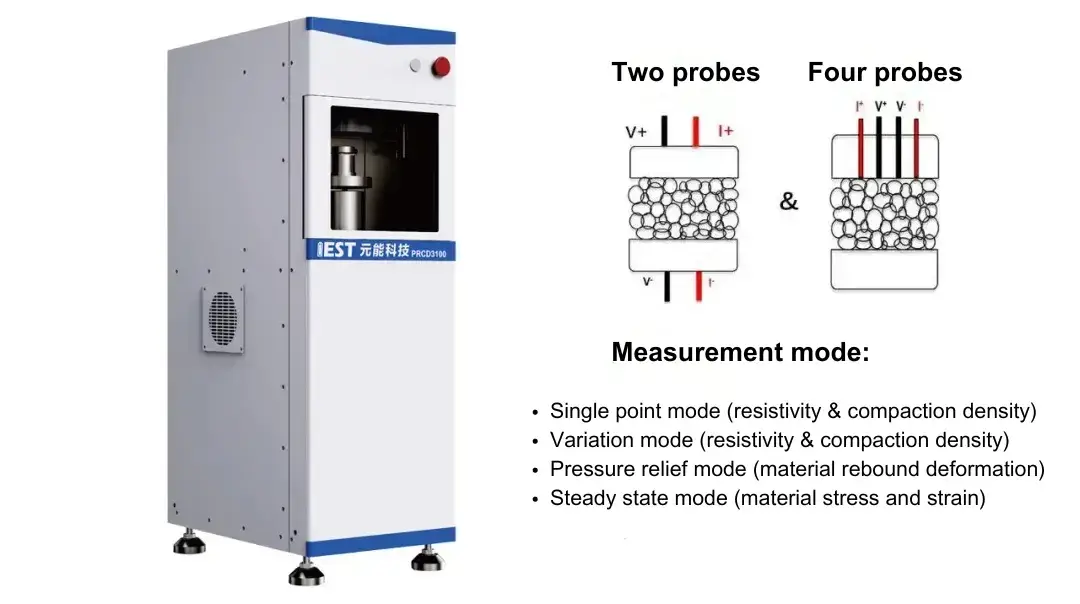
Powder Resistivity & Compaction Density Measurement System(PRCD Series)
Realize compaction density and resistance synchronous test of all lithium powder pressure / discharge states, supporting two probe and four probe test methods, mainly including the following three test modes.
a.Single-point pressure synchronization test;
b .Multi-point pressure synchronization test;
c .Backash test of pressure and discharge state.
Subscribe Us
Contact Us
If you are interested in our products and want to know more details, please leave a message here, we will reply you as soon as we can.


