-
iestinstrument
Detecting Lithium Plating In Battery Cells By Measuring Swelling Thickness
1. Author Information and Article Abstract
In 2014, Bernhard Bitzer et al. published a method for monitoring the lithium plating of battery cells by in-situ detection of battery swelling thickness changes. When the battery is charged at low temperature or high rate, the lithium ions released from the positive electrode will be deposited on the surface of the negative electrode. Compared with the lithium normally embedded in the negative electrode, lithium plating will increase the thickness of the battery cell, so lithium plating can be characterized by measuring the thickness.
2. Traditional characterization methods for lithium plating
- Make three electrodes to monitor the negative potential;
- Analyzing electrical signals such as capacity loss and internal resistance during battery aging;
- Physical/chemical methods to prove the presence of Li metal after disassembly;
3. Several factors affect the variation of the battery thickness
- Swelling of the material structure: graphite ~10%, NMC ~1%, LTO: 0.1% to 0.3%;
- Volume change during lithium plating: according to the following formula, the plating of 1Ah of lithium results in a volume increase of 0.37cm3.


4. Experiment and Analysis
4.1 Experimental setup
Figure. 1 shows the experimental setup for thickness measurement, which mainly consists of two aluminum plates and thickness sensors with a thickness resolution of 1µm, along with a data cycling and acquisition system BaSyTec XCPS-System.
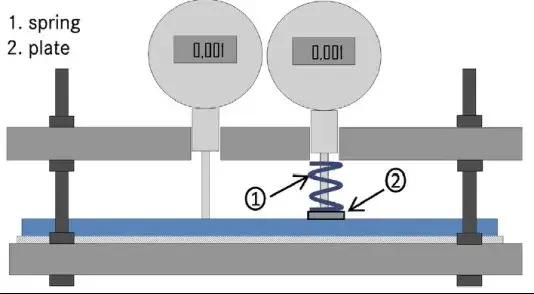
Figure 1.Device for in-situ testing of cell thickness.
4.2 Thickness profile of the battery during standard duty cycling
Figure 2 shows the open-circuit thickness (OCT) curves of a 20Ah NCM/graphite cell that was charged and discharged at a multiplication rate of 1/4C and left to stand at each test point for 1 h. The thickness variation curve of the cell is divided into three stages, with the slope of stage I being about 9.5 mm/Ah. The slope of stage II is about 3.0 mm/Ah, and that of stage III is about 6.5 mm/Ah. The thickness increases by about 136µm when the cell is fully charged to 100% SOC. 100% SOC increases the thickness by about 136 µm.
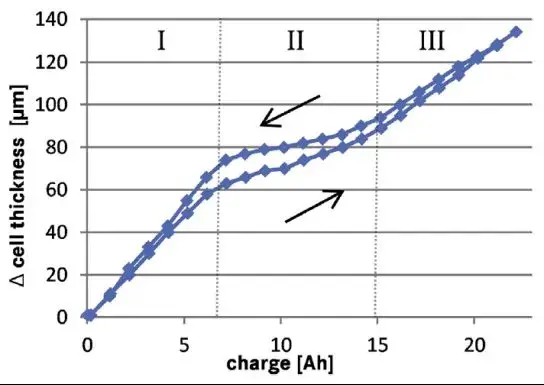
Figure 2.Thickness variation curve of the cell under steady state condition
4.3 Influence of cathode material on battery thickness
LTO, which has a relatively small volume expansion, is used as the negative electrode and the positive electrode is used as the NCM, the theoretical capacity of the battery is 16Ah, and the thickness change curves of the battery during the charging and discharging processes are measured under the steady state condition, during the charging process, the thickness of the battery decreases by about 3µm and then increases to 11µm, and during the discharging process the thickness of the battery also decreases and then increases a little bit, but the change of the thickness which is not more than 12µm is negligible compared to the change of the thickness of the battery in Fig. 2, which is about 140µm. in Figure 2 is negligible.
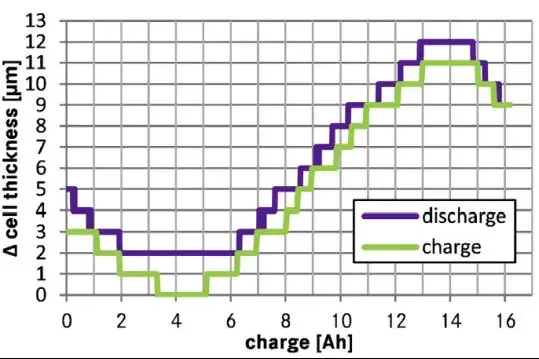
Figure 3. OCT curve of NCM/LTO cell
4.4 Effect of gas on cell thickness
Cycling the battery for 3 turns at -5°C, two thickness sensors were used to measure the change of the surface thickness of the battery, one of the sensors has a spring plate underneath with a spring force of about 2 bar, if there is gas production during the cycling process, the measured thickness of the sensor with the spring should be bigger than the thickness of the other sensor. However, from the test curves in Figure 5, the thickness curves of the two are not very different, indicating that there is no obvious gas production behavior under this test condition.
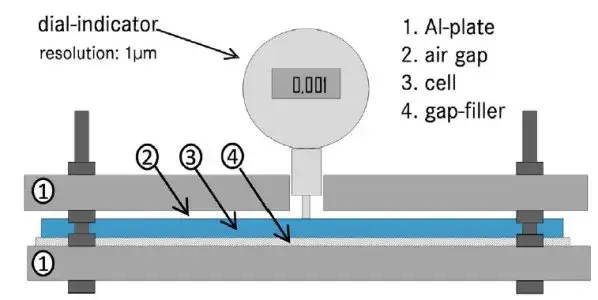
Figure 4. Dual thickness sensor device
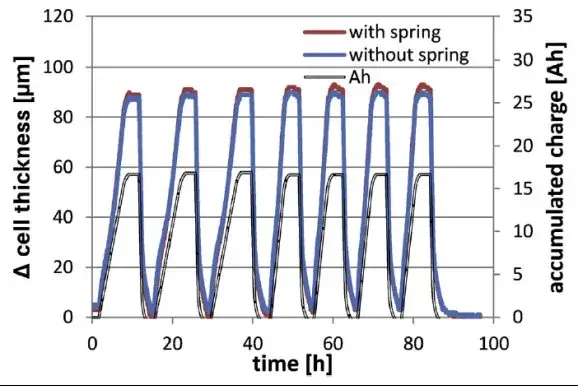
Figure 5. Comparison of thickness profiles measured by the two sensors
4.5 The effect of gas on battery thickness
Comparison of the thickness change curve when charging two different currents, 3A current charging, the battery is no lithium plating, when charging with a current of 7A, the thickness change can be seen to be greater than the thickness change amount of 3A, and in the constant voltage stage there will be a decrease in the thickness of the phenomenon, this is mainly because of the constant voltage when the current decreases, the original plating of the lithium will continue to embedded in the graphite again, so you can calculate the amount of reversible lithium plating and irreversible plating of the amount of the graphite from the two curves. Therefore, the amount of reversible lithium precipitation and irreversible lithium plating can be calculated from the two curves. The irreversible thickness expansion due to lithium plating is increasing in each cycle from the cycle curves in Figure. 7, using 7A charging and 20A discharging at a temperature of -5°C. The irreversible thickness expansion due to lithium plating is increasing in each cycle from the cycle curves in Figure. 7, using a current of 7A charging and 20A discharging.
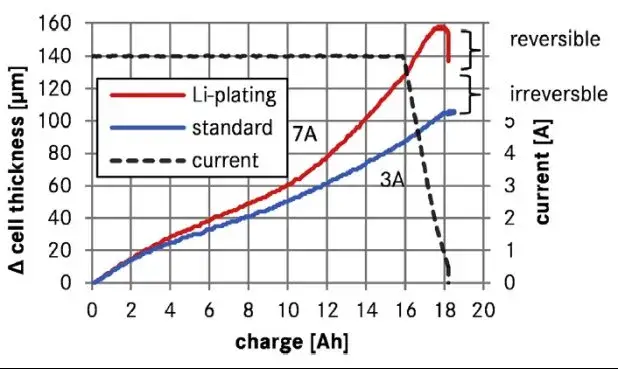
Figure 6. Thickness variation curves for two different test conditions
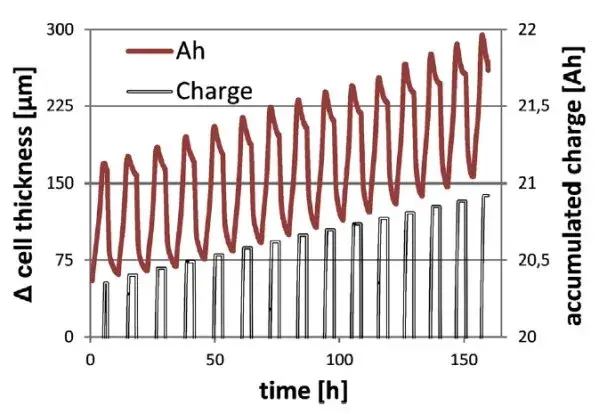
Figure 7. Cyclic thickness profile under lithium plating conditions
5. Summary
In this paper, an in-situ cell swelling measurement(SWE Series) device with a resolution of 1µm is used to non-destructively characterize lithium plating under different charging and discharging conditions of the battery cell, and the effect of various conditions on lithium plating is also analyzed, which is a fast method to determine lithium plating.
6. References
B. Bitzer,Gruhle. A new method for detecting lithium plating by measuring the cell thickness. Journal of Power Sources, 262 (2014) 297~302.
7. IEST Related Test Instruments Recommendations:
SWE series in-situ swelling analysis system (IEST):
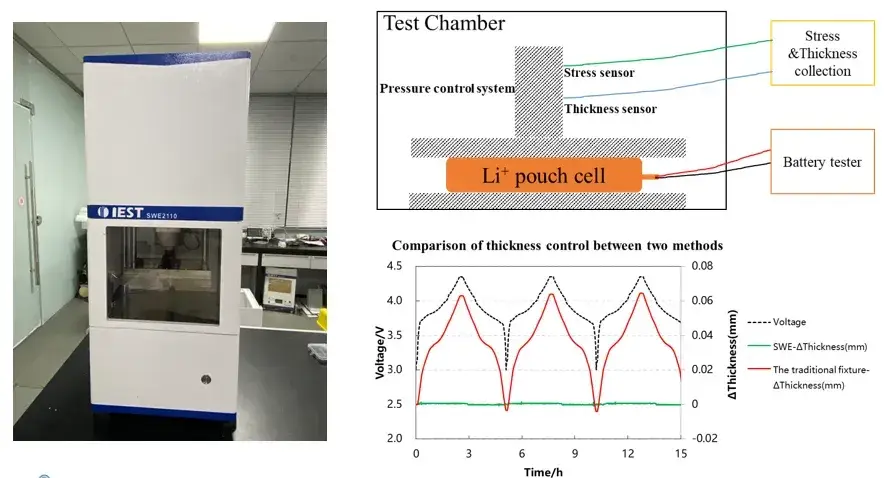
1. Integration of multiple in-situ cell characterization methods (stress & swelling thickness): Measure the swelling thickness and swelling force during the charging and discharging process of the cell at the same time, and quantify the changes in the swelling thickness and swelling force of the cell;
2. More detailed and stable testing system: utilizing a highly stable and reliable automated regulation platform, equipped with high precision thickness measurement sensors and pressure regulation system, the relative thickness measurement resolution is 0.1µm, realizing the long cycle monitoring of the long-term charging and discharging process of the battery cell;
3. Diversified environmental control and testing functions: SWE series equipment can adjust the temperature of the charging and discharging environment, which is helpful for the study of the swelling behavior of the electric core under high and low temperature conditions; in addition to the conventional thickness and pressure testing, it can also realize the testing of parameters such as the swelling force of the electric core, the compression modulus, and the compression rate.
Subscribe Us
Contact Us
If you are interested in our products and want to know more details, please leave a message here, we will reply you as soon as we can.


