

Lithium-ion batteries have become ubiquitous in modern life, powering devices from smartphones to electric vehicles and home energy storage systems. Consequently, comprehensive performance evaluation of these batteries is critically important. During charge and discharge cycles, lithium batteries undergo expansion and contraction, making expansion parameters essential considerations in battery module design. The emergence of next-generation high-capacity anode materials—such as silicon-based anodes or lithium metal anodes—has further intensified focus on expansion assessment, as these materials exhibit significantly greater structural expansion than conventional graphite anodes [1,2].
Traditional expansion evaluation methods require researchers to fabricate electrodes into single or multi-layer finished cells, leading to extended testing cycles, low assessment efficiency, and substantial resource consumption that severely hinders new material development. IEST has innovatively addressed this challenge by utilizing model coin cells to evaluate electrode expansion behavior, dramatically shortening assessment timelines while saving significant manpower and material resources for universities and enterprises. For this model button cell, users primarily concern themselves with two key questions: whether its cycling efficiency is comparable to conventional stainless steel coin cells, and how its measured thickness expansion compares with data from finished cells. This article presents comparative data addressing both aspects to facilitate user evaluation and selection.
This study employed IEST’s model coin cells alongside the Silicon-based Anode Expansion In-situ Rapid Screening System (RSS1400) for conducting charge-discharge tests and expansion measurements on both coin cells and pouch cells.
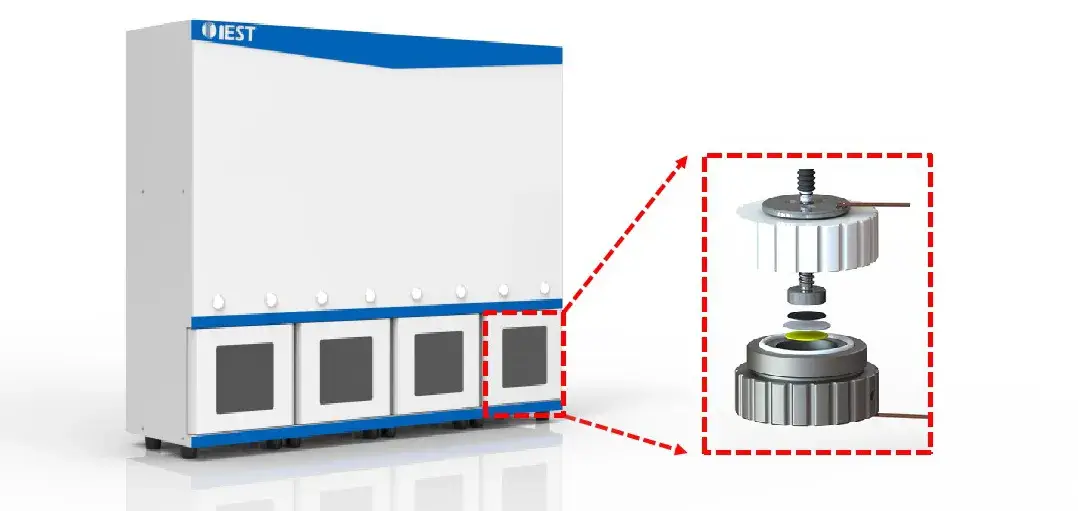
Figure 1. Silicon-based Anode Expansion In-situ Rapid Screening System (RSS1400)
Assembled NCM//Li coin half-cells and NCM//SiC coin full-cells using IEST’s model button cells, conducting 3 cycles at 0.1C rate for subsequent comparison with commercial stainless steel coin cells and single-layer stacked pouch cells
Assembled NCM//Li coin half-cells using commercial 2032 stainless steel coin cells, conducting 3 cycles at 0.1C rate
Assembled single-layer stacked NCM//SiC pouch cells, conducting 3 cycles at 0.1C rate
Placed NCM//SiC model coin full-cells and single-layer stacked pouch cells in the RSS1400 system, applying 5 kg initial preload force while monitoring real-time thickness expansion changes during 0.1C charge-discharge cycles.
Figure 2 shows IEST’s model coin cell (left) and the commercial 2032 stainless steel coin cell (right). We assembled coin half-cells using NCM cathodes of identical dimensions and composition, comparing their coulombic efficiency at 0.1C charge-discharge rate (Table 1):
The coin cell exhibited a first-cycle Coulombic efficiency of ~89.13%, which is ~0.718% lower than the commercial 2032 steel-cased coin cell (i.e., the difference between the two first-cycle values was ~0.718%).
Differences in the second and third cycles were also small; the maximum cycle-to-cycle efficiency gap between model button cell and 2032 coin cell did not exceed ~1.28%.
Statistical reproducibility (3-cycle COV of Coulombic efficiency) for the two formats showed a maximum COV of 0.65%, indicating good repeatability and reproducibility (COV defined as standard deviation / mean × 100).
These results demonstrate that IEST‘s model button cells deliver comparable cycling performance to commercial stainless steel coin cells.
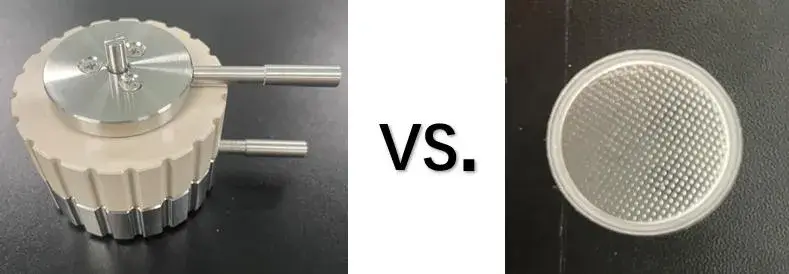
Figure 2. Left: IEST’s model coin cell; Right: Commercial 2032 stainless steel coin cell
| Metric (NCM//Li Half-Cell, 0.1C) | IEST Model Coin Cell | Commercial 2032 Coin Cell |
|---|---|---|
| First-cycle coulombic efficiency | ≈89.13% | ≈89.85% (derived: 89.13% + 0.718 percentage points) |
| Max cycle-to-cycle efficiency gap (cycles 1–3) | ≤1.28% | |
| 3-cycle coefficient of variation (COV) of coulombic efficiency | Up to 0.65% (both formats) | |
Note: the commercial 2032 first-cycle value is derived by adding the stated 0.718-percentage-point gap to the model coin cell’s stated 89.13%; the original source states the gap directly rather than the standalone commercial-cell figure. Full per-cycle values are also shown in the source Table 1 image below.
| Cycling Number | Model Coin Cell of IEST | ||
|---|---|---|---|
| Charging Capacity (mAh) | Discharging Capacity (mAh) | Efficiency (%) | |
| 1 Cycle | 5.9754 | 5.3257 | 89.13% |
| 2 Cycle | 5.3493 | 5.2676 | 98.47% |
| 3 Cycle | 5.2433 | 5.1527 | 98.27% |
| Cycling Number | Commercial 2032 Coin Cell | ||
| Charging Capacity (mAh) | Discharging Capacity (mAh) | Efficiency (%) | |
| 1 Cycle | 6.1131 | 5.4925 | 89.85% |
| 2 Cycle | 5.7871 | 5.7714 | 99.73% |
| 3 Cycle | 5.7631 | 5.7374 | 99.55% |
Figure 3 shows IEST’s model coin cell (left) and the single-layer pouch cell (right). Both configurations used NCM cathodes and SiC anodes of identical composition, assembled into full cells, with real-time thickness expansion monitored during 0.1C charge-discharge cycles. Coin cell voltage profiles and thickness expansion curves for both configurations appear in Figure 4, with detailed cycling efficiency and thickness expansion comparisons in Tables 2 and 3.
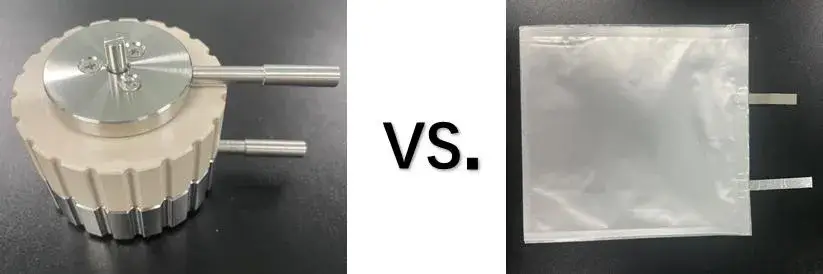
Figure 3. Left: IEST’s model coin cell; Right: Single-layer stacked pouch cell
Coin cell voltage and thickness profiles during 0.1C cycling showed strong overlap between the two formats. First-cycle full-cell coulombic efficiencies were 41.82% for the model coin cell and 42.42% for the single-layer pouch cell — a first-cycle gap of about 0.60 percentage points — while the largest difference across the subsequent two cycles was only 0.12%. Thickness expansion variability across three cycles yielded COV values under 3.5% for both formats, showing close agreement in measured expansion ratios.
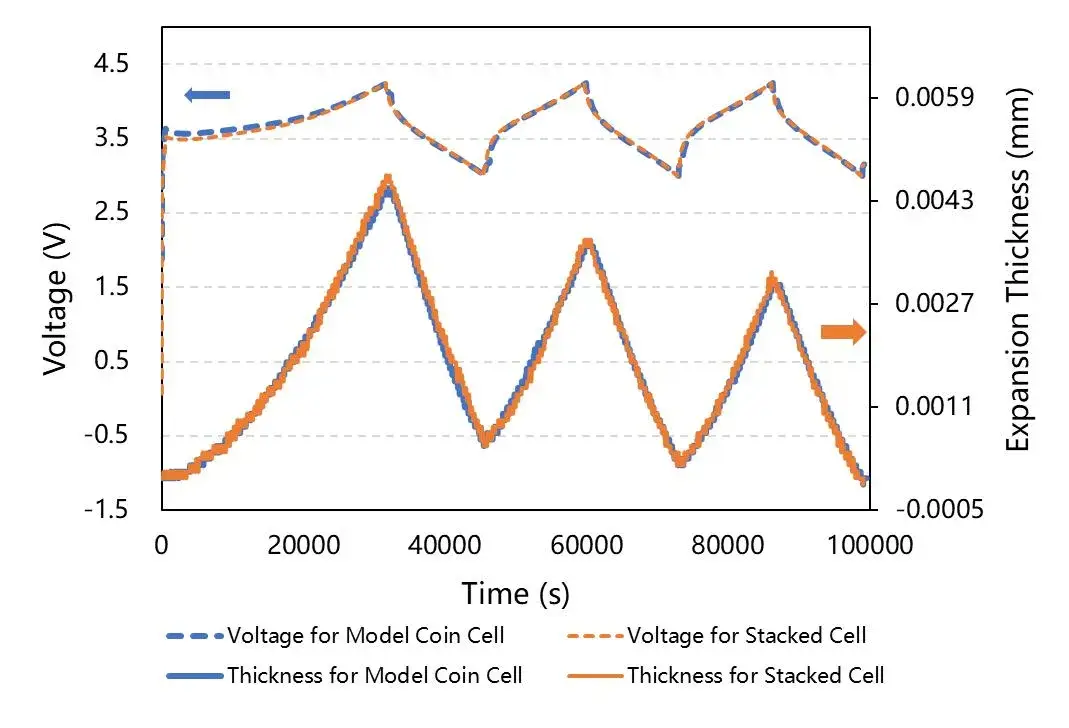
Figure 4. Blue dashed/solid lines: coin cell voltage curve and thickness expansion curve; Orange dashed/solid lines: Single-layer pouch cell voltage curve and thickness expansion curve
| Model Coin Cell | Stacked Cell | ||||
|---|---|---|---|---|---|
| Charging Capacity (mAh) | Discharging Capacity (mAh) | Efficiency (%) | Charging Capacity (mAh) | Discharging Capacity (mAh) | Efficiency (%) |
| 2.649 | 1.1078 | 41.82% | 38.5617 | 16.357 | 42.42% |
| 1.0579 | 1.0365 | 91.33% | 16.8475 | 15.4062 | 91.45% |
| 1.1059 | 1.0027 | 94.78% | 15.714 | 14.8831 | 94.71% |
| Cycling Number | Model Coin Cell | Stacked Cell | COV for Charging | COV for Discharging | ||
|---|---|---|---|---|---|---|
| Rate of Expansion Thickness for Charging | Rate of Expansion Thickness for Discharging | Rate of Expansion Thickness for Charging | Rate of Expansion Thickness for Discharging | |||
| 1 Cycle | 13.64% | -11.82% | 13.94% | -12.42% | 1.10% | -2.50% |
| 2 Cycle | 9.09% | -10.30% | 9.70% | -10.61% | 3.23% | -1.45% |
| 3 Cycle | 8.48% | -9.09% | 9.09% | -9.7% | 3.45% | -3.23% |
Taken together, the model coin cell provides thickness expansion trends that closely match those observed in single-layer stacked pouch cells, supporting its use for rapid screening of expansion behavior in silicon-based anodes.
The IEST model coin cell preserves critical stack architecture and electrode-to-electrode pressure conditions that determine thickness changes during cycling. Tested under a controlled preload in the RSS1400 system, the model format captures the same deformation trends observed in single-layer pouch assemblies.
Key advantages for R&D:
Faster screening: dramatically shortens evaluation cycles compared with full pouch builds.
Lower resource use: reduces electrode and cell component consumption for early material triage.
High sensitivity: RSS1400’s sub-micron resolution enables detection of minute reversible and irreversible expansions tied to phase changes or mechanical degradation.
Good predictive power: close correlation with single-layer pouch results supports confident down-selection for scale-up.
Recommended use case: use the IEST model button cell together with RSS1400 for early-stage evaluation of high-expansion anode materials (e.g., silicon composites) to rapidly compare formulations, coating thicknesses, and pre-treatment strategies before committing to larger pouch or cylindrical prototypes.
| Testing Matrix | Traditional Method | IEST Model Coin Cell + RSS1400 | Scientific Value / Improvement |
|---|---|---|---|
| Cell build required | Full single- or multi-layer pouch or cylindrical cell | Coin-format model cell preserving stack pressure conditions | Shortens assembly and evaluation cycles for early material screening |
| Expansion measurement | Typically measured only at the finished-cell level | Real-time thickness expansion under 5 kg preload via RSS1400 (0.1 μm accuracy, 0.01 μm resolution) | Captures reversible and irreversible expansion tied to phase change, not just a final thickness value |
| Validation basis | Assumed representative of production cell behavior | Directly cross-checked against commercial 2032 cells (efficiency) and single-layer pouch cells (expansion) | Provides a quantified confidence level (≤1.28% efficiency gap, <3.5% expansion COV) before scale-up |
This study comprehensively evaluated the charge/discharge efficiency and thickness expansion measurement capabilities of IEST’s model button cells. Results demonstrate that the model coin cells provide cycling efficiency essentially equivalent to commercial 2032 stainless steel coin cells, while thickness expansion rates across three cycles show fundamental agreement with measurements from single-layer pouch cells.
For optimal results in silicon-based anode expansion tests, we recommend using the model button cell with the Silicon-Based Anode Swelling In-Situ Screening System (RSS1400). This system offers exceptional precision, with thickness measurement accuracy of 0.1 μm and resolution up to 0.01 μm, enabling detection of subtle phase-change-induced expansion—making it an essential tool for developing next-generation, low-expansion, high-capacity anode materials.
IEST’s model coin cell, paired with the RSS1400 in-situ screening system, lets you validate coin cell voltage curves, coulombic efficiency, and thickness expansion against commercial 2032 and single-layer pouch cell benchmarks — before committing material and assembly time to a full prototype.
[1] J. Lin, L. Wang, Q.S. Xie, Q. Luo, D.L. Peng, C. B. Mullins and A. Heller, Stainless Steel-Like Passivation Inspires Persistent Silicon Anodes for Lithium-Ion Batteries. Angew. Chem. 135 (2023) e202216557.
[2] M. Ashuri, Q.R. He and L.L. Shaw, Silicon as a potential anode material for Li-ion batteries: where size, geometry and structure matter. Nanoscale 8 (2016) 74–103.
A model coin cell is a coin-format test cell built to preserve the stack architecture and electrode-to-electrode pressure conditions of a finished battery, allowing coin cell voltage behavior, coulombic efficiency, and thickness expansion to be screened much faster than building a full pouch or cylindrical cell.
A commercial 2032 coin cell uses a standard stainless steel case and is widely used as a lab reference format. IEST’s model coin cell is designed to closely match that reference performance while offering a format suited to rapid, repeated screening; in NCM//Li half-cell testing, the two formats showed a first-cycle coulombic efficiency gap of only about 0.718 percentage points.
Coin cell voltage and coulombic efficiency behavior between the IEST model coin cell and a commercial 2032 coin cell showed a maximum cycle-to-cycle efficiency gap of about 1.28% across three 0.1C cycles, with a coefficient of variation (COV) up to 0.65%, indicating close, reproducible agreement between the two formats.
Yes, in NCM//SiC full-cell testing, the model coin cell’s thickness expansion curve closely tracked the single-layer pouch cell’s expansion curve, with expansion coefficient of variation (COV) under 3.5% for both formats across three 0.1C cycles, supporting the model coin cell as a rapid screening proxy for pouch cell expansion behavior.
Small differences in coin cell discharge curves between formats typically stem from cell construction details such as stack pressure, current collector contact, and cell casing, rather than the active material itself. In this comparison, the model coin cell and commercial 2032 cell showed overlapping voltage and thickness profiles, with only a 1.28% maximum efficiency gap across cycles.
Coin cell testing with a model coin cell is well suited for early-stage screening of formulations, coating thicknesses, and pre-treatment strategies, since it is faster and uses fewer materials than a full pouch cell build. Pouch cell testing remains useful for confirming scale-up performance once a formulation has been down-selected using coin cell voltage, efficiency, and expansion data from model coin cell screening.
