-
iestinstrument
Non-destructible Lithium Deposition of Li-ion Pouch Cells-Rate Window
The wide application of lithium-ion batteries, end customers also put forward higher and higher requirements for the fast charging performance of lithium-ion batteries. But blindly improve the fast charging performance of lithium battery will bring a certain degree of safety risks, among which the most serious consequence is the occurrence of lithium deposition, on the one hand, lead to capacity loss, on the other hand, there may also be the positive and negative electrode short circuit when piercing the diaphragm. How to evaluate whether the battery analyzer lithium? The traditional method is to dismantle the pouch cell method to quickly determine the lithium deposition window of the pouch cell.
By dismantling the full charging cell, the naked eye observes whether there is gray and white on the negative surface of the negative lithium deposit. However, the disassembly method is a non-in situ method. On the one hand, the operation is troublesome, and on the other hand, it can only judge the approximate lithium deposition ratio or temperature, and cannot obtain the accurate lithium deposition window of the cell, such as the ratio, voltage, capacity, temperature and other comprehensive information. This paper uses the in-situ swelling analyzer (SWE) to quantitatively evaluate the potential window of lithium deposition at different ratios, providing a new method for researchers to develop rapid charging strategies at different ratios.
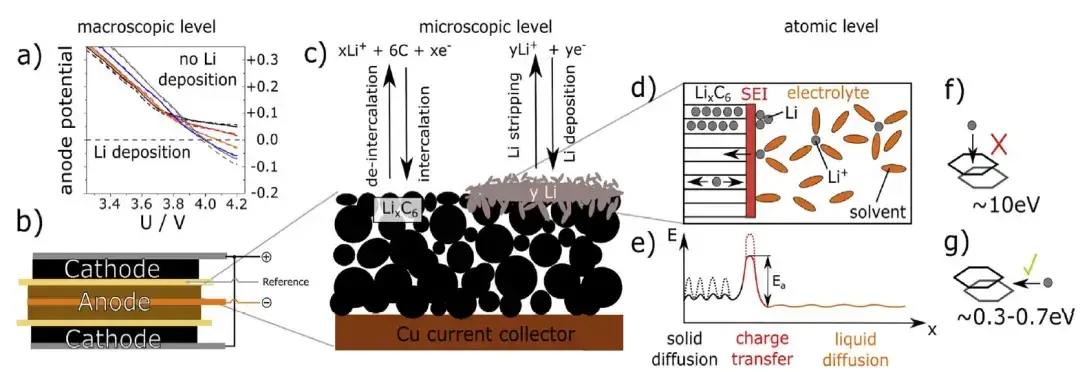
Figure 1. Analysis the causes and risks of lithium1
1. Test Information
1.1 Test Equipment
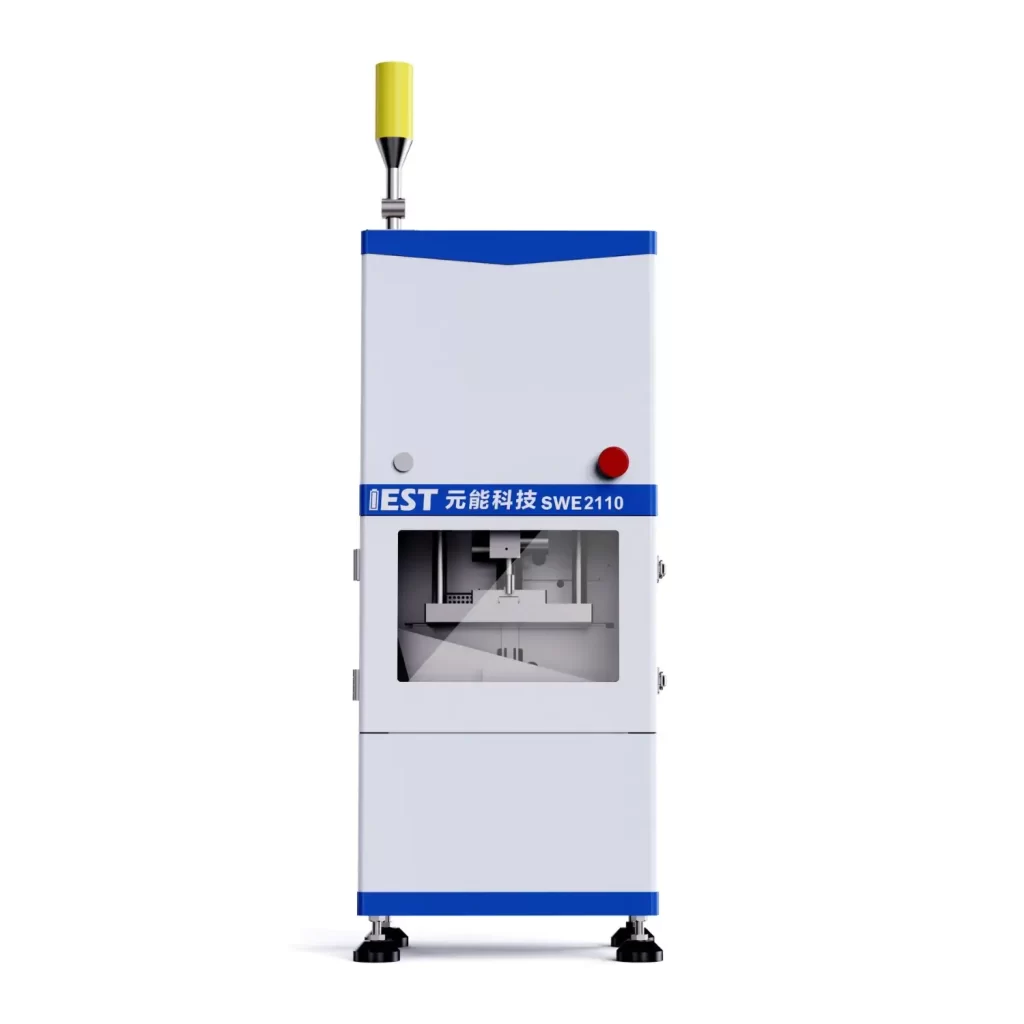
In-situ swelling analyzer, model SWE2100, can apply the pressure range of 5~10,000 N, can control the temperature of- 20℃~80℃, as shown in Figure 2.
Figure 2. Schematic diagram of the in-situ swelling analyzer(SWE Series)
2. Test Parameter
2.1 The Cell Information is Shown in Table 1
Table 1. Cell Information
| Cell Information | |
| Material | NCM532/ Graphie |
| Capacity | 2400mAh |
| Voltage | 3.8V |
| Model | Pouch cell-345877 |
2.2 Test Process
Put in the test chamber of in-situ swelling analyzer of high and low temperature box, set the temperature to 5℃, adjust the charging ratio of the cell to 0.2C, 0.5C, 0.8C, 1.0C, 1.5C, cut-off current of 0.05C, and discharge current of 2A. Open the in-situ swelling analyzer to monitor the cell swelling thickness change curve (5kg constant pressure mode) simultaneously.
3. Interpretation of Result
At 5℃ ambient temperature, soft pack cells are filled with five different ratios, charging change curve and in-situ swelling thickness change curve are shown in Figure 3. 0.2C, 0.5C, 0.8C, 1.0C, 1.5C maximum thickness is 58.7m, 60.0m, 62.4m, 67.4m, 87.1m, and swelling rate is 1.82%, 1.86%, 1.92%, 2.09%, 3.75% respectively. Compared with the swelling curve, the 1.0C and 1.5C ratio curves are significantly different from the other three curves, especially the slope of the swelling thickness in the high SOC state. It is preliminarily suspected that 1.0C ratio is slightly lithium, and that 1.5C ratio is seriously lithium.
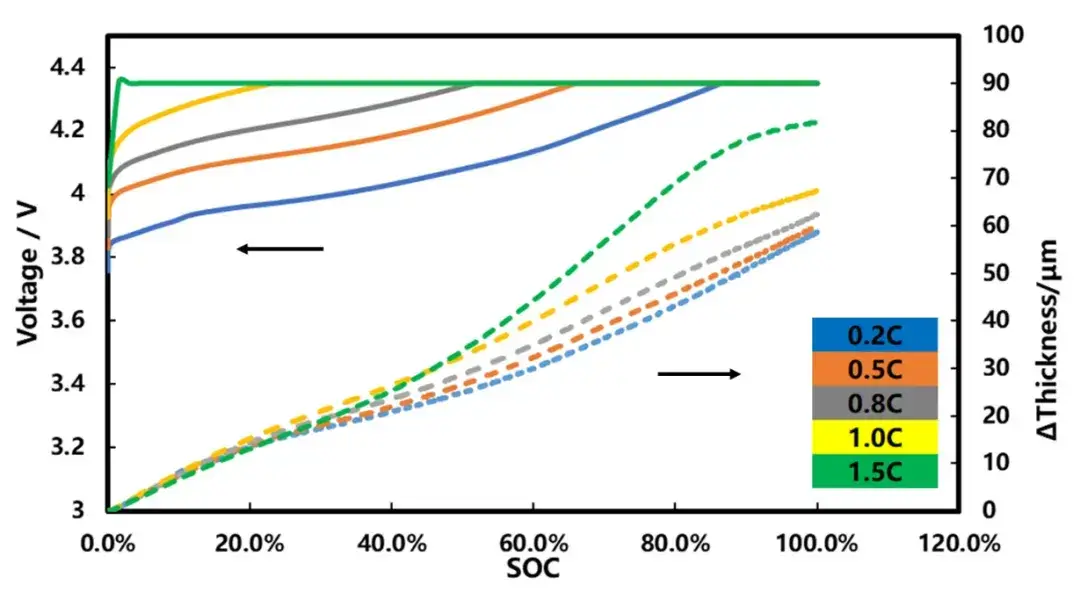
Figure 3. Charging curve and thickness change curve of different ratios
The differential capacity curves for different temperatures were further analyzed, as shown in Figure 4. As can be seen from the figure, the peak position of the differential capacity curve corresponding to 0.2C, 0.5C and 0.8C is synchronized with the change of the thickness swelling rate, indicating that the thickness change of the cell charging process is caused by the phase change of the positive and negative electrode material. With the doubling rate, the phase change peak moves to the right, indicating that the polarization is increasing. The slope of the differential capacity capacity curve is obviously different from others.
As shown in Figure 5, it is also obvious that the 1.0C and 1.5C x thickness swelling curves begin to separate from the other trix thickness swelling curves when the SOC is about 15%. This is likely because as the test ratio increases, the cell polarization increases, and there is lithium deposition on the negative surface, which leads to the acceleration of the thickness swelling. To verify whether the pouch cell has lithium deposition, observe negative surface color after disassembly, the figure 6. 1.5C rate full charge, pole surface all gray white, 1.0C times full charge, pole surface part gray white, indicating that both have different degrees of lithium deposition, and 0.8C rate under filling negative pole is golden yellow, no lithium phenomenon, this is consistent with our conclusion from the thickness swelling curve.
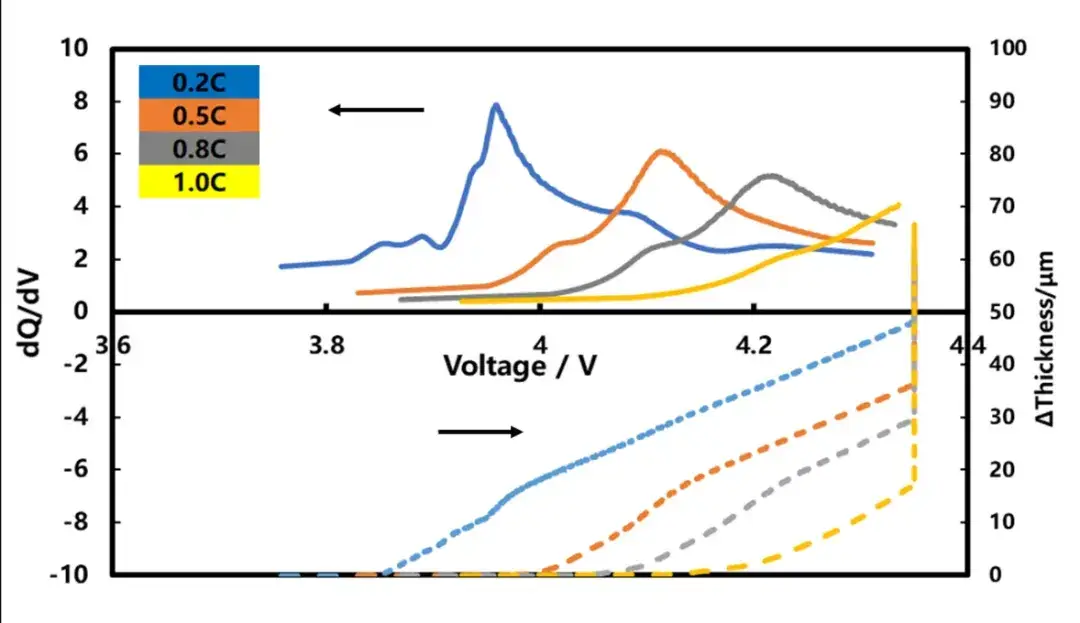
Figure 4. Change curve of differential capacity and thickness of cell charging
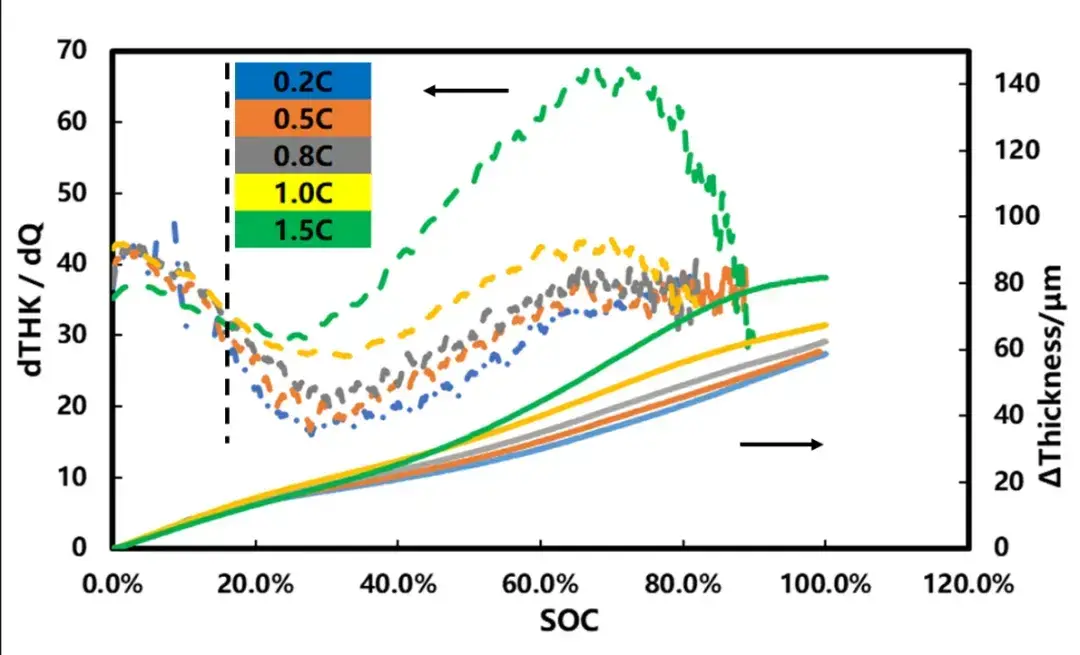
Figure 5. Cell thickness swelling curve and differential curve
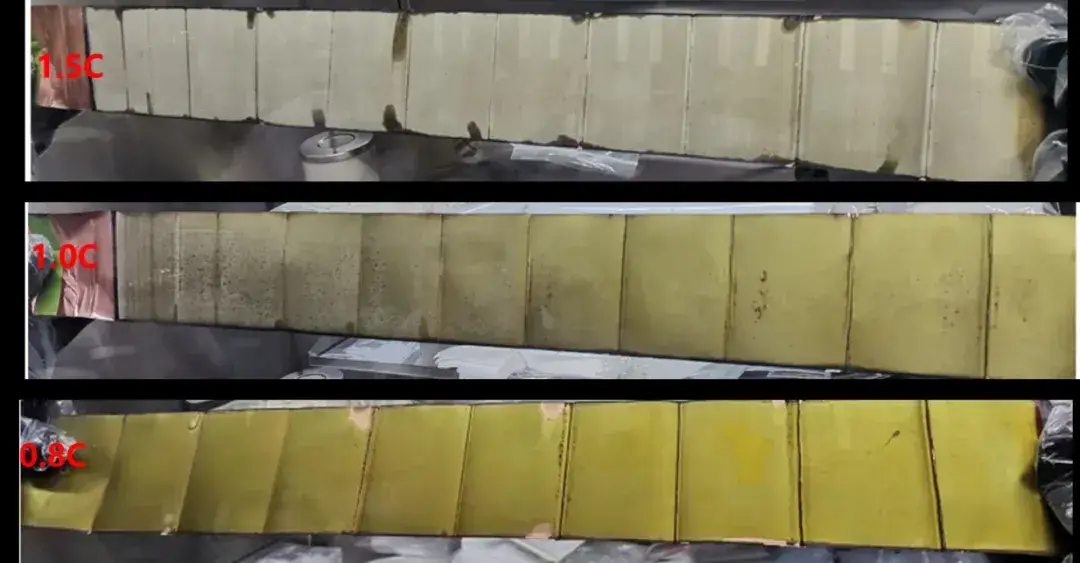
Figure 6. Full charge and disassembly picture of the electric cell
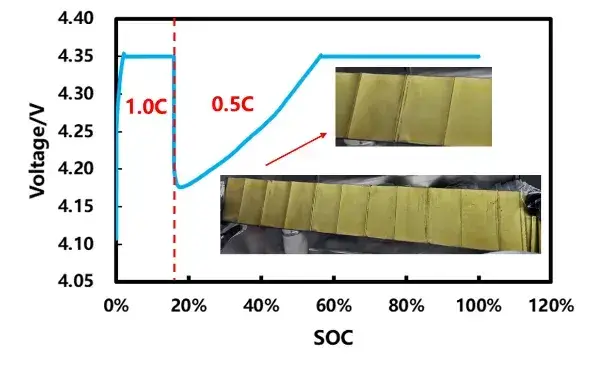
To further verify the location of lithium deposition, we conducted two sets of different multiplier cascade charging experiments, respectively to smaller times before and after the inflection point of the thickness swelling curve: one set of cell at 0.5C after about 15.7%SOC after 1.0C to full charge, the other set of cell using 0.5C about 27.4%SOC after 1.5 C to full charge (Figure7). After dismantling the cells respectively, slight lithium deposition was found on the surface of 27.4%SOC anode, and not golden yellow without lithium deposition in 15.7%SOC. This shows that the lithium deposition spot when charged at the 1C multiplier occurs between the S OC and 15.7% and 27.4%. Compared with Figure 5, it is basically consistent with the corresponding S OC position when the 1.0C swelling slope curve begins to bifurcate.
 |
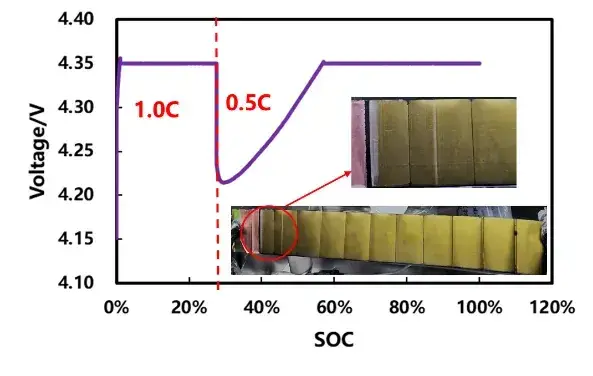 |
Figure 7. Cell ladder ratio charging curve and disassembly picture
4. Summary
This paper using in-situ swelling analyzer (SWE) for LCO system cell, in the same temperature at different rates of the swelling behavior analysis, by comparing the expansion of different charging times thickness change rate, get the system cell in 5℃ ambient temperature greater than 1.0C times constant current charging occurs lithium, determine the lithium deposition window for 1.0C to about 15% SOC gradually start lithium. Accurate quantification of lithium deposition voltage and SOC window of cells at different rates can effectively guide researchers to develop appropriate fast charging strategies to ensure safe and efficient charging at different rates.
5. References
[1]. Thomas Waldmann, Björn-Ingo Hogg, Margret Wohlfahrt-Mehrens.Li plating as unwanted side reaction in commercial Li-ion cells -A review.Journal of Power Sources 384 (2018) 107–124.
[2]. Anna Tomaszewska, Zhengyu Chu, Xuning Feng, et al.Lithium-ion battery fast charging: A review.eTransportation 1 (2019) 100011.
Subscribe Us
Contact Us
If you are interested in our products and want to know more details, please leave a message here, we will reply you as soon as we can.


