-
iestinstrument
The Effect of Electrolyte Additives on Gas Production and Gas Composition of Cells
1. Preface
Electrolyte is one of the four main materials of lithium-ion batteries, known as the “blood” of lithium-ion batteries. Electrolyte is mainly composed of organic solvents, electrolyte lithium salts, and different types of electrolyte additives. The organic solvent is the main part of the electrolyte. The common solvents for lithium-ion batteries are ethylene carbonate (EC), diethyl carbonate (DEC), dimethyl carbonate (DMC), methyl ethyl carbonate (EMC), etc. The mixed solvent of EC and a chain carbonate is an excellent electrolyte for lithium-ion batteries, such as EC+DMC, EC+DEC, etc.
LiPF6 is the most used electrolyte lithium salt, which is stable for the negative electrode, has high discharge capacity, high conductivity, low internal resistance, and fast charging and discharging speed. However, it is extremely sensitive to water and HF acid, is prone to reactions, and is not resistant to high temperatures. It decomposes from 80 ℃ to 100 ℃, generating phosphorus pentafluoride and lithium fluoride. Suitable additives can effectively reduce the trace amount of water and HF acid in the electrolyte, thereby effectively inhibiting the occurrence of LiPF6 hydrolysis reaction. At present, there is a lot of research on the types of electrolyte additives, and different manufacturers have differences in the performance and requirements of batteries.
The types of additives selected may also vary. Generally, additives not only reduce the water and HF in the electrolyte, but also have applications in improving interface stability, high and low temperature performance, and preventing overcharging and discharging. Figure 1 Shows the calculation results of reduction potential of several common solvents, additives and desolved ions 1.
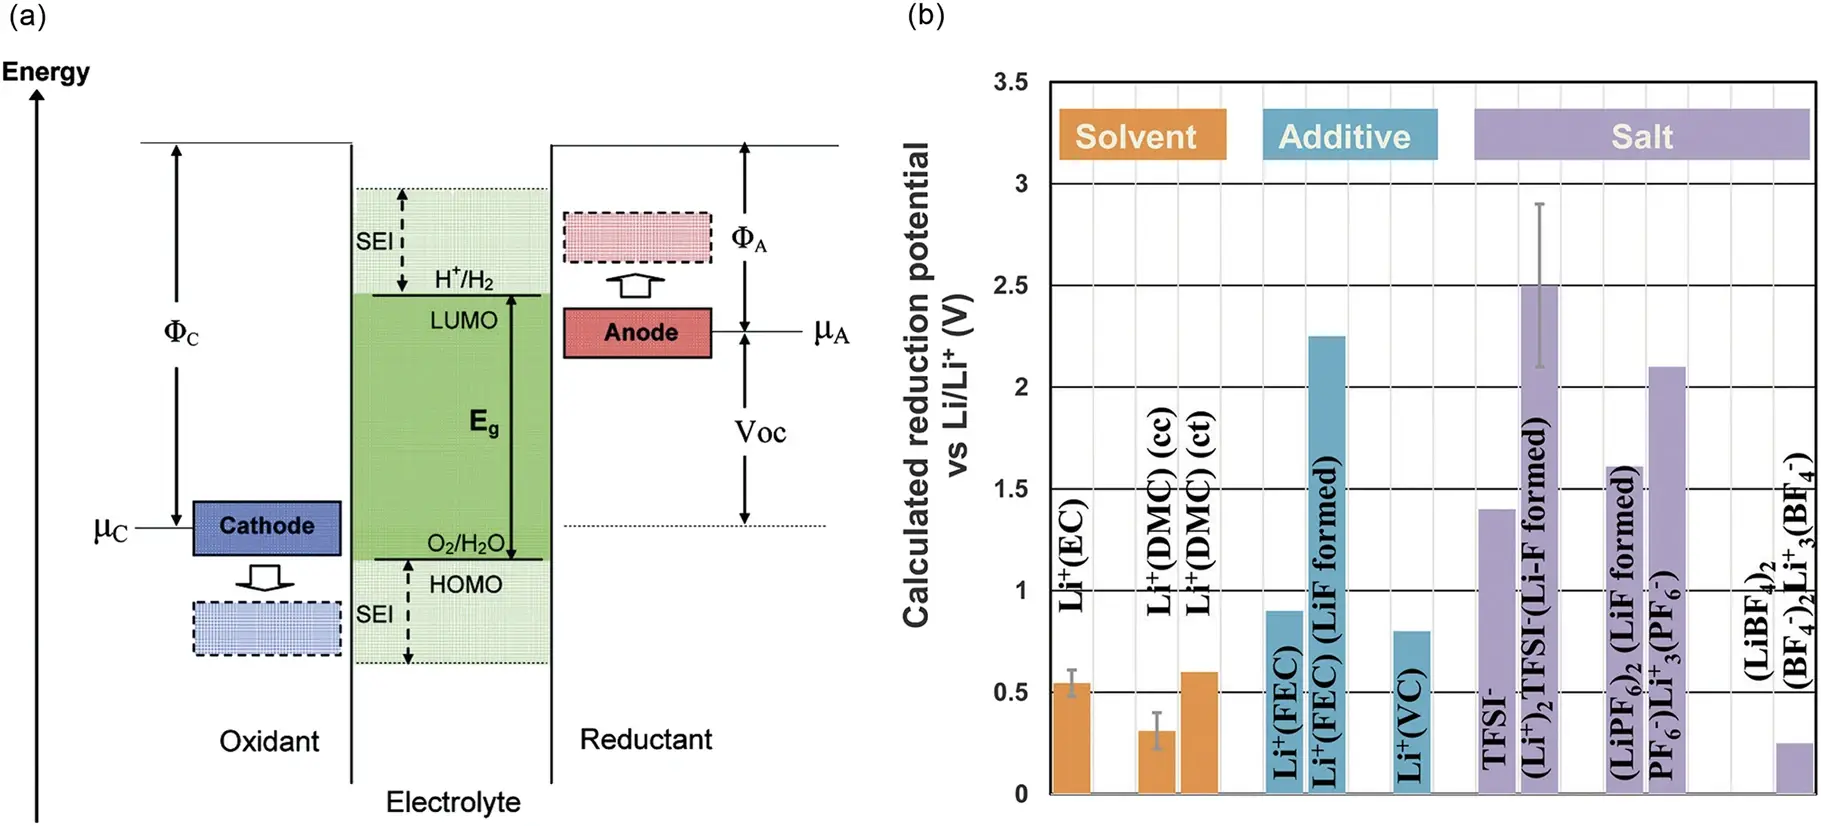
Figure 1. (a)Schematic diagram of electrolyte open circuit energy; (b)Calculation Results of reduction potential of Several Common Solvents, Additives and Desolved Ions 1
The influence of electrolyte additives on the gas production of lithium-ion batteries is crucial, and the gas production inside the battery directly increases the safety risk of battery use. Therefore, battery gas production is one of the important indicators for evaluating battery quality and reliability. At present, research on the gas generation behavior of lithium-ion batteries at home and abroad mainly focuses on two aspects: the positive electrode and the electrolyte.
This article analyzes the influence of different electrolyte additives on the gas production behavior and gas composition of the battery by combining the NCM cathode electrode with the half-cell system of Li.
2. Experimental Equipment and Testing Methods
2.1 Experimental Equipment
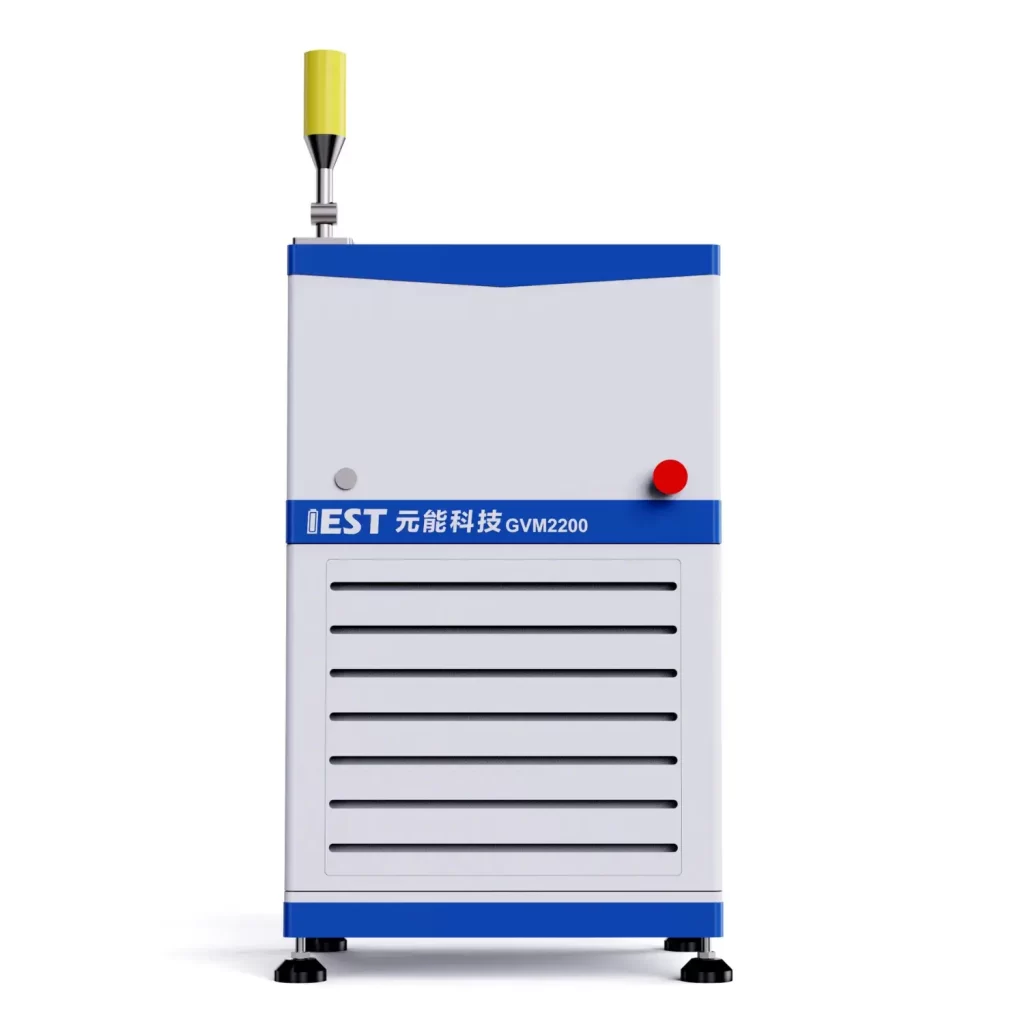
GVM2200 (IEST), with a testing temperature range of 20 ℃~85 ℃, supporting dual channel (2 cells) synchronous testing. The equipment appearance is shown in Figure 2.
Figure 2. Appearance of GVM2200 Equipment
2.2 Test Parameters
0.3C CC to 4.4V at a temperature of 70 ℃.
2.3 Testing Method
Select different electrolyte additives systems (Electrolyte 1 & Electrolyte 2, where Electrolyte 2 adds some additives on top of Electrolyte 1) and assemble them into a single layer stacked cell in a glove box. Perform an initial weighing of the cell m0, place the cell to be tested in the corresponding channel of the device, open MISG software, set the corresponding cell number and sampling frequency parameters for each channel, and the software will automatically read the volume change, test temperature, and current, Voltage, capacity, and other data. The gas composition test was conducted using a GC-2014C gas chromatograph. After overcharging, 1mL of gas was taken out of the battery cell in a glove box, and different types of gas concentrations were tested using TCD and FID detectors. The measurable gas types are shown in Figure 3.

Figure 3. Gas composition that can be tested by FID and TCD detectors
3. In-situ Gas Production and Composition Analysis of Different Electrolyte Additives Systems
3.1 Analysis of Charging Voltage Curve and Unit Volume Change Curve
The voltage and unit volume change curves of two different electrolyte additives systems are shown in Figure 4 from the cell curves of Electrolyte 1 and Electrolyte 2, it can be seen that there are significant differences in the charging voltage and volume change curves of the two electrolyte additives systems.
From the curve of unit volume change, it can be seen that the Electrolyte 1 system battery cell maintains a relatively high rate of volume change throughout the entire charging stage, while the Electrolyte 2 system battery cell maintains a relatively low rate of volume change during the initial charging stage. The charging voltage reaches around 4.2V, and the SOC of the battery cell reaches about 80% before the rate of volume change significantly increases, This indicates that the addition of additives in the Electrolyte2 system can effectively reduce the unit gas production rate of NCM on Li cells.
From the voltage curve, compared to the Electrolyte1 system, the average charging voltage of the Electrolyte2 system cell is higher. If the differences in cell assembly are ignored, the addition of additives in the Electrolyte2 system may cause the NCM positive electrode of the cell to react with electrolyte additives, resulting in a lower average voltage of the cell.
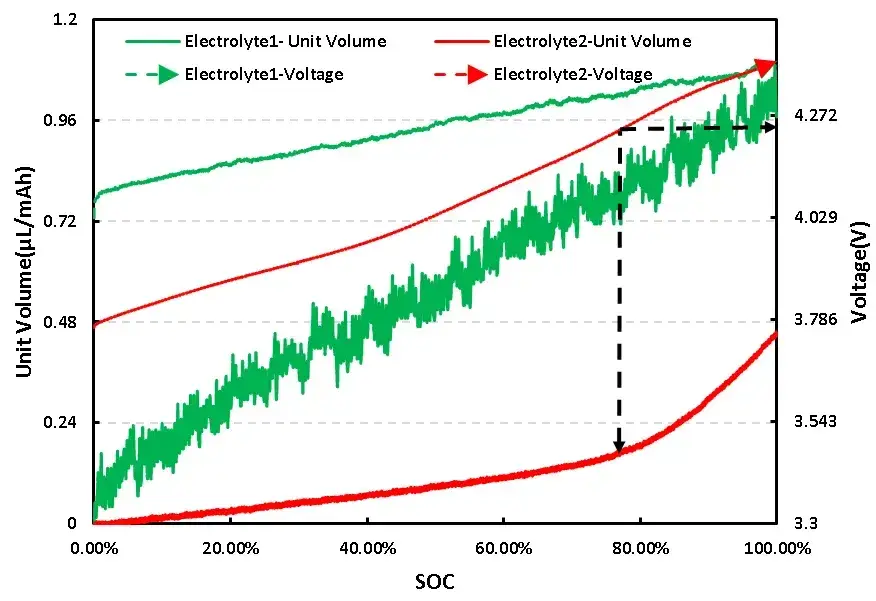
Figure 4. Charging voltage and unit volume change curve of two electrolyte additives systems
3.2 Analysis of Gas Production Components in Cells of Different Electrolyte Additives Systems
Gas chromatography was used to analyze the gas composition of the two electrolyte additives systems after charging the core, respectively, and 1 mL of the gas was taken out and qualitatively analyzed by gas chromatography, as shown in Figure 5 for the analysis of the composition of the gas produced by different electrolyte additives systems, and the comparative analysis found that compared with the Electrolyte1 system, the gas produced by the Electrolyte 2 system with the addition of additives was significantly reduced in the category of CO 2 decreased significantly, while CO increased significantly.
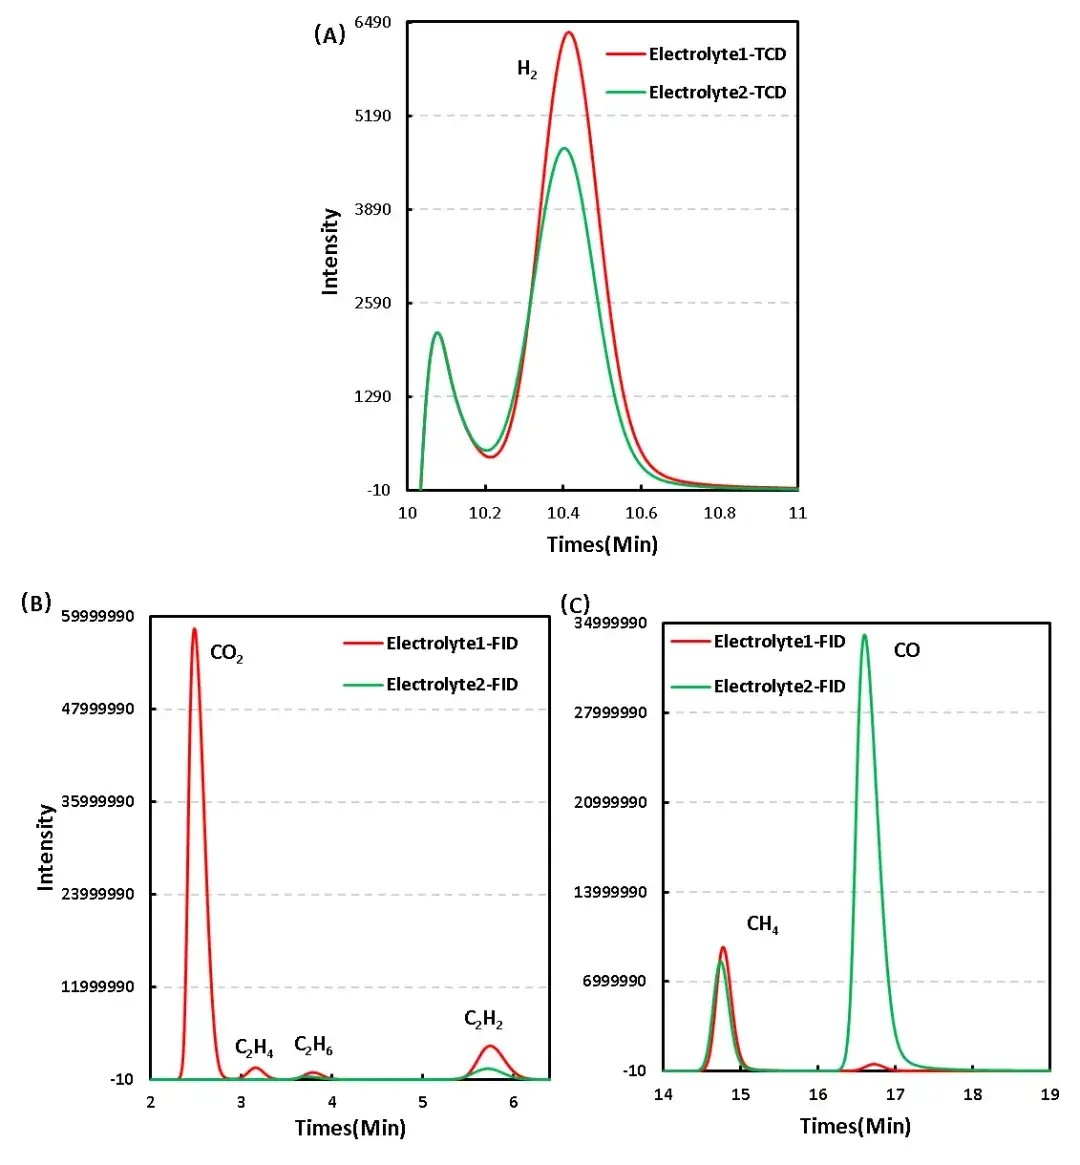
Figure 5. Difference in gas production composition between different electrolyte additives systems: TCD & FID
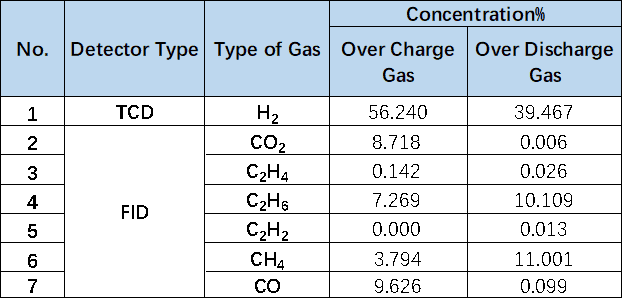
To further clarify the differences in gas production between the two electrolyte additives systems, a comparative analysis was conducted on their gas production types and concentrations. As shown in Table 1 and Figure 5, the CO2 concentration of the Electrolyte1 system after charging was 6.949%, while the CO2 concentration of the Electrolyte2 system after adding additives was almost zero. According to relevant research reports, CO2 is the main gas in the positive electrode reaction 2, and the positive electrode gas is mainly generated by the side reaction between the positive electrode material and the electrolyte, This indicates that the additive in Electrolyte2 electrolyte may be an effective positive electrode film-forming additive, which can form a stable protective film on the surface of the positive electrode, thereby effectively reducing the occurrence of side reactions between the positive electrode and the electrolyte. Similarly, the decrease in C2H4 and C2H2 concentrations is also related to the reaction changes of the positive electrode in this system.
For the CO concentration changes related to the negative electrode reaction, compared to the CO concentration of 0.097% in the Electrolyte 1 system, the CO concentration in the Electrolyte2 system increased to 6.870% after adding additives. Due to the significant influence of temperature on the gas production reaction of the negative electrode material in the cell system, it appears that the addition of additives in the Electrolyte2 system will reduce the thermal stability of the negative electrode and accelerate the occurrence of side reactions at high temperatures. In addition, there may be different concentrations of other types of gases, which may be related to differences in cell assembly in addition to differences in electrolyte additives systems.

Figure 5. Comparison of gas production types and concentrations in different electrolyte additives systems
Table 1. Table comparing the concentration of gas production types in different electrolyte systems
4. Summary
This article uses a controllable temperature dual channel in-situ gas production volume monitor(GVM2200), combined with gas chromatography, to compare the gas production behavior and gas composition differences of NCM on Li system batteries under different electrolyte additives systems. It further clarifies the differences in the electrochemical reaction inside the battery cell caused by additives and confirms that this analysis system can be an effective means for optimizing electrolyte formula, evaluating and screening additive performance.
5. References
[1] Wang A , Kadam S , Li H , et al. Review on modeling of the anode solid electrolyte interphase (SEI) for lithium-ion batteries[J].
[2] Chen Weifeng Research and prediction of gas production mechanism for flexible packaging lithium-ion batteries [D] Tsinghua University, 2012.
[3] Liang K , Pakhira S , Yang Z , et al. S-Doped MoP Nanoporous Layer Toward High-Efficiency Hydrogen Evolution in pH-Universal Electrolyte[J]. ACS Catalysis, 2018, 9(1).
[3] Cui Shengyun,Electrochemical Polymerization of Biphenyl and P-terphenyl in Organic Solvent [J], Electrochemistry, 2000,6 (4): 428-433.
Subscribe Us
Contact Us
If you are interested in our products and want to know more details, please leave a message here, we will reply you as soon as we can.


