-
iestinstrument
Cyclic Voltammetry (CV) Overview: A Core Tool in Electrochemical Research
1. “Duck Curve” in Electrochemical Testing
Perhaps you’re not a professional in the field of electrochemistry, but while browsing relevant journals, attending academic conferences, or visiting websites of electrochemical equipment manufacturers, you may often come across a particular graphic. It presents itself as two peaks resembling the shape of a duck. Within the industry, we commonly refer to it as a ‘Cyclic Voltammetry.’ It looks like this:
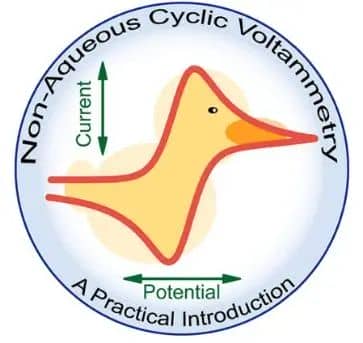
Figure 1. Cyclic voltammogram
2. Formation Mechanism of Oxidation Peak and Reduction peak
In electrochemical research, we often gain insights into the nature of chemical reactions by observing the flow of electrons. In the field of inorganic chemistry, electrochemical processes typically involve the oxidation or reduction of metal compounds. The reduction in traditional chemical reactions usually requires the addition of a chemical substance to accomplish. However, in electrochemical experiments, reduction can be achieved simply by applying electrons to the electrode. The driving force for chemical reduction comes from the energy difference between molecular orbitals, whereas in electrochemistry, reduction arises from the driving force of external electrons. Cyclic voltammetry and electrochemical impedance spectroscopy are the two most commonly used testing methods in the field of electrochemistry. Cyclic voltammetry plots current against voltage, providing a visual representation of the current response to voltage changes. Cyclic voltammetry is a widely employed technique, often utilized to evaluate the physical and chemical properties of the electrode-electrolyte interface (the electrochemically active surface). The electrochemically active surface is ubiquitous in numerous electrochemical devices, including lithium batteries, fuel cells, as well as various electrochemical catalytic reactions and sensors.
The English name for Cyclic Voltammetry is cyclic voltammetry, abbreviated as CV, hence often referred to as CV testing, with the resulting curve termed as the CV curve. Its core principle lies in applying a voltage with a constant scanning rate to the electrode and continuously monitoring the relationship between electrode surface current and potential, thereby characterizing the reactions occurring at the electrode surface and exploring their electrochemical reaction mechanisms. Typically, we apply potential changes in a cyclic manner: starting from an initial potential, scanning at a fixed rate to a final potential, and then returning to the starting potential at the same rate. During this process, we can plot the cyclic voltammogram of a reversible oxidation reaction. When scanning from low to high voltage, oxidation peaks producing oxidation currents appear, whereas during the reverse scan, reduction peaks appear. By analyzing the cyclic voltammogram, we can determine the potentials at which oxidation-reduction reactions occur.
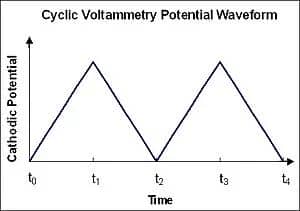
Figure 2. Applied potential curve
3. How Do Interface Properties Affect CV Test Results?
From a microscopic perspective, the interface between the electrode and electrolyte is a rather complex system. Firstly, different electrode materials and electrolytes result in varied interface properties and surface morphologies. Secondly, at the electrode surface, processes such as electron transfer, ion transport, and chemical reactions occur simultaneously, forming a complex electrochemical reaction interface. The rates and kinetic characteristics of these reactions depend on factors such as the chemical activity, structure, and surface defects of the electrode surface. Currently, there is still incomplete understanding of the chemical properties of the electrode-electrolyte interface, making this field an active area of academic research.
4. ERT7008 Electrochemical Analyzer: An Efficient Assistant for CV Testing
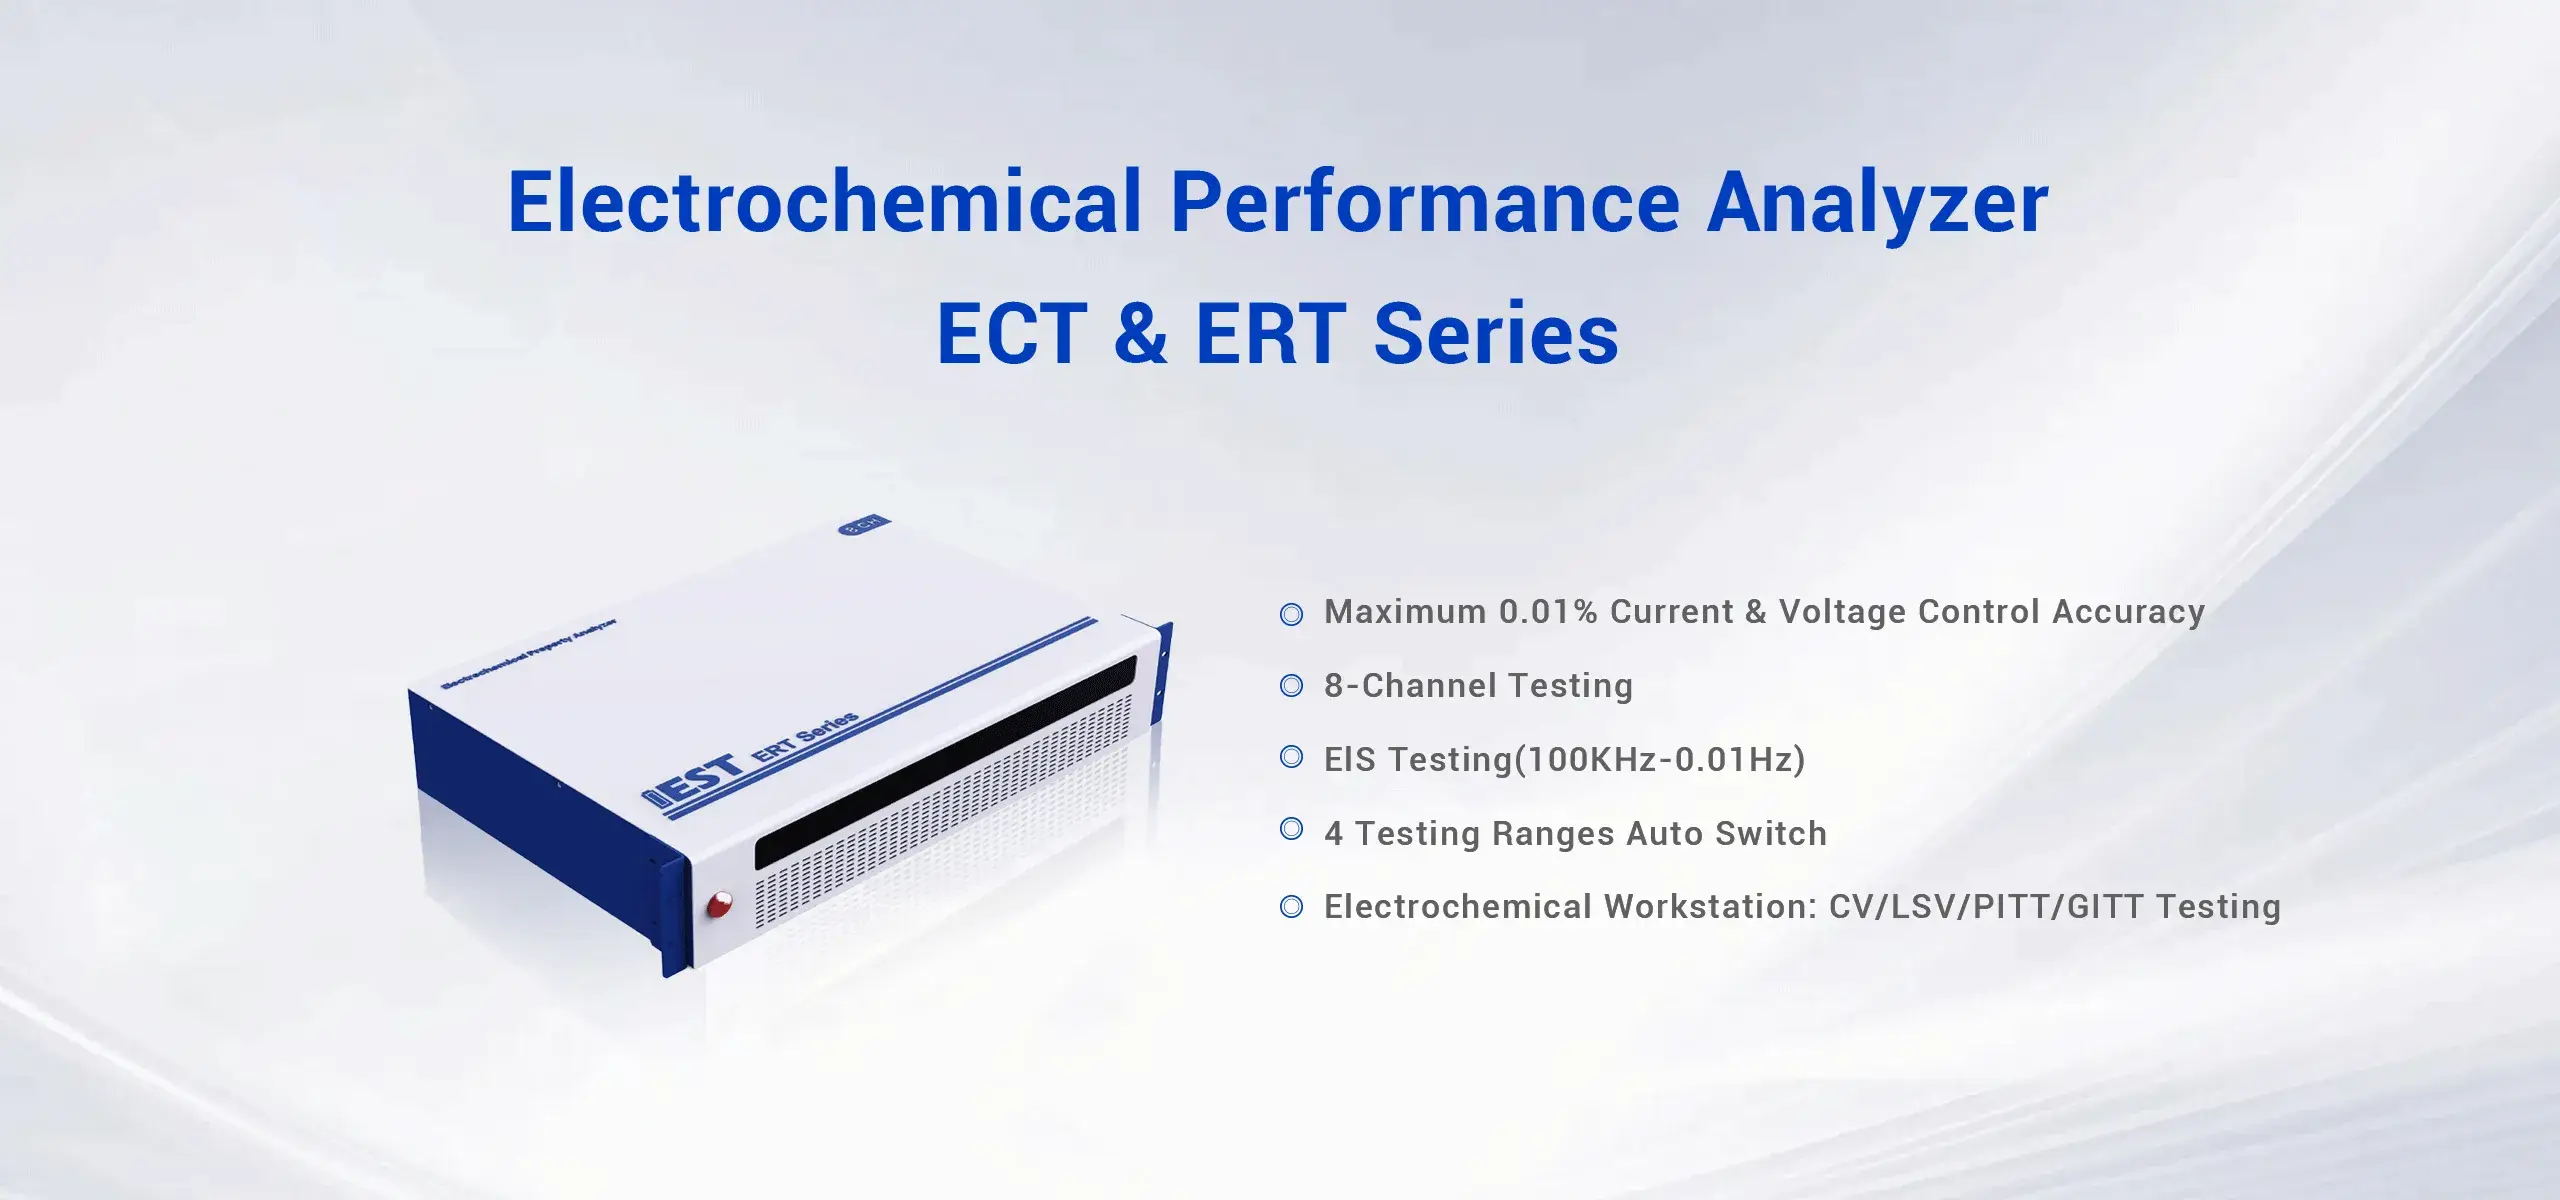
Firstly, cyclic voltammetry testing is an advanced technique that is convenient, fast, and cost-effective. Let’s first understand the equipment and parameter settings required for performing cyclic voltammetry tests. Below is the ERT7008, an eight-channel electrochemical performance analyzer developed by IEST, along with the setting of cyclic voltammetry test steps in the accompanying control software, IEST Console.
Figure 3. IEST ERT & ECT Series
The IEST ERT7008 series not only features conventional charge-discharge functions but also integrates CV (Cyclic Voltammetry) and EIS (Electrochemical Impedance Spectroscopy) modules, meeting the requirements for routine electrochemical testing. The specific parameters are as follows:
| ERT6008(Cyclic Voltammetry Analyzer) | ERT7008(Electrochemical Impedance Analyzer) | ||||||||
|---|---|---|---|---|---|---|---|---|---|
| Photo |  |
 |
|||||||
| Type | ERT6008-5V6A | ERT6008-5V12A | ERT7008-5V100mA | ERT7008-5V6A | ERT7008-5V12A | ||||
| Voltage | 0-5V | 0-5V | ±5V | ||||||
| Current | 0.6μA~6mA 6mA~60mA 60mA~0.6A 0.6A~6A |
1.2μA~12mA 12mA~120mA 120mA~1.2A 1.2A~12A |
10nA~0.1mA 0.1mA~1mA 1mA~10mA 10mA~100mA |
0.6μA~6mA 6mA~60mA 60mA~0.6A 0.6mA~6A |
1.2μA~12mA 12mA~120mA 120mA~1.2 A 1.2A~12A |
||||
| ★EIS testing ★ | × | EIS (Electrochemical Impedance Spectroscopy) testing: 0.01Hz~100kHz |
|||||||
| ★Electrochemical features ★ |
Cyclic Voltammetry (CV), Linear Sweep Voltammetry (LSV), GITT/PITT/CA/CP Testing | ||||||||
| Temp. Chamber | -20~80℃ | ||||||||
| Channel | 8 | ||||||||
| Maximum Sampling Rate | 100 SPS | ||||||||
| Output | Four-Electrode Aviation Connector (Supports three-electrode testing with auxiliary voltage integration) |
||||||||
| Current & Voltage Control Accuracy | ± 0.01% F.S. | ||||||||
| CP&CR Accuracy | ± 0.02% F.S. | ||||||||
| Resolution | 16bit | ||||||||
| Input Power | 500W/1000W | 30W | 500W/1000W | ||||||
| Operating Modes |
Charge-Discharge Modes: Constant Current Charge/Discharge (CC) Constant Voltage Charge/Discharge (CV) Constant Current-Constant Voltage Charge/Discharge (CC-CV) Constant Power Charge/Discharge (CP) Constant Resistance Charge/Discharge (CR) DCIR (Direct Current Internal Resistance) Rate Charge/Discharge
Electrochemical Modes: |
||||||||
5. Analysis of the Practical Application of CV Test
In the cyclic voltammetry step, parameters to be set include the number of cycles, points per cycle, initial voltage, final voltage, scan rate, current threshold, and N-cycles execution. The number of cycles refers to the number of times the applied potential is cycled, points per cycle represent the data recording frequency, initial and final voltage determine the voltage scan range, scan rate refers to the rate of voltage change, and the current threshold is used to define the safe range of current to avoid exceeding the battery’s safety current range. N-cycles execution allows cyclic voltammetry testing to be performed under specified cycle numbers. Once these parameters are set, the testing can commence. After testing, you will obtain your own cyclic voltammogram. If all goes well, you may get a curve similar to the following:
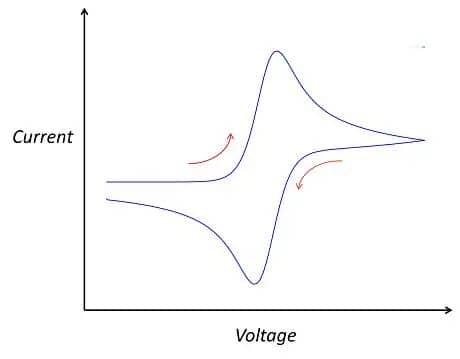
Figure 4. The standard CV curve schematic
Of course, the above curve is just a typical schematic of a cyclic voltammogram, and actual test curves may vary. They may be broader, narrower, exhibit fluctuations in certain regions, or even appear less smooth with multiple small peaks. When analyzing these details, it’s essential not to overlook them, as they may reveal certain characteristics of the material or new approaches to optimize the system. In fact, the shape of the cyclic voltammogram primarily depends on two factors: the studied system and the scan rate. The studied system refers to the intrinsic properties of the research object, such as the electrode materials of the battery, electrolyte, additives, and separators. Changing any of these factors may lead to changes in the cyclic voltammogram. Additionally, even for the same studied system, the scan rate can influence the shape of the cyclic voltammogram. This is because the scan rate in the experiment determines the rate of change of the applied potential. A faster scan rate will result in a decrease in the size of the diffusion layer, leading to higher observed currents. This is because a fast scan rate reduces the formation time of the diffusion layer, allowing more reactants to rapidly approach the electrode surface, thereby increasing the current. Consequently, the peak heights on the cyclic voltammogram will also change accordingly. In practical research, scientists often adjust the scan rate to change the magnitude of peak currents, revealing the kinetic properties of the reaction process. This helps in understanding the rate, mechanism of reactions, and the diffusion behavior of reactants.
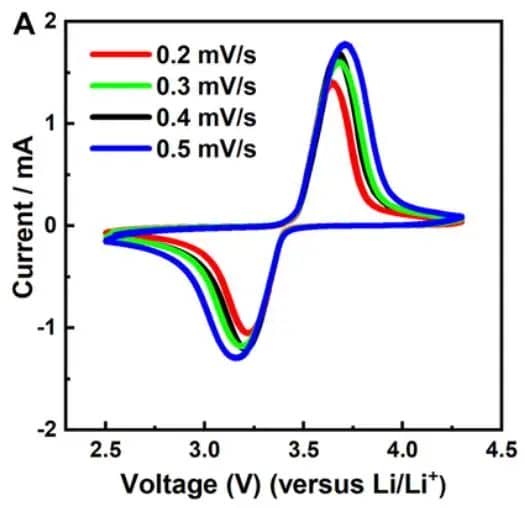
Figure 5. The cyclic voltammograms of LFP material at different scan rates.
Furthermore, another significant advantage of voltammetry lies in its provision of diverse information. It not only reveals the competitive relationship between electrolysis rate and diffusion transport rate but also provides valuable insights into the chemical reaction mechanisms and rates in the solution. By conducting voltammetry tests at different scan rates, thereby altering the rate at which voltage changes over time, we can observe different physical phenomena at various time scales.
In summary, cyclic voltammetry is a highly sensitive electrochemical testing method with a wide range of applications. In qualitative analysis, it is widely used to study redox processes, electron transfer kinetics, etc. Although there are many factors influencing the electrochemical measurement process, cyclic voltammetry is mainly used for qualitative analysis. However, quantitative analysis of the curves can still be conducted through mathematical models, such as estimating diffusion coefficients, activation energies, reaction rate constants, and even trace analysis of active substances.
Through the introduction in this article, we believe you have gained a certain understanding of cyclic voltammetry. In the upcoming articles on our electrochemistry series public account, the team at IEST will provide detailed explanations on commonly used three-electrode systems in cyclic voltammetry testing, the applications of cyclic voltammetry testing in different scenarios, as well as how to interpret and analyze cyclic voltammograms to obtain qualitative and quantitative information.
Subscribe Us
Contact Us
If you are interested in our products and want to know more details, please leave a message here, we will reply you as soon as we can.


