-
iestinstrument
In-Situ Gas Generation Analysis in Lithium Batteries During High-Temperature Storage
Abstract
We report an in-situ study of Gas Generation and open-circuit voltage (OCV) behavior for lithium-ion cells stored at 85 °C across five states of charge (SOC). Using the IEST GVM2200 gas generation volume monitor, we tracked time-resolved cell volume increase, OCV drift and capacity loss. Results show that gas production and irreversible capacity loss grow with SOC: after 7 days at 85 °C, volume increases were 20.3% (100% SOC), 10.9% (80% SOC), 5.9% (50% SOC), 3.5% (30% SOC) and 2.8% (0% SOC). These findings underscore the importance of gas analysis battery testing for transport, storage guidelines and accelerated aging models.
1. Introduction
Lithium-ion batteries are ubiquitous in portable electronics, EVs and stationary storage. Different applications impose varied high-temperature storage requirements; consumer devices in particular often must tolerate elevated storage temperatures. Prior work has explored electrochemical degradation under thermal stress, but quantitative, in-situ monitoring of volume change and gas evolution during high-temperature storage remains limited. This study uses the GVM2200 to analyse battery gases and correlate gas evolution with SOC-dependent OCV shifts and capacity fade.
2. Test Information
2.1 Test Equipment
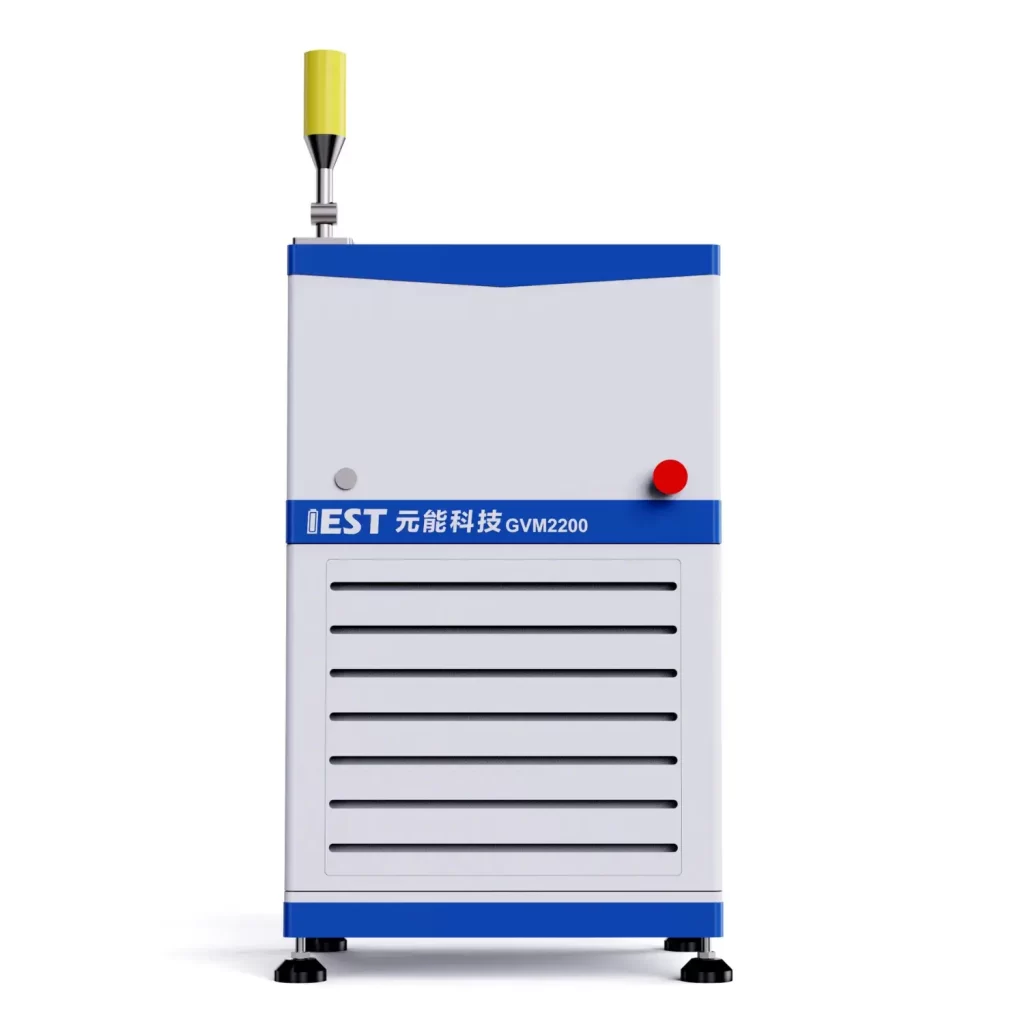
In-situ Gassing Volume Monitor GVM2200 (IEST) with a controlled oil bath (20–85 °C). See Figure 1 for instrument schematic.
Figure 1. Schematic diagram of the in-situ gassing volume monitor(GVM2200)
2.2 Test Parameters
Five parallel cell groups adjusted to SOC = 100%, 80%, 50%, 30% and 0% at room temperature (detailed cell specs in Table 1). After 15 h equilibration, cells were transferred to an 85 °C oil bath and monitored continuously.
Table 1. Battery Cell Information

2.3 Data Acquisition.
The GVM2200 recorded cell volume (gas-generated expansion), OCV and temperature versus time. Post-storage capacity and recovery were measured to quantify irreversible loss.
3. Result analysis
Select five parallel sample cells, and adjust their SOC at room temperature to 100%, 80%, 50%, 30%, and 0%. After the adjustment, the cells were left for 15 hours, and then the in-situ volume monitor (GVM2200) was started to record the voltage and volume of different SOC cells in an 85°C oil bath over time.
3.1 Voltage Changes During High Temperature Storage
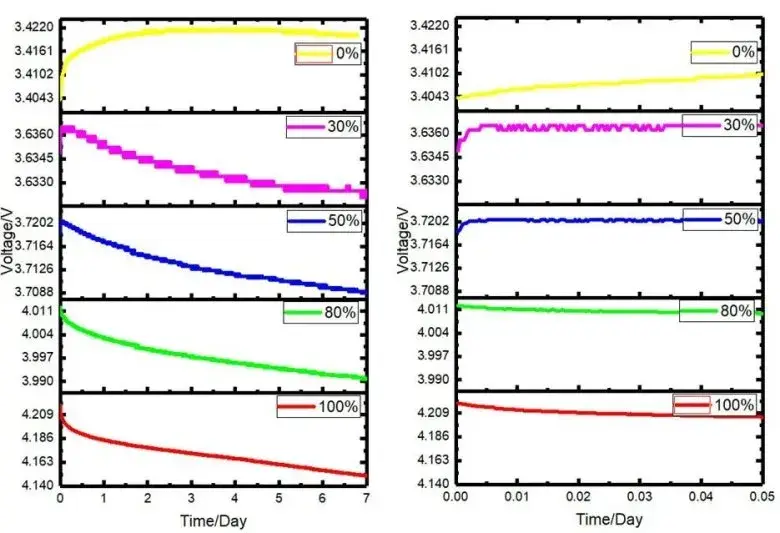
As shown in Figure 2: the graph on the left shows the change curve of the open-circuit voltage stored at 85°C for 7 days, and the graph on the right shows the change curve of the open-circuit voltage after 1 hour of testing. It can be seen that with the prolongation of storage time, the overall open circuit voltage shows a downward trend, and with the decrease of the storage SOC of the battery cell, the downward trend continues to slow down. The initial test cell was put into an 85°C oil bath environment from room temperature, there was a thermal equilibrium process, and the open circuit voltage change within the first hour was compared and analyzed (right figure): 100% and 80% SOC group cells showed a downward trend, 50% %, 30% and 0% batteries have a rising stage. This is related to the entropy heat coefficient of the battery core: from the definition of Gibbs free energy and enthalpy, and then through the corresponding mathematical operations, it can be obtained.

Among them, E represents the open circuit voltage, z represents the transfer quantity of electrons in the chemical reaction equation, which is always positive; T represents the absolute temperature, which is always positive; F is Faraday’s constant, which is always positive; ∆Q represents the heat of reaction of the battery under a specific SOC, which can be positive or negative. The battery entropy change coefficient ∂E/∂T is an important physical parameter that characterizes the thermal characteristics of the battery. It represents the change of the battery electromotive force with temperature, and can reflect the reversible heat generation of the battery during charging and discharging; When the entropy change coefficient is a negative value, the current is a negative value during the discharge process, the reversible entropy of the battery becomes a positive value, and the reversible heat of the battery is exothermic; When the entropy change coefficient is a positive value, the reversible entropy of the battery becomes negative during the discharge process, and the reversible heat of the battery is shown as heat absorption. Combining the formula ① and the initial voltage change, it can be seen that when the cell is at 100% and 80% SOC, the cell is placed in an oil bath environment of 85°C from room temperature, and the potential decreases as the temperature increases, the entropy change coefficient ∂E/∂T is negative, and the discharge process is an exothermic reaction at this time; at 0%, 30%, and 50% SOC, the potential increases with the increase of temperature, the entropy change coefficient ∂E/∂T is positive, and the discharge process is an endothermic reaction. That is to say, the thermal effect of the battery will change with the change of SOC during the charging and discharging process. When the battery is in a low state of charge (0%-50%SOC), the lithium ions inside the battery are embedded in the positive electrode material and enriched around the positive electrode. When the temperature rises, the lithium ions inside the positive electrode material will be released from the positive electrode material under the action of heat, resulting in an increase in the battery potential, the battery voltage continues to increase, and the entropy heat coefficient becomes a positive value. When the battery is at a higher state of charge (80%-100% SOC), a large number of lithium ions are intercalated into the negative electrode material and enriched around the negative electrode, when the temperature of the battery rises, a part of lithium ions are released from the graphite negative electrode under the action of heat, and the potential of the negative electrode increases, so that the voltage of the battery as a whole decreases continuously, and the entropy change coefficient shows a negative value. During the whole process, the side reactions of the electrolyte also affect the thermal characteristics of the battery.

Figure 2. Curve of open circuit voltage versus storage time
3.2 Volume Change
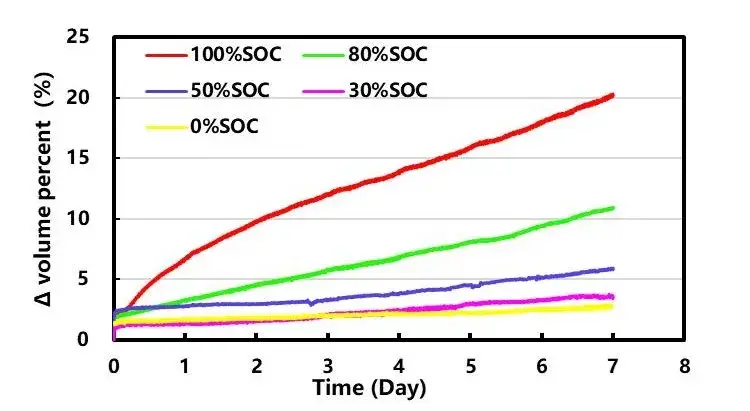
Figure 3 plots cumulative volume increase (proxy for gas generation). After 7 days at 85 °C the measured volume increases were:
-
100% SOC: 20.3%
-
80% SOC: 10.9%
-
50% SOC: 5.9%
-
30% SOC: 3.5%
-
0% SOC: 2.8%
Gas production scales with SOC: high-SOC cells are more prone to oxidative side reactions at high-potential cathodes, producing larger gas volumes and more diverse gas species. At lower SOC, gas production shifts toward negative-electrode processes but remains substantially lower overall.

Figure 3. Gas generation versus time curve
3.3 Capacity Changes
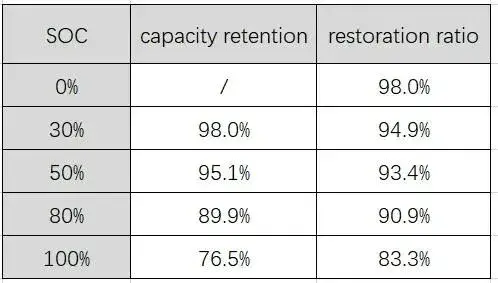
The capacity difference of each battery cell before and after storage is monitored separately as shown in the following table: the capacity retention rate decreases continuously with the increase of the storage SOC, and the capacity recovery rate also decreases continuously. The former is mainly due to the increase in SOC, which causes the cathode potential to increase and the oxidation to increase, while the anode potential decreases to increase the reductivity, both of which lead to an increase in the self-discharge rate of the battery, resulting in a continuous decline in capacity. The irreversible capacity loss may be due to some side reactions during high temperature storage. For example, these side reactions of the anode reducing the electrolyte will consume a part of the active lithium, and a large amount of products will be deposited on the anode. The inorganic components in the deposit hinder the diffusion of lithium ions, making the anode Reaction kinetic performance decreased [2] [3].
Table 2. List of capacity retention and recovery rates

4. Discussion — implications of gas generation for storage and safety
-
Transport & storage: Elevated SOC dramatically increases gas generation at high temperature, raising swelling and pressure risks in pouch cells. For shipping and long-term storage, lowering SOC substantially reduces gas-related hazards.
-
Safety monitoring: In-situ gas analysis battery testing (volume monitoring and, where possible, gas species analysis) provides early warning for cells prone to rapid off-gassing under thermal stress.
-
Accelerated aging: Time-resolved gas metrics improve parametrization of accelerated aging models by capturing SOC-dependent side-reaction kinetics.
-
Mitigation strategies: Use lower storage SOC, optimized electrolyte additives (to form stable SEI and suppress gas-forming reactions), and consider internal cell venting or stronger pouch constraints for high-temperature applications.
5. Summary
Using the GVM2200, we demonstrated a strong SOC dependence of Gas Generation and OCV drift during 85 °C storage. High SOC leads to substantially more gas evolution and greater irreversible capacity loss. These results recommend conservative SOC control for storage/transport and highlight the value of in-situ gas monitoring to analyse battery gases and inform safety protocols and aging models.
6. References
[1] Wang Nianju, Meng Fanhui, Yu Liwei, Zhou Jiang, Gao Jinhui, Effect of Voltage on Gas Production of Lithium-ion Batteries in High Temperature Storage[J], Power Technology, 2020. DOI: 10.3969/j.issn.1002-087X.2020.07.007.
[2] Yao Bin, Teng Guopeng, Liu Xiaomei, Chen Weifeng, Cai Yi. Mechanism of Lithium Iron Phosphate Battery High Temperature Storage Performance Attenuation[J]. Power Technology, 2018, (No. 7).
[3] Wei Zhiguo, Cheng Cheng, Yao Wangbing, etc., Effect of battery voltage on high temperature storage performance of lithium-ion batteries[J], Power Supply Technology, 2021. DOI: 10.3969/j.issn.1002-087X.2021.03.006.
Contact Us
If you are interested in our products and want to know more details, please leave a message here, we will reply you as soon as we can.


