-
iestinstrument
In-situ Analysis of The Volume And Thickness Swelling Behavior Of Pouch Cell-LFP/graphite System Cell
Abstract
This study uses synchronized in-situ measurement to quantify Thickness Swelling and volume swelling of LiFePO₄ (LFP)/graphite pouch cells during charge–discharge. Because LFP (olivine) shows minimal structural expansion, the cell mechanical response is dominated by graphite staging (Li–graphite phase transitions). Using the IEST GVM2200 for gas/volume monitoring and the SWE2110 swelling analyzer for high-precision thickness and force logging, we map dQ/dV peaks to discrete swelling events and distinguish reversible from irreversible expansion. The results show that graphite stage transitions (e.g., LiC₂₄ → LiC₁₂ → LiC₆) produce measurable thickness swelling and volume steps and that thickness measurements are most sensitive to structural expansion while volume monitoring also captures gas-forming side reactions.
1. Introduction
When the cell undergoes de-embedded lithium phase transition during the charging and discharging process, it will cause thickness swelling and volume swelling. Since the LFP material is an olivine structure, there is only one very stable platform during the charge and discharge process, and the structural expansion is small. Therefore, the structural expansion of LFP/graphite battery cells are mainly related to the lithium deintercalation platform of the graphite anode. The conversion of different order structures of graphite is shown in Figure 11-2. Comparing the thickness swelling and volume swelling corresponding to each order can guide R&D personnel to further understand the expansion mechanism.
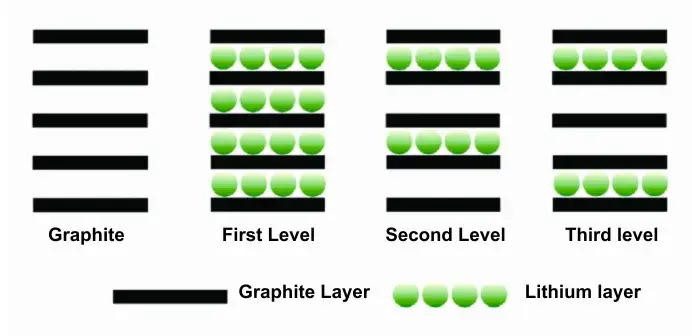
Figure 1. Schematic diagram of graphite stage structure1
2. Experimental Methods
2.1 Experimental Equipment
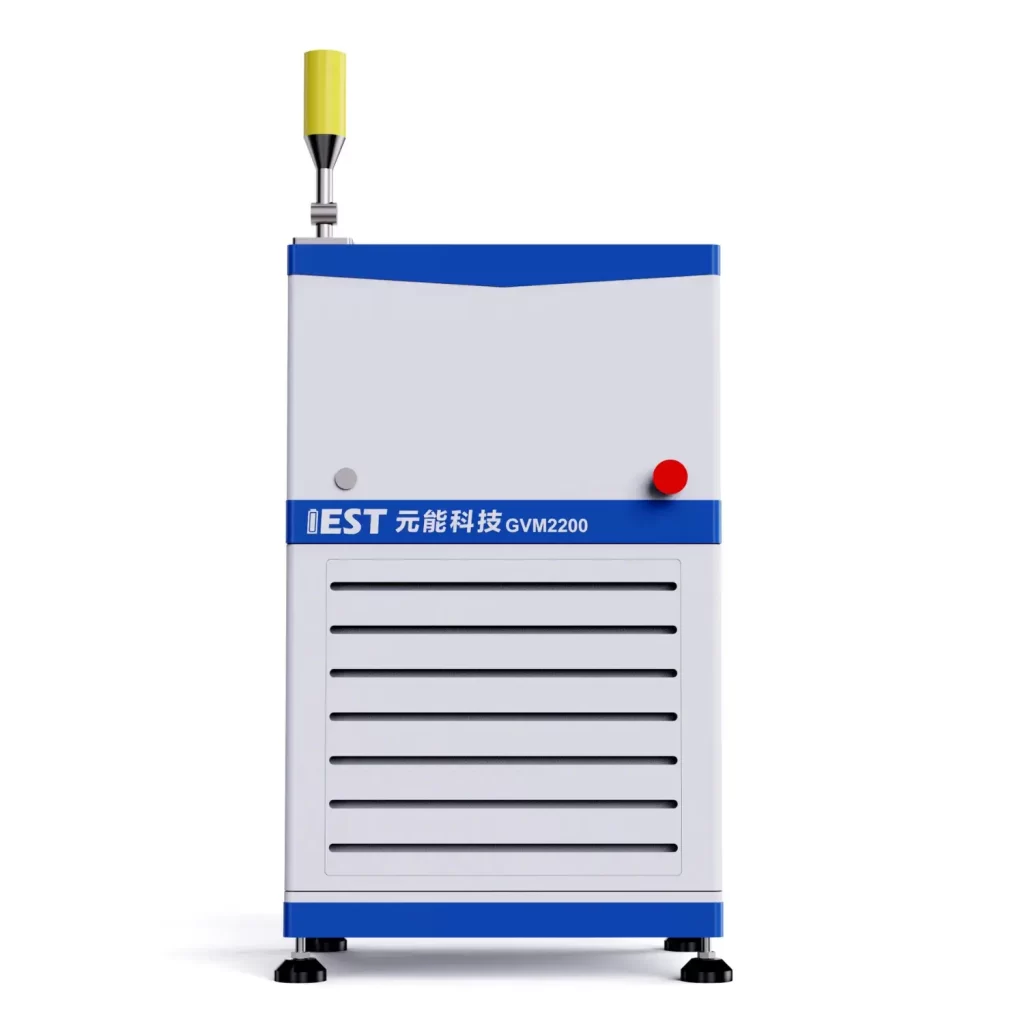
- Model GVM2200(IEST) ,The testable temperature range is 20℃~85℃, and it supports dual-channel (2 batteries) simultaneous testing. The appearance of the device is shown in Figure 2.
Figure 2. Appearance of GVM2200 Equipment
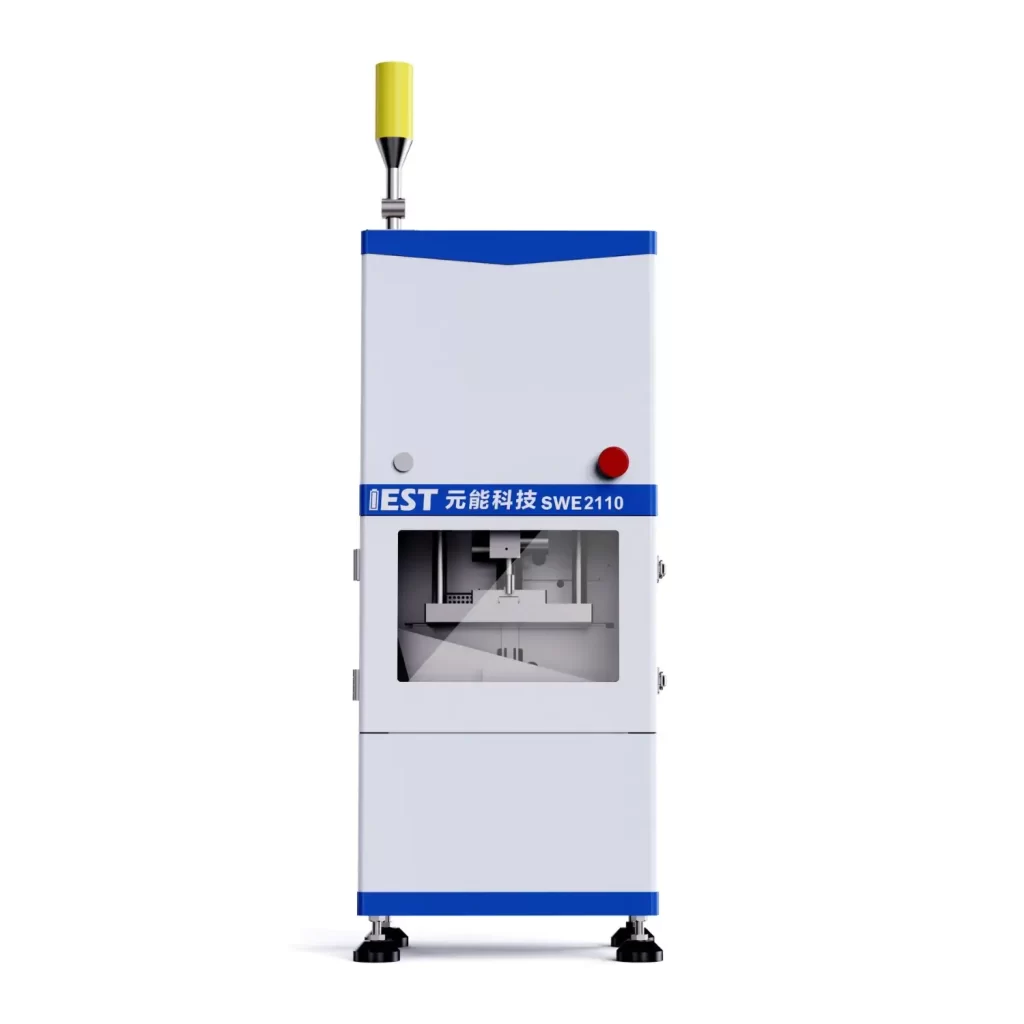
- Model SWE2110(IEST), the appearance of the equipment is shown in Figure 3. Active thickness and force control and logging; supports constant-gap and constant-pressure modes for precise mechanical boundary conditions.
Figure 3. Appearance of SWE2110 Equipment
2.2 Cell Information
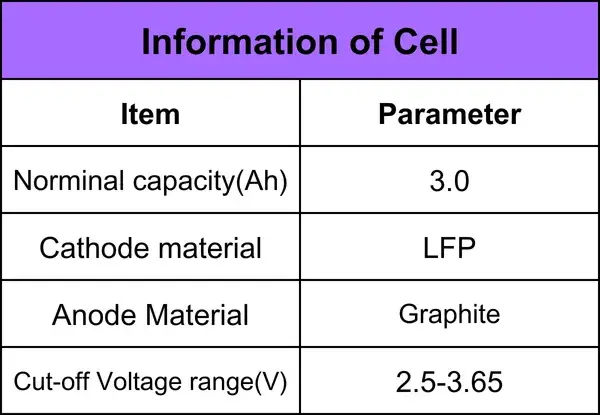
Pouch cells with LFP cathodes and graphite anodes were used. See Table 1 for detailed specifications.
Table 1. Test cells information
2.3 Test cells and protocol
Test cells and key parameters are listed in Table 1. Charge/discharge protocol: 25 °C rest 5 min → 0.5C CC to 3.65 V, CV to 0.025C → rest 5 min → 0.5C discharge to 2.5 V. Sampling frequencies were set to capture electrochemical and mechanical transients (recommend ≥1 Hz; increase to 5–10 Hz for higher temporal resolution).
2.4 Cell Volume Swelling Test
Initial weighing of the cell m0, put the cell to be tested into the corresponding channel of the equipment, open the MISG software, set the corresponding cell number and sampling frequency parameters of each channel, and the software automatically reads the volume change amount, test temperature, current, voltage, capacity and other data.
2.5 Thickness swelling test of cell
put the cell to be tested into the corresponding channel of the equipment, open MISS software, set the corresponding electric cell number and sampling frequency parameter of each channel, and the software will automatically read the thickness of the cell, the thickness change amount, the test temperature, current, voltage, capacity and other data.
3. In-Situ Analysis of Expansion Behavior
3.1 Coupled thickness and volume response during cycling
Figure 4(a–b) show charge–discharge voltage together with volume and thickness traces. At full charge the cell exhibits ≈1% increase in both thickness and volume. During the LFP plateau the mechanical response is near-flat (consistent with minimal LFP lattice change). Thickness and volume return close to baseline after one cycle, indicating largely reversible mechanical behavior under the tested conditions.
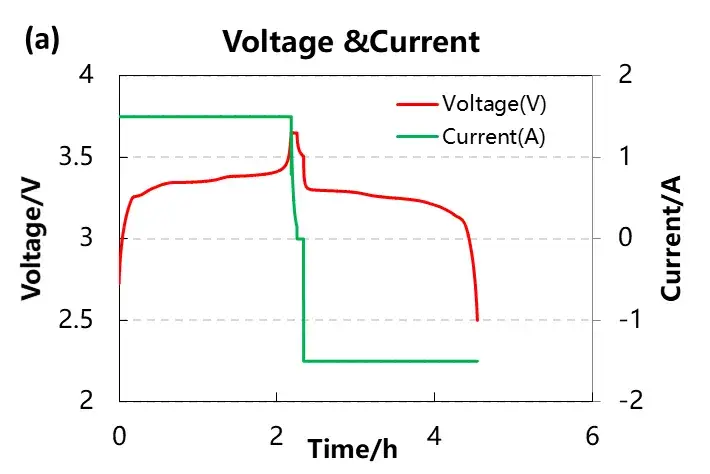
Figure 4. (a) Voltage and volume changes during charging and discharging.
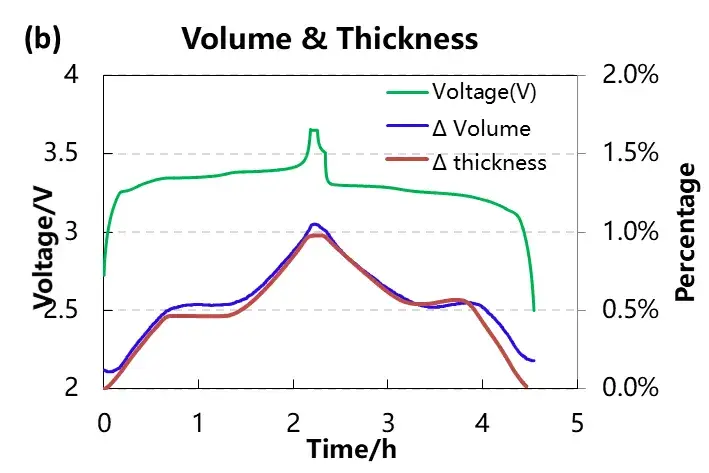
Figure 4. (b) Thickness swelling and volume swelling changes during charging and discharging.
3.2 Correlation with graphite staging (dQ/dV analysis)
Figure 5 shows the volume swelling and thickness swelling of the cell and the differential capacity curve. Each peak of the differential capacity curve corresponds to the phase change of lithium insertion and extraction. Since the LFP material has only one voltage platform during the entire lithium insertion and extraction process, the three peaks seen on the differential capacity curve of the battery cell are all lithium insertion and extraction peaks of three different orders of graphite. It can be seen from the figure that when charging, at the first lithium insertion peak LiC24 phase change and the third LiC6 of graphite, the corresponding slope of the volume and thickness curve is larger, indicating that the phase change at this time causes a larger swelling of the graphite structure.
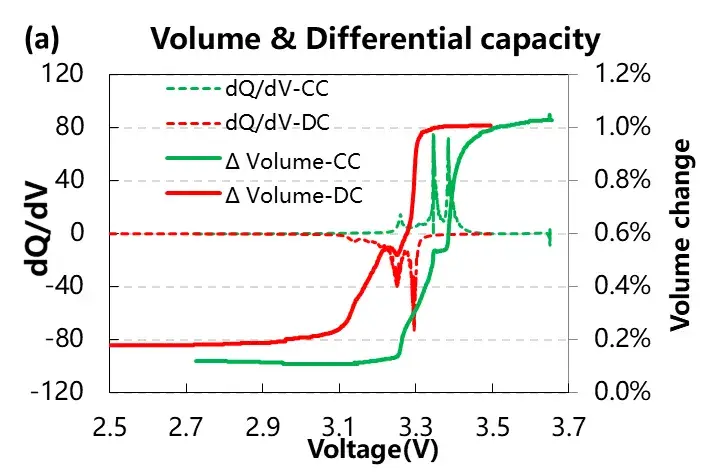
Figure 5. (a) Swelling volume and differential capacity curve.
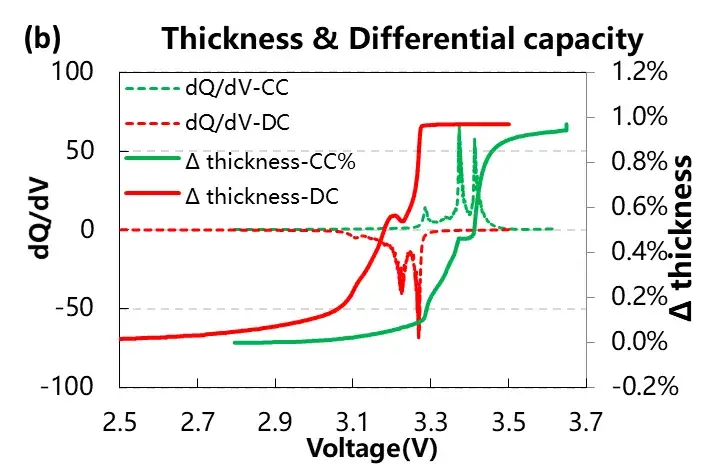
Figure 5. (b) Swelling thickness and differential capacity curve.
3.3 Reversible vs irreversible swelling across SOC ranges
Figure 6 compares volume and thickness under different SOC windows for charge vs discharge. The separation (hysteresis) between charge and discharge traces indicates irreversible swelling. Observations:
-
Thickness swelling shows larger charge–discharge hysteresis at low SOC ranges (suggesting permanently altered electrode microstructure).
-
Volume swelling generally mirrors thickness behavior in low-SOC intervals; at high SOC small gas evolution may bias volume readings due to buoyancy effects in the GVM—hence volume monitoring is sensitive to gas-forming side reactions in addition to pure structural swelling.
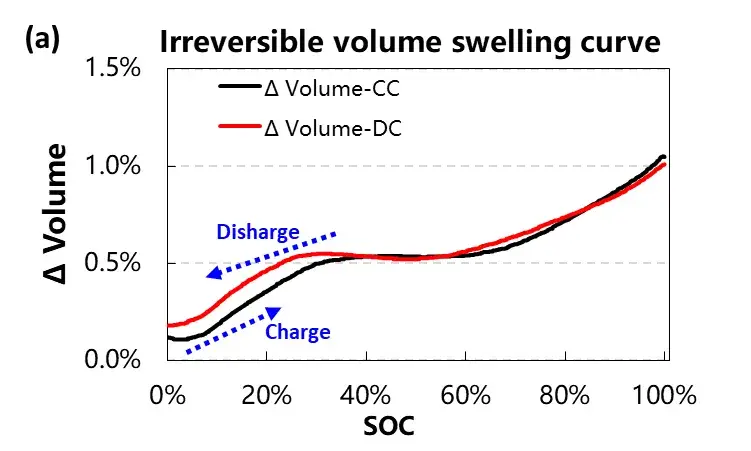
Figure 6. (a) Volume swelling curve under different SOC conditions.
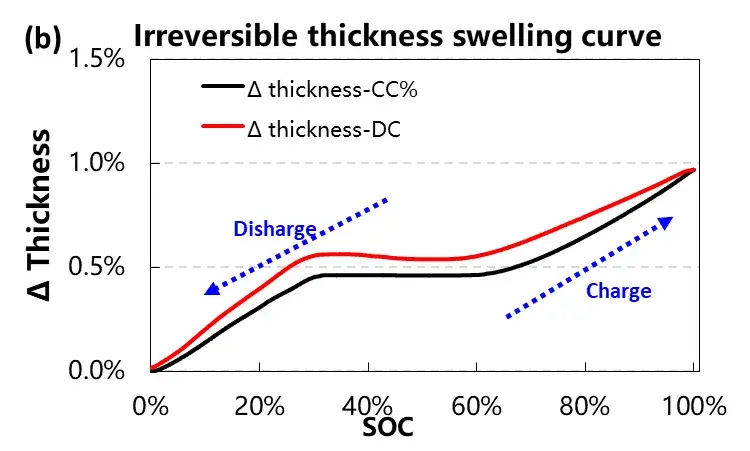
Figure 6. (b) Thickness swelling curve under different SOC conditions.
4. Discussion — Measurement Priorities & Practical Advice
When to prioritize thickness vs. volume:
-
Thickness swelling is the preferred metric for isolating structural expansion caused by crystallographic phase changes (graphite staging). It is insensitive to small gas artifacts and directly relevant to mechanical stack design and layer delamination risk.
-
Volume swelling (GVM) is advantageous when the goal is to detect gas-forming side reactions (electrolyte decomposition, SEI outgassing). Use GVM together with gas-species analysis (GC/MS) where possible.
Best practices for robust thickness swelling characterization
-
Use constant-gap SWE mode to simulate fixed pack constraints and obtain repeatable thickness traces. Constant-pressure mode is ideal to measure force under specified preload.
-
Synchronize electrochemical and mechanical data (timestamps and sampling frequency) so dQ/dV peaks align precisely with thickness changes.
-
Sampling: ≥1–5 Hz for most staging events; increase if you expect rapid transients.
-
Calibration: zero displacement and calibrate load cells before each test; validate GVM buoyancy baseline.
-
Replicates: test multiple cells and perform ≥3 cycles to separate reversible from irreversible effects.
-
Control environment: maintain stable temperature; thickness and staging thermodynamics are temperature dependent.
Interpretation tip: If volume and thickness diverge at high SOC, suspect gas evolution—confirm with a targeted gas analysis or repeat test under vacuum/alternative instrumentation.
5. Summary
Synchronized in-situ thickness and volume monitoring reveals that graphite staging governs mechanical swelling in LFP/graphite pouch cells. Thickness swelling measurements provide the most direct insight into structural expansion and are the preferred diagnostic for R&D focused on mechanical integrity and pack design. Volume monitoring complements thickness data by highlighting gas-forming reactions relevant to safety and aging.
6. Reference
[1] Nalamova V,Guerard D,Lelaurain M,et al. X-ray investigation of highly saturated Li-graphite intercalation compound[J]. Carbon ,1995,33(2):177-181.
Contact Us
If you are interested in our products and want to know more details, please leave a message here, we will reply you as soon as we can.


