-
iestinstrument
In-situ Testing of The Volume, Stress, and Thickness Changes of Different Silicon Anodes in Pouch Cells
![]()
1. Article Abstract
Silicon-based electrodes are promising for high-capacity lithium-ion batteries but are challenged by large mechanical changes during cycling. This study—building on the J. R. Dahn group’s 2017 work—uses comprehensive in-situ characterization (volume, stress, thickness, and XRD) combined with quantitative analysis to separate and quantify each component’s contribution to overall cell expansion. The results clarify the mechanisms behind silicon anode volume expansion, show how cathode contraction can mask anode swelling, and demonstrate the value of precise anode thickness measurement for predicting mechanical degradation and long-term performance.
2. Introduction
Silicon anodes offer a substantially higher specific capacity than graphite, but their practical use is limited by dramatic volume changes during lithiation/delithiation. Understanding and quantifying these changes at the electrode and cell level is essential for designing durable silicon anodes and reliable battery packs. Here we synthesize experimental in-situ measurements and component-level analysis to quantify how silicon, graphite and cathode materials each contribute to the net pouch-cell expansion and mechanical stress. Throughout this article we highlight techniques for accurate anode thickness measurement and tracking silicon anode volume expansion in operating cells.
3. Experimental Procedure
3.1 Fabrication of Three Types of Pouch Cells:
-
Cell A — Li(Ni₁₋ₓ₋ᵧCoₓAlᵧ)O₂ (NCA)/SiO-graphite (Supplier A). Fully charged to 4.20 V, nominal capacity 260 mAh.
-
Cell B — LiCoO₂ (LCO)/Si Alloy-graphite (Supplier B). Fully charged to 4.35 V, nominal capacity 230 mAh.
-
Cell C — Li(Ni₁₋ₓ₋ᵧCoₓAlᵧ)O₂ (NCA)/nano Si-C (Supplier C). Fully charged to 4.40 V, nominal capacity 165 mAh.
These combinations provide a range of silicon morphologies and cathode chemistries to compare expansion behavior and cycling stability.
3.2 Testing Equipment and Procedures:
All tests combined electrochemical cycling with simultaneous in-situ characterization:
-
In-situ X-ray diffraction (XRD) to determine phase changes and volume trends of cathode active material.
-
In-situ total cell volume measurement (high-resolution gas/volume analyzer) to capture net swelling in µL resolution.
-
In-situ force/stress measurement to record expansion force under controlled constraints.
-
In-situ thickness sensors to monitor electrode stack and anode surface displacement over cycling, enabling precise anode thickness measurement.
Schematic setups for stress and thickness measurement are shown in Figure 1. (See the original study for full experimental drawings and calibration details.)
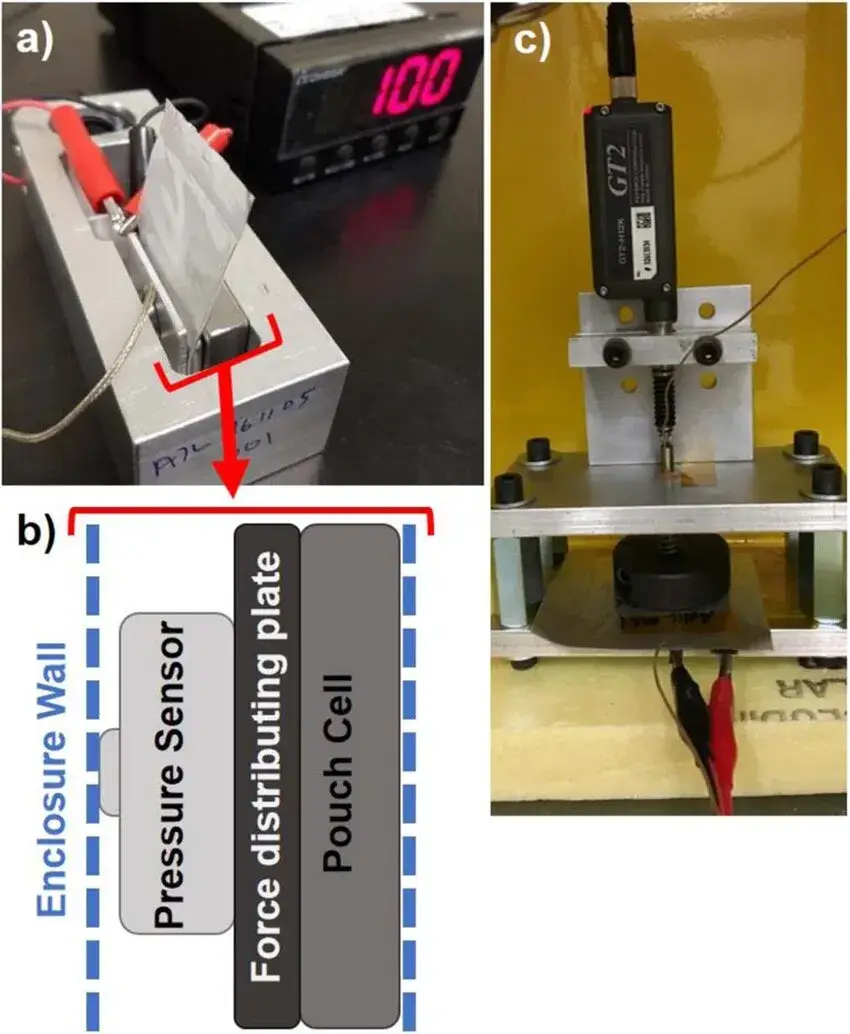
Figure 1. Stress and thickness expansion testing apparatus.
3. Results and Analysis
3.1 Net cell expansion, stress and thickness trends
Figure 2 summarizes the measured volume, stress and thickness profiles for Cells A–C during charge/discharge cycles:
-
Cells A and B: similar magnitudes of net volume increase and stress; both are significantly larger than Cell C.
-
Cell C (nano Si-C): consistently lower expansion and stress, suggesting improved buffering by the carbon matrix.
-
Voltage-range behavior: Cells A and C show plateau regions in expansion at high voltages, whereas Cell B exhibits sharper expansion/contraction in the same SOC window.
Because these measurements reflect contributions from both electrodes, further decomposition is necessary to isolate the silicon anode volume expansion.
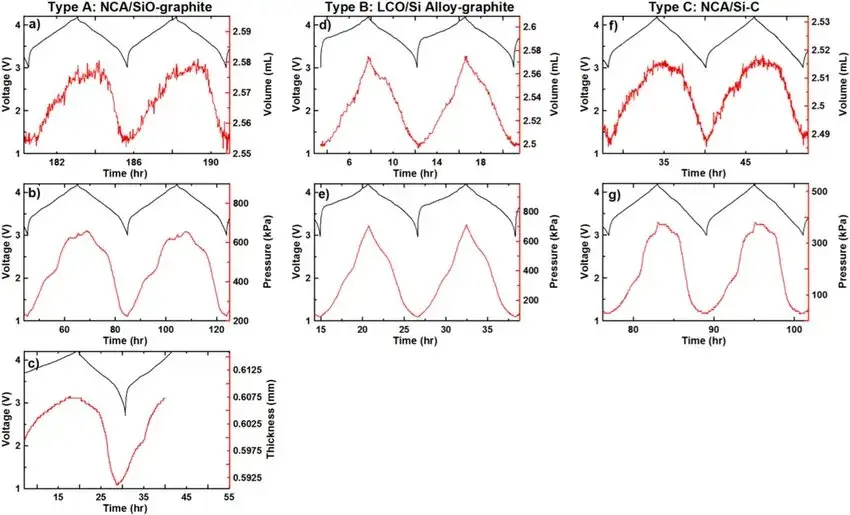
Figure 2. Volume, stress, and thickness expansion curves of the three cell types during charge/discharge.
3.2 Component decomposition using literature and in-situ XRD
Figure 3 compiles literature expansion ratios for pure Si and graphite and couples them with the in-situ XRD–derived volume change for the cathode material (NCA) measured here:
-
Silicon: ~280% volume expansion during full lithiation; the expansion scales approximately linearly with SOC.
-
Graphite: ~10% overall expansion; expansion shows step changes associated with the 2L→stage 2 phase transition but limited net volume growth.
-
NCA: exhibits ~4.5% contraction during charge (most contraction at high SOC), a trend that can partially offset anode swelling at certain voltages.
Using dV/dQ fitting of the composite electrode response (Figure 4), we resolved the relative contributions of Si and graphite in composite electrodes and reconstructed the expected anode-only expansion curve.
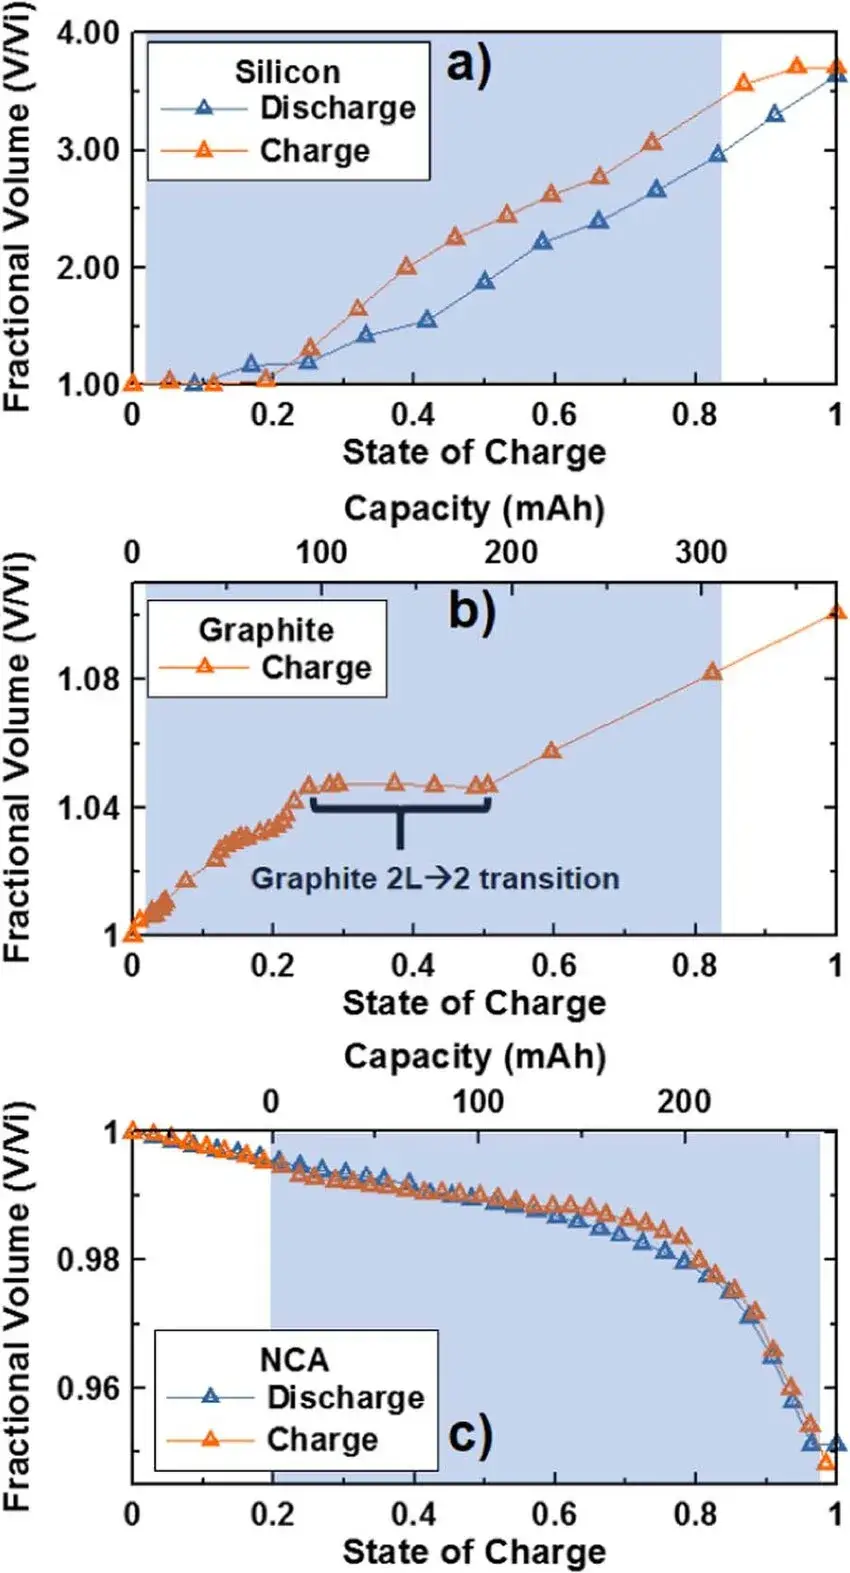
Figure 3. Volume Change Ratio Curves of Three Pure Electrode Materials during Charge/Discharge
Figure 4. By fitting the dV/dQ curves, the influence of each component on the overall voltage–capacity curve for the Si and graphite composite is obtained.
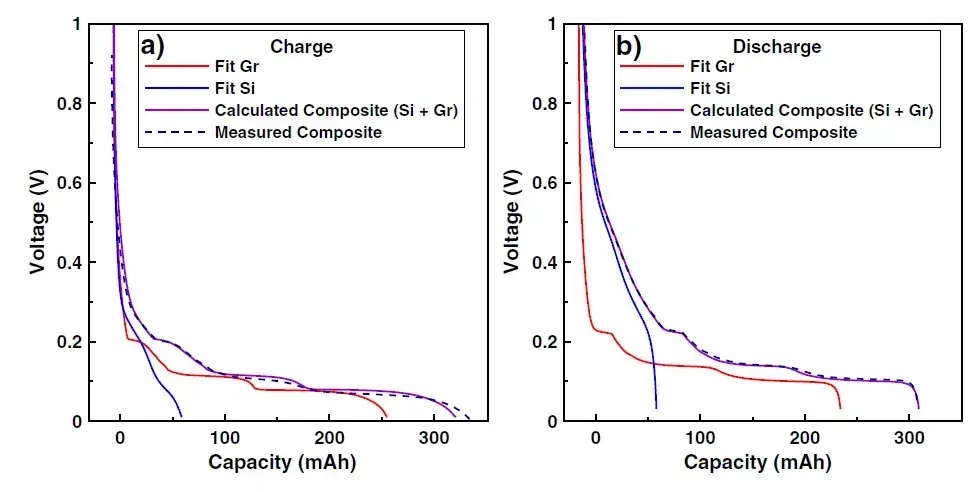
Figure 4. Voltage-capacity curve fitting for Si and graphite composites
3.3 How cathode behavior masks anode swelling
Decomposition of the full-cell expansion (Figure 5) shows that in Cell A (NCA / SiO-graphite) the cathode contraction at high SOC creates a net plateau in the overall volume curve: NCA contraction partially cancels SiO expansion. In contrast, Cell B (LCO / Si-alloy-graphite)—which does not exhibit the same cathode contraction profile—shows steeper net expansion, increasing mechanical stress and irreversible deformation.
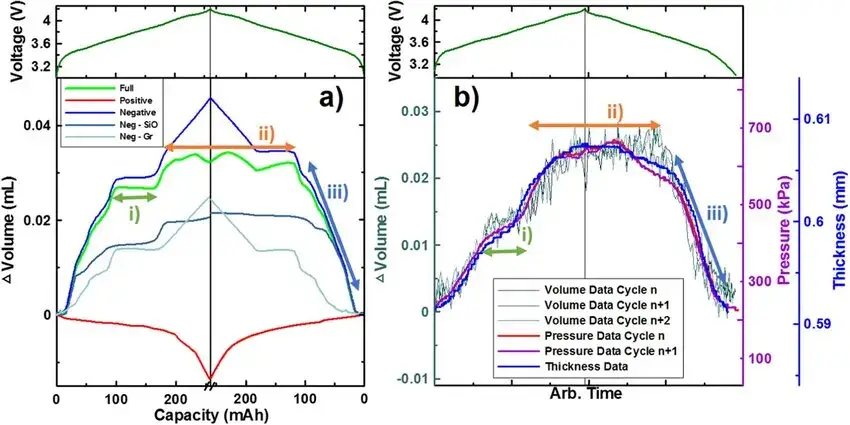
Figure 5. Decomposed Component Volume Expansion Curves for the Full Cell of the SiO/Graphite Composite Electrode and NCA Electrode
3.4 Long-term cycling: force and capacity decay
Figure 6 reports long cycle tests comparing Cells B and C:
-
LCO / Si-alloy-carbon (Cell B): higher irreversible expansion forces and accelerated capacity fade.
-
NCA / nano Si-C (Cell C): lower irreversible forces and slower capacity decay, demonstrating the benefit of carbon-buffered silicon and optimized electrode architecture.
These findings reinforce that controlling silicon anode volume expansion — both by material design and through accurate anode thickness measurement during development — correlates strongly with improved cycle life.
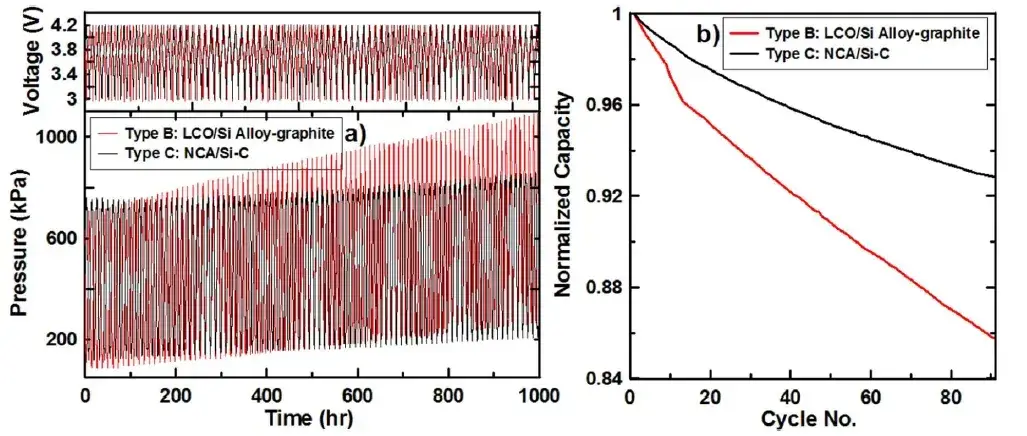
Figure 6. Long Cycle-Life Expansion Force and Capacity Change Curves for Pouch Cells B and C
4. Discussion — Practical implications for silicon anode design
- Material selection and composite design matter. Nano-Si embedded in carbon matrices reduces net expansion and mechanical stress compared with bulk SiO or Si-alloy particles.
- Cathode behavior must be considered. Cathode contraction (e.g., NCA) can temporarily mask anode swelling; designing electrodes without accounting for this masking effect risks underestimating anode mechanical demands.
- Precision anode thickness measurement is essential. High-resolution thickness sensors enable identification of small, irreversible thickness changes that predict long-term mechanical failure modes (delamination, current-collector buckling). Integrating anode thickness measurement into qualification testing accelerates early detection of problematic formulations.
- Testing under realistic constraints. Measuring expansion force and thickness under both constant-gap and constant-pressure conditions yields complementary insights: force data show mechanical loading on pack components, while thickness data report dimensional changes relevant to cell stacking and tab integrity.
5. Conclusion and Tips
This combined in-situ experimental and quantitative analysis demonstrates that:
-
Silicon in composite anodes accounts for the majority of electrode swelling (~280% intrinsic expansion for pure Si), while graphite contributes modestly (~10%).
-
Cathode volume changes (e.g., NCA contraction) can offset anode expansion at specific SOCs, producing misleading plateau behavior in net cell expansion.
-
Accurate anode thickness measurement and force monitoring are critical diagnostic tools for assessing mechanical reliability of silicon anodes and forecasting capacity fade.
-
Optimized silicon architectures (nano-Si in carbon matrices) and careful electrode balancing lead to lower irreversible forces and better cycle stability.
Practical next steps for developers and QC teams: incorporate synchronized in-situ volume, force and thickness testing during formulation screening; prioritize composite designs that minimize incremental thickness change per unit capacity; and validate that cathode selection and operating voltage windows do not inadvertently increase mechanical stress on the anode.
6. Original Article
A. J. Louli, Jing Li, S. Trussler, Christopher R. Fell, and J. R. Dahn. Volume, Pressure and Thickness Evolution of Li-Ion Pouch Cells with Silicon-Composite Negative Electrodes. Journal of The Electrochemical Society, 164 (12) A2689-A2696 (2017).
7. IEST Recommended Testing Equipment
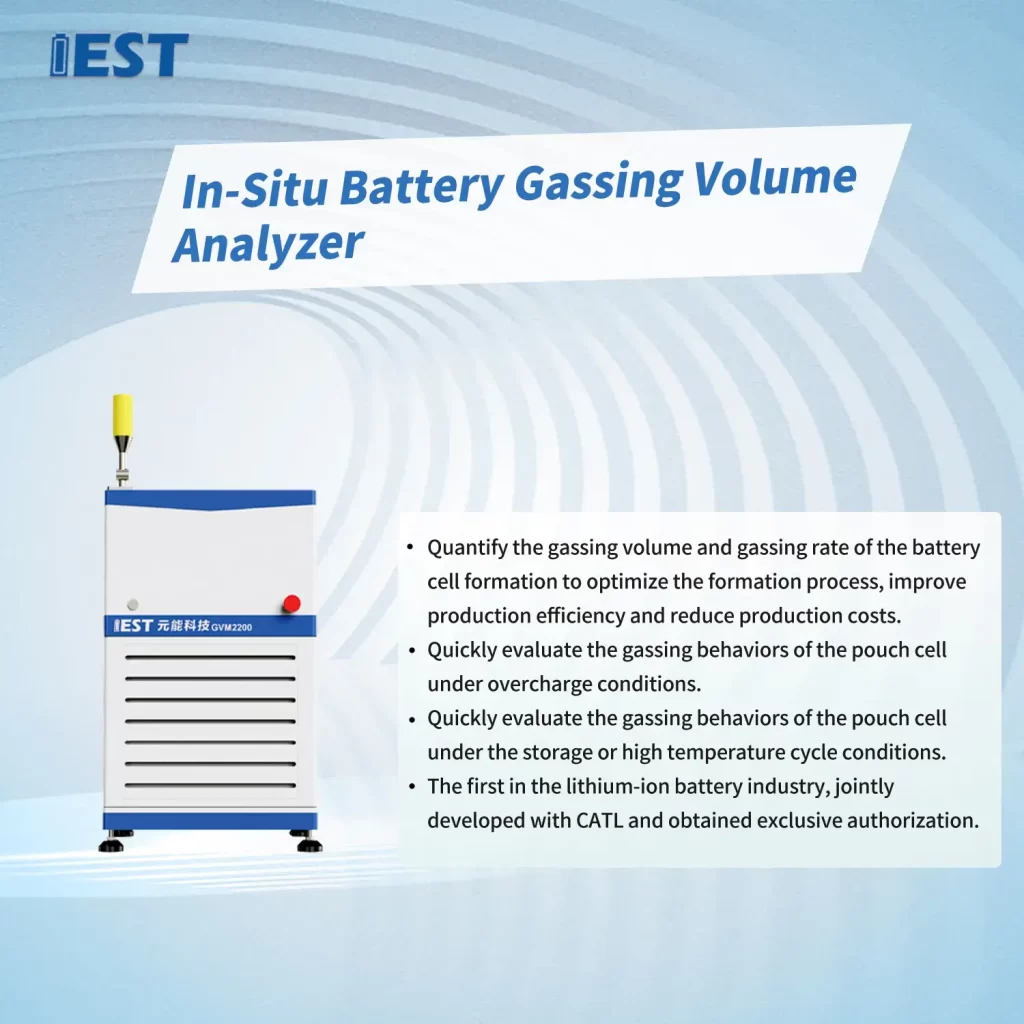
7.1 IEST In-Situ Battery Gassing Volume Analyzer(Model GVM2200). Key features include:
- Integrated Force and Electrical Testing System: Capable of long-term in situ online monitoring with high resolution (1 μL).
- Temperature-Controlled Environment: Operates over a temperature range of 20–85°C.
- Dedicated Testing Software: Real-time data acquisition and display for the mechanical testing system, with automatic plotting of volume change curves alongside electrochemical performance curves.
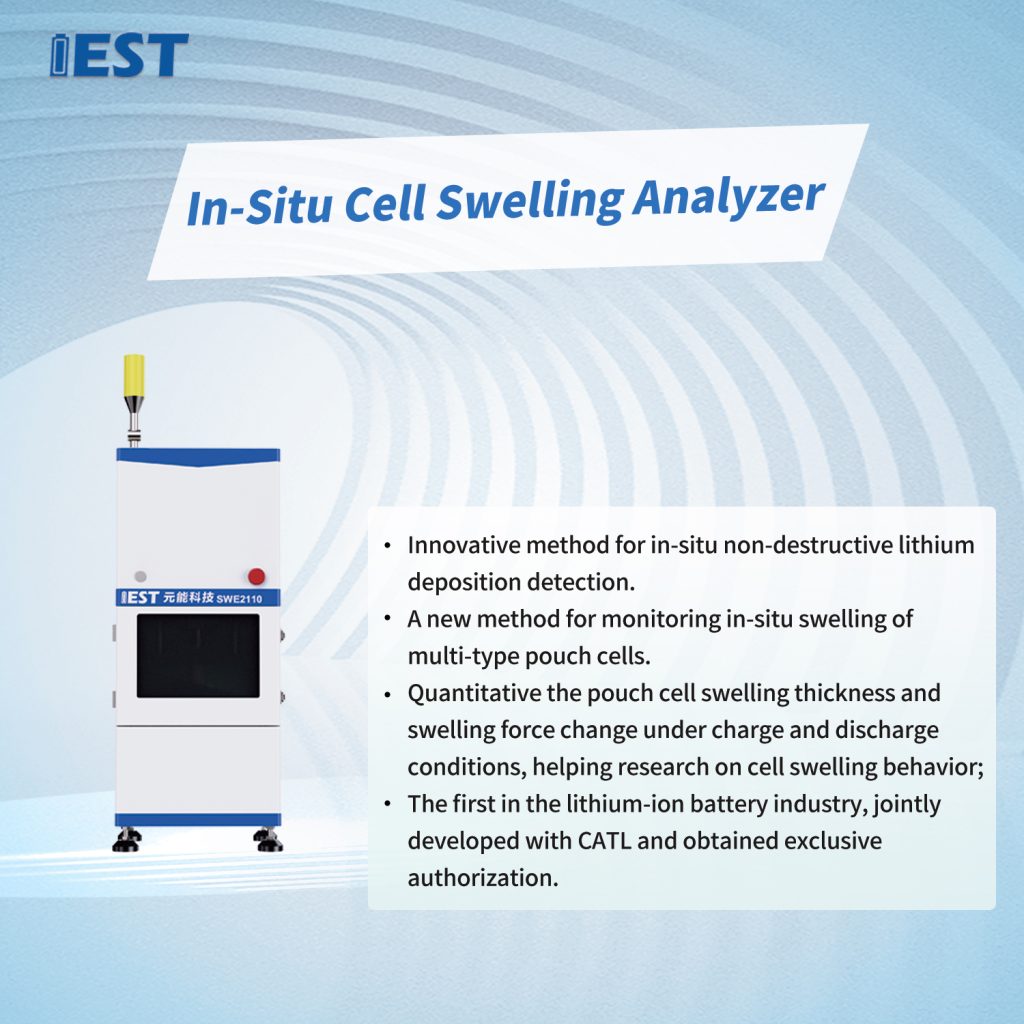
7.2 IEST In-Situ Cell Swelling Testing System(SWE Series)
Utilizing a highly stable and reliable automated platform integrated with a high-precision thickness sensor, this system measures the total thickness changes and rate of change during the entire charge/discharge cycle of the battery. Its capabilities include:
- Measuring the battery’s expansion thickness curve under constant pressure conditions.
- Measuring the battery’s expansion force curve under constant gap conditions.
- Testing the battery’s compression performance: stress–strain curves and compression modulus.
- Stepwise testing of battery expansion force.
- Temperature control over a range of −20 to 80°C.
Subscribe Us
Contact Us
If you are interested in our products and want to know more details, please leave a message here, we will reply you as soon as we can.


