


📄 Source Paper
Journal: Journal of Energy Chemistry, 2022. | DOI: 10.1016/j.jechem.2022.05.036
Metallic lithium anodes offer theoretical specific capacity of 3,860 mAh g⁻¹ — approximately ten times that of commercial graphite. Solid-state lithium batteries (SSLBs) using LLZO as the solid electrolyte are considered strong candidates to replace liquid electrolyte lithium-ion batteries due to their non-flammable electrolyte, compatibility with lithium metal, and potential for higher volumetric energy density. Among oxide solid electrolytes, garnet-type LLZO distinguishes itself through room-temperature ionic conductivity and chemical stability that other oxide families (LIPON, NASICON-type) often do not simultaneously achieve.
Conventional LLZO synthesis uses isopropanol (IPA) as a wet milling solvent. While IPA improves particle size reduction and mixing uniformity, it creates a fundamental moisture-protonation problem: IPA absorbs atmospheric moisture during processing, and water molecules drive H⁺/Li⁺ exchange in LLZO. The consequences are severe — proton-contaminated LLZO powder shows expanded lattice parameters (detectable by XRD), reduced cubic phase content, and lithium-enriched contamination zones visible by SEM-EDS in green pellet cross-sections.
The solvent-free dry route — using hydrophobic binders (PTFE and PU) instead of IPA — fundamentally eliminates the moisture pathway to protonation, at the cost of larger particle sizes, lower mixing uniformity, and the need for longer or higher-temperature sintering. Understanding the exact trade-offs between wet and dry routes across electrical, structural, and electrochemical dimensions requires systematic multi-method characterization — which this study provides for Ta-doped LLZO (Li₆.₅La₃Zr₁.₅Ta₀.₅O₁₂).
Four processing pathways were evaluated using LiOH·H₂O, La₂O₃, Ta₂O₅, and ZrO₂ as precursors, with PTFE and PU as dry binders:
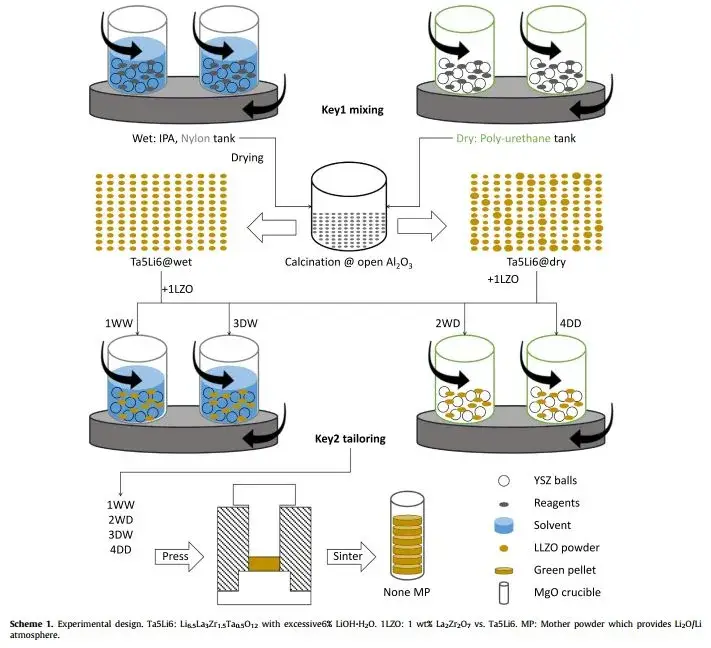
Figure 1. Orthogonal experimental design for LLZO solid electrolyte preparation — four routes from fully wet (1WW) to fully dry (4DD)
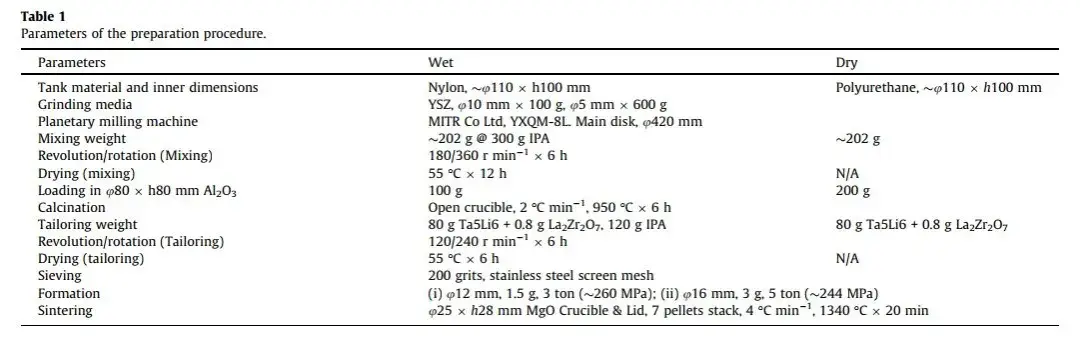
Table 1. LLZO preparation process parameters for four wet/dry route combinations
For testing, a laser particle size analyzer was used for powder particle size testing, SEM & EDS for morphological characterization, and the Toyo-developed LN-Z2-HF ultra-high-frequency impedance testing system was used to measure the material’s ionic conductivity at different temperatures. Lithium-lithium symmetric cell tests for critical current density and long-term stability were also performed.
SEM and particle size analysis reveal fundamentally different powder morphologies from wet and dry routes. Wet-prepared (IPA) LLZO slurry develops a viscous, cheese-like consistency that creates significant processing difficulties, though the resulting sintered particles are smaller and more uniform with lower tap density. Dry-mixed LLZO powders show larger, flake-like structures with less uniform mixing, but after sintering achieve a tap density approximately twice that of wet-processed powder — a critical advantage for green pellet packing and final ceramic density.
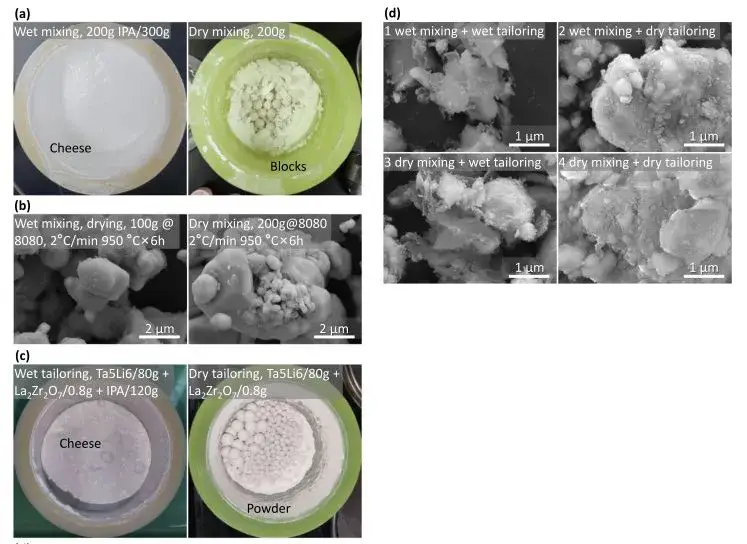
Figure 2. SEM morphology and processing characteristics of LLZO powders: wet (IPA) route produces viscous slurry with small uniform particles; dry (PTFE/PU) route produces flake-like structures with 2× higher tap density
The slurry after wet preparation using IPA as the solvent exhibited a viscous, cheese-like consistency, leading to significant processing difficulties. However, the sintered particles were smaller, with good uniformity, though the tap density was lower. In contrast, dry-mixed powders showed larger, flake-like structures with poorer mixing uniformity. After sintering, the powder particle size was larger, and the tap density was twice that of the wet method. Particle size test results (Figure 3a) for Ta-doped Li₆.₅La₃Zr₁.₅Ta₀.₅O₁₂ (Ta-LLZO) powders immediately after calcination from wet and dry methods align with the morphological results in Figure 2(b). The trimodal distribution for wet-processed 1WW and 3DW samples also corresponds to the morphology in SEM images. The unimodal distribution for dry-processed 2WD and 4DD samples deviates significantly from the actual morphology. SEM reveals flake-like substances surrounding large particles in wet-prepared LLZO, whereas dry-prepared powder surfaces are relatively clean. This indicates that dry-prepared particles exhibit lower levels of protonation compared to the severe surface contamination in wet-prepared samples. In short, the wet method offers advantages in mixing and forming uniformity, effectively reducing particle size with the aid of IPA. The dry method’s advantages include less time consumption, easier handling, and a tap density twice that of the wet method.
XRD analysis of calcined Ta-LLZO powders reveals significant phase composition differences between wet and dry routes. Wet-processed powders (1WW, 3DW) show predominantly cubic LLZO phase with characteristic lattice expansion — a fingerprint of protonation-driven H⁺/Li⁺ exchange. Dry-processed powders (2WD, 4DD) contain noticeable amounts of residual tetragonal LLZO phase and La₂O₃ impurities after calcination, reflecting the less homogeneous initial mixing but reduced protonation.
Table 2 (XRD quantitative phase analysis) confirms that the wet method’s IPA solvent — while improving mixing — simultaneously induces Li-rich contamination on particle surfaces through grinding media interaction, causing localized lattice softening and amorphization. The dry route avoids this contamination pathway at the cost of introducing tetragonal phase stabilization challenges addressable through sintering temperature adjustment.
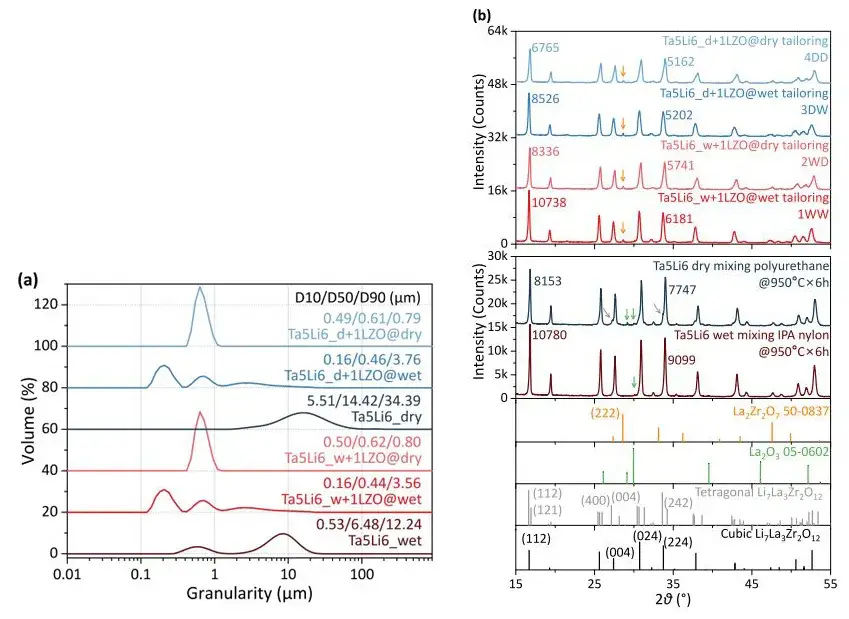
Figure 3. (a) Particle size distribution and (b) XRD patterns for Ta-LLZO powders (1WW, 2WD, 3DW, 4DD) after calcination — wet routes show cubic LLZO lattice expansion from protonation; dry routes show tetragonal phase and La₂O₃ impurities
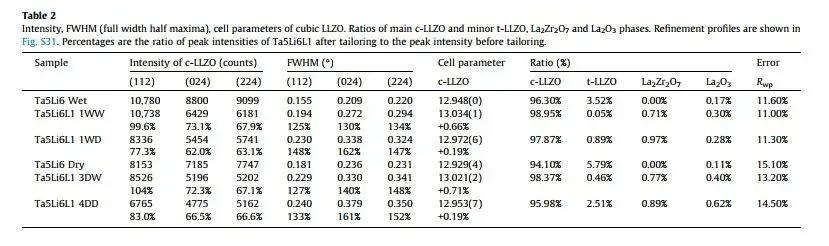
Table 2. XRD quantitative phase analysis results for calcined Ta-LLZO powders from four preparation routes
FTIR and TG-DSC analysis (Figure 4) provides quantitative evidence for the protonation degree in each preparation route. Total weight loss (excluding IPA evaporation) for wet-formed powders (1WW and 3DW) is significantly greater than for dry-formed samples (2WD and 4DD), confirming that wet forming drives substantially greater protonation into the LLZO lattice. The dry forming route therefore holds a decisive advantage for LLZO moisture control.
SEM cross-sections of green pellets (Figure 4, right) show that 1WW and 3DW samples contain clearly visible contamination zones — dark regions corresponding to Li-rich secondary phase accumulation. In contrast, 2WD and 4DD cross-sections show no obvious contamination regions, confirming the SEM-EDS and FTIR findings.
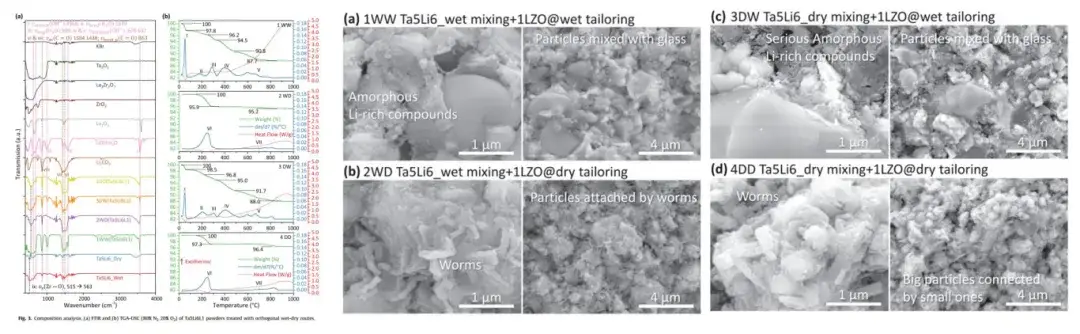
Figure 4. FTIR, TG-DSC, and SEM cross-section results quantifying protonation in LLZO powders — wet-formed 1WW and 3DW show greater weight loss and visible contamination zones absent in 2WD and 4DD
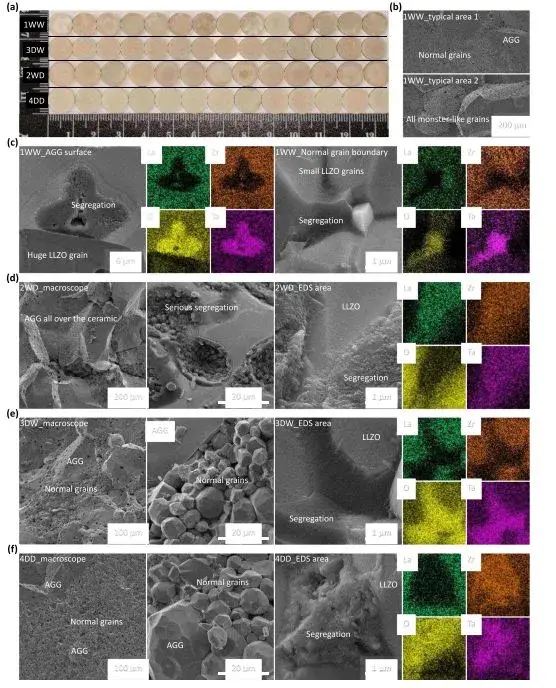
Figure 5. SEM-EDS cross-section of sintered LLZO ceramic pellets — contamination zones visible in wet-formed 1WW and 3DW; clean cross-sections in dry-formed 2WD and 4DD
| Parameter | 1WW (Wet/Wet) | 2WD (Wet/Dry) | 3DW (Dry/Wet) | 4DD (Dry/Dry) ★ |
|---|---|---|---|---|
| Protonation degree | High | Moderate | Moderate–High | Lowest |
| Li-rich contamination (SEM) | Visible zones | None | Visible zones | None |
| XRD cubic phase purity | High (but lattice-expanded) | High | High (lattice-expanded) | Lower (tetragonal + La₂O₃ impurities) |
| Powder tap density | Lower | Moderate | Moderate | ~2× wet method |
| Processing time & complexity | Long, difficult viscous slurry | Moderate | Moderate | Shorter, easier handling |
| Grain boundary activation energy | ~0.3 eV | ~0.3 eV | ~0.3 eV | ~0.3 eV |
| Long-term Li||Li stability (0.1 mA/cm², 2000 h) | Stable | Stable | Stable | Stable |
| Critical current density (CCD, 60°C) | 1.1 mA/cm² | ~1.2 mA/cm² | ~1.1 mA/cm² | 1.6 mA/cm² |
| Implication | Phase purity good; protonation and contamination degrade CCD | Clean pellet; still limited by wet-mix protonation | Clean forming; wet mixing protonation remains | Best overall: no contamination, highest CCD, lower time/cost |
Table 3. Key property comparison of LLZO solid-state electrolytes synthesized via different wet/dry processing pathways
Separating grain impedance from grain boundary impedance in LLZO solid electrolyte requires resolving two relaxation processes whose characteristic frequencies are very close. In most sintered oxide solid electrolytes, the grain-interior relaxation occurs at frequencies in the MHz–GHz range, while grain boundary relaxation appears at lower frequencies — but the two arcs often overlap or merge in Nyquist plots measured by conventional electrochemical workstations limited to below 1 MHz.
In this study, the Toyo LN-Z2-HF ultra-high-frequency impedance system was used to measure ionic resistance at temperatures from −55°C to 25°C across 100 MHz to 1 kHz. The resulting DRT (Distribution of Relaxation Times) analysis separated grain boundary contributions and enabled activation energy calculation. The activation energies for all four LLZO preparation routes (1WW, 2WD, 3DW, 4DD) were found to be approximately 0.3 eV — an exceptionally low value indicating very fast Li⁺ transport at the Li anode / LLZO interface. The authors note that this 0.3 eV value is higher than activation energies previously reported in the literature — a discrepancy attributable to the frequency limitations of earlier equipment: below 1 MHz, the grain boundary semicircle is not fully resolved, causing underestimation of activation energy.
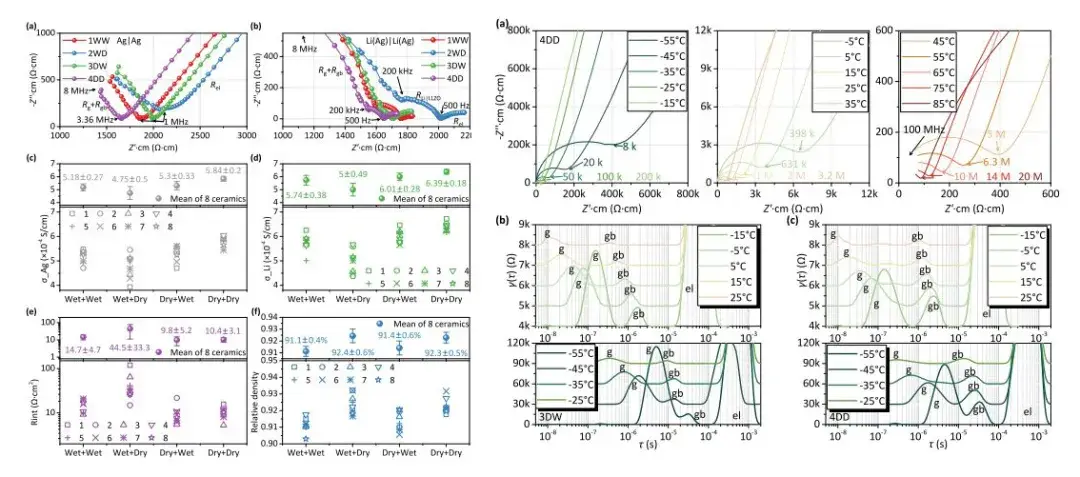
Figure 6. LLZO impedance spectra: Nyquist plots from Toyo LN-Z2-HF (100 MHz–1 kHz) and Keysight E4991B (3 GHz–1 MHz), confirming grain boundary contribution and consistency across measurement platforms
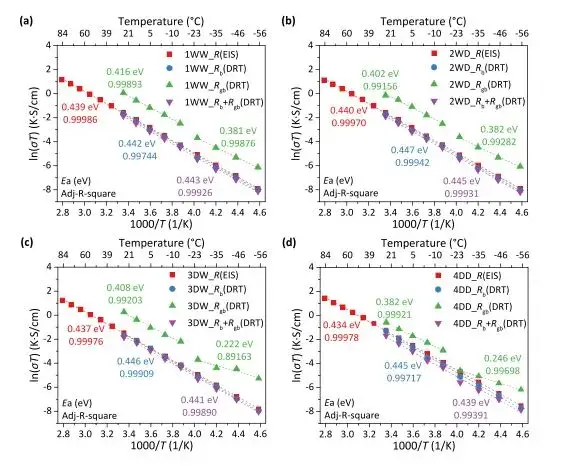
Figure 7. LLZO grain boundary activation energy from DRT fitting of high-frequency EIS (100 MHz) — approximately 0.3 eV for all four routes across −55°C to 25°C; higher than literature values due to frequency resolution improvement
Long-term Li‖Li symmetric cell tests at 0.1 mA/cm² and 0.1 mAh/cm² (Figure 8) confirm that all four LLZO preparation routes — 1WW, 2WD, 3DW, and 4DD — achieve stable polarization over 2,000 hours with no short-circuit events. This confirms that all four routes produce LLZO ceramics with adequate stability against metallic lithium anodes, with no observable side reactions at low current density.
However, critical current density (CCD) testing at 60°C reveals a decisive advantage for the fully dry 4DD route: the 4DD sample achieves a CCD of 1.6 mA/cm² at 1.6 mAh/cm², while the other three routes (1WW, 2WD, 3DW) short-circuit at 1.1–1.2 mA/cm². This 33% improvement in CCD directly reflects the 4DD route’s lower contamination, higher tap density, and more favorable sintering microstructure — all enabled by the solvent-free dry preparation process.
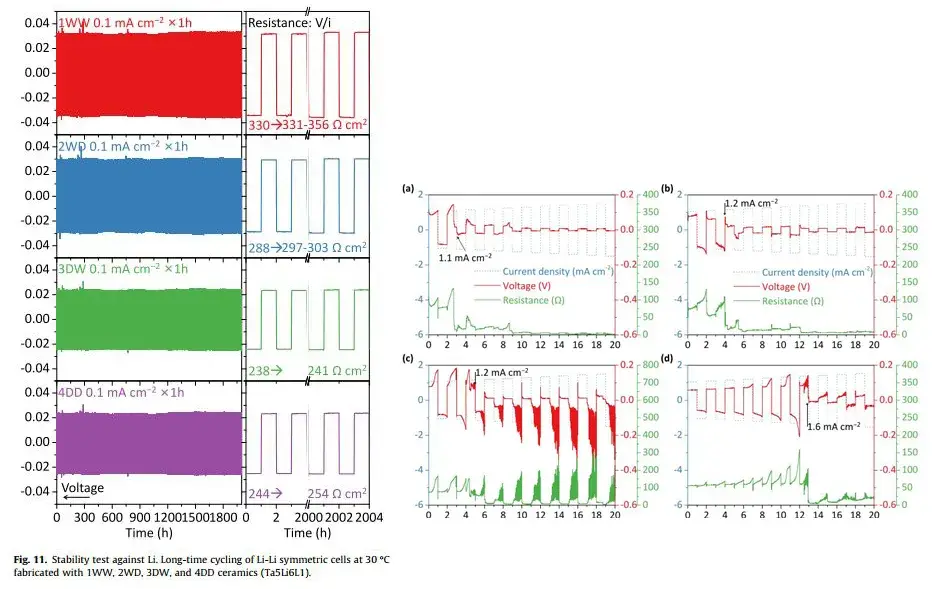
Figure 8. Li‖Li symmetric cell long-term cycling (2,000 h, 0.1 mA/cm², 0.1 mAh/cm²) and critical current density (CCD) at 60°C for LLZO pellets from 1WW, 2WD, 3DW, and 4DD routes
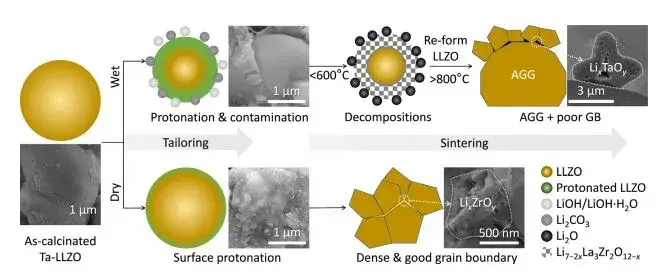
Figure 9. Microstructural evolution comparison between wet and dry LLZO preparation routes during mixing, forming, and sintering
This study systematically demonstrates that the solvent-free dry route for LLZO solid electrolyte preparation offers meaningful advantages over conventional IPA-based wet processing, despite the trade-off in mixing uniformity:
The central measurement challenge in this study — resolving grain from grain boundary impedance contributions — requires testing at frequencies above 7 MHz. At frequencies above this threshold, parasitic resistance and inductance from standard instrument wiring and measurement cells distort results, which is why most commercial electrochemical workstations cap their upper frequency at 1–7 MHz, causing systematic underestimation of grain boundary activation energy as noted in this paper.
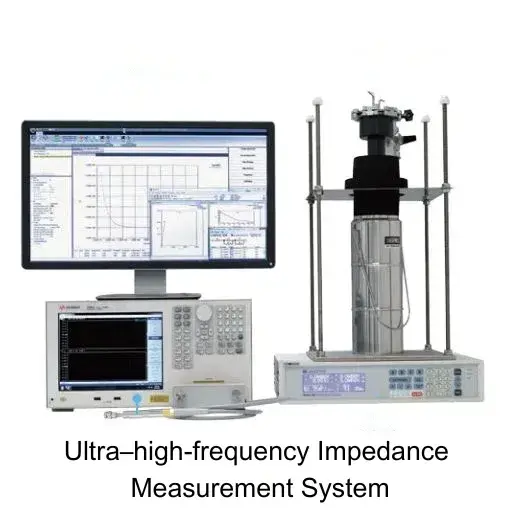
Figure 10. IEST ultra-high-frequency impedance measurement system — 0.01 Hz to 100 MHz, 90 K to 873 K temperature range, enabling grain/grain boundary impedance separation in LLZO solid electrolyte
For researchers requiring an integrated sample preparation and electrochemical characterization workflow for LLZO and other solid electrolytes, the IEST SEMS Series Solid Electrolyte Test System consolidates pellet pressing, in-situ EIS measurement, and real-time density monitoring into a single automated platform:
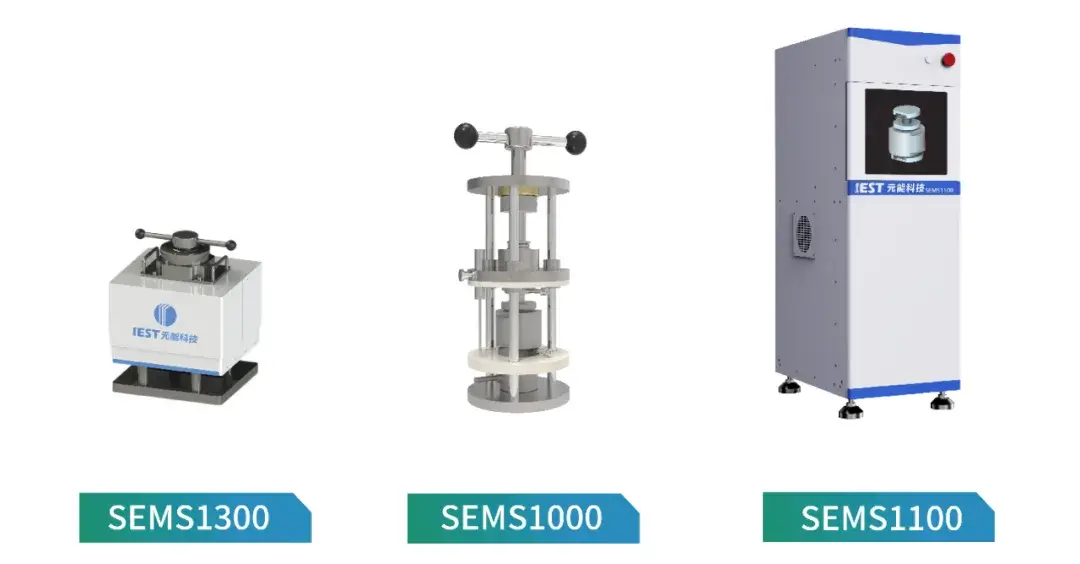
Figure 11. IEST SEMS Series Solid Electrolyte Test System — automated pellet pressing + in-situ EIS + density measurement, compatible with oxide (LLZO, LLTO), sulfide, and polymer electrolytes
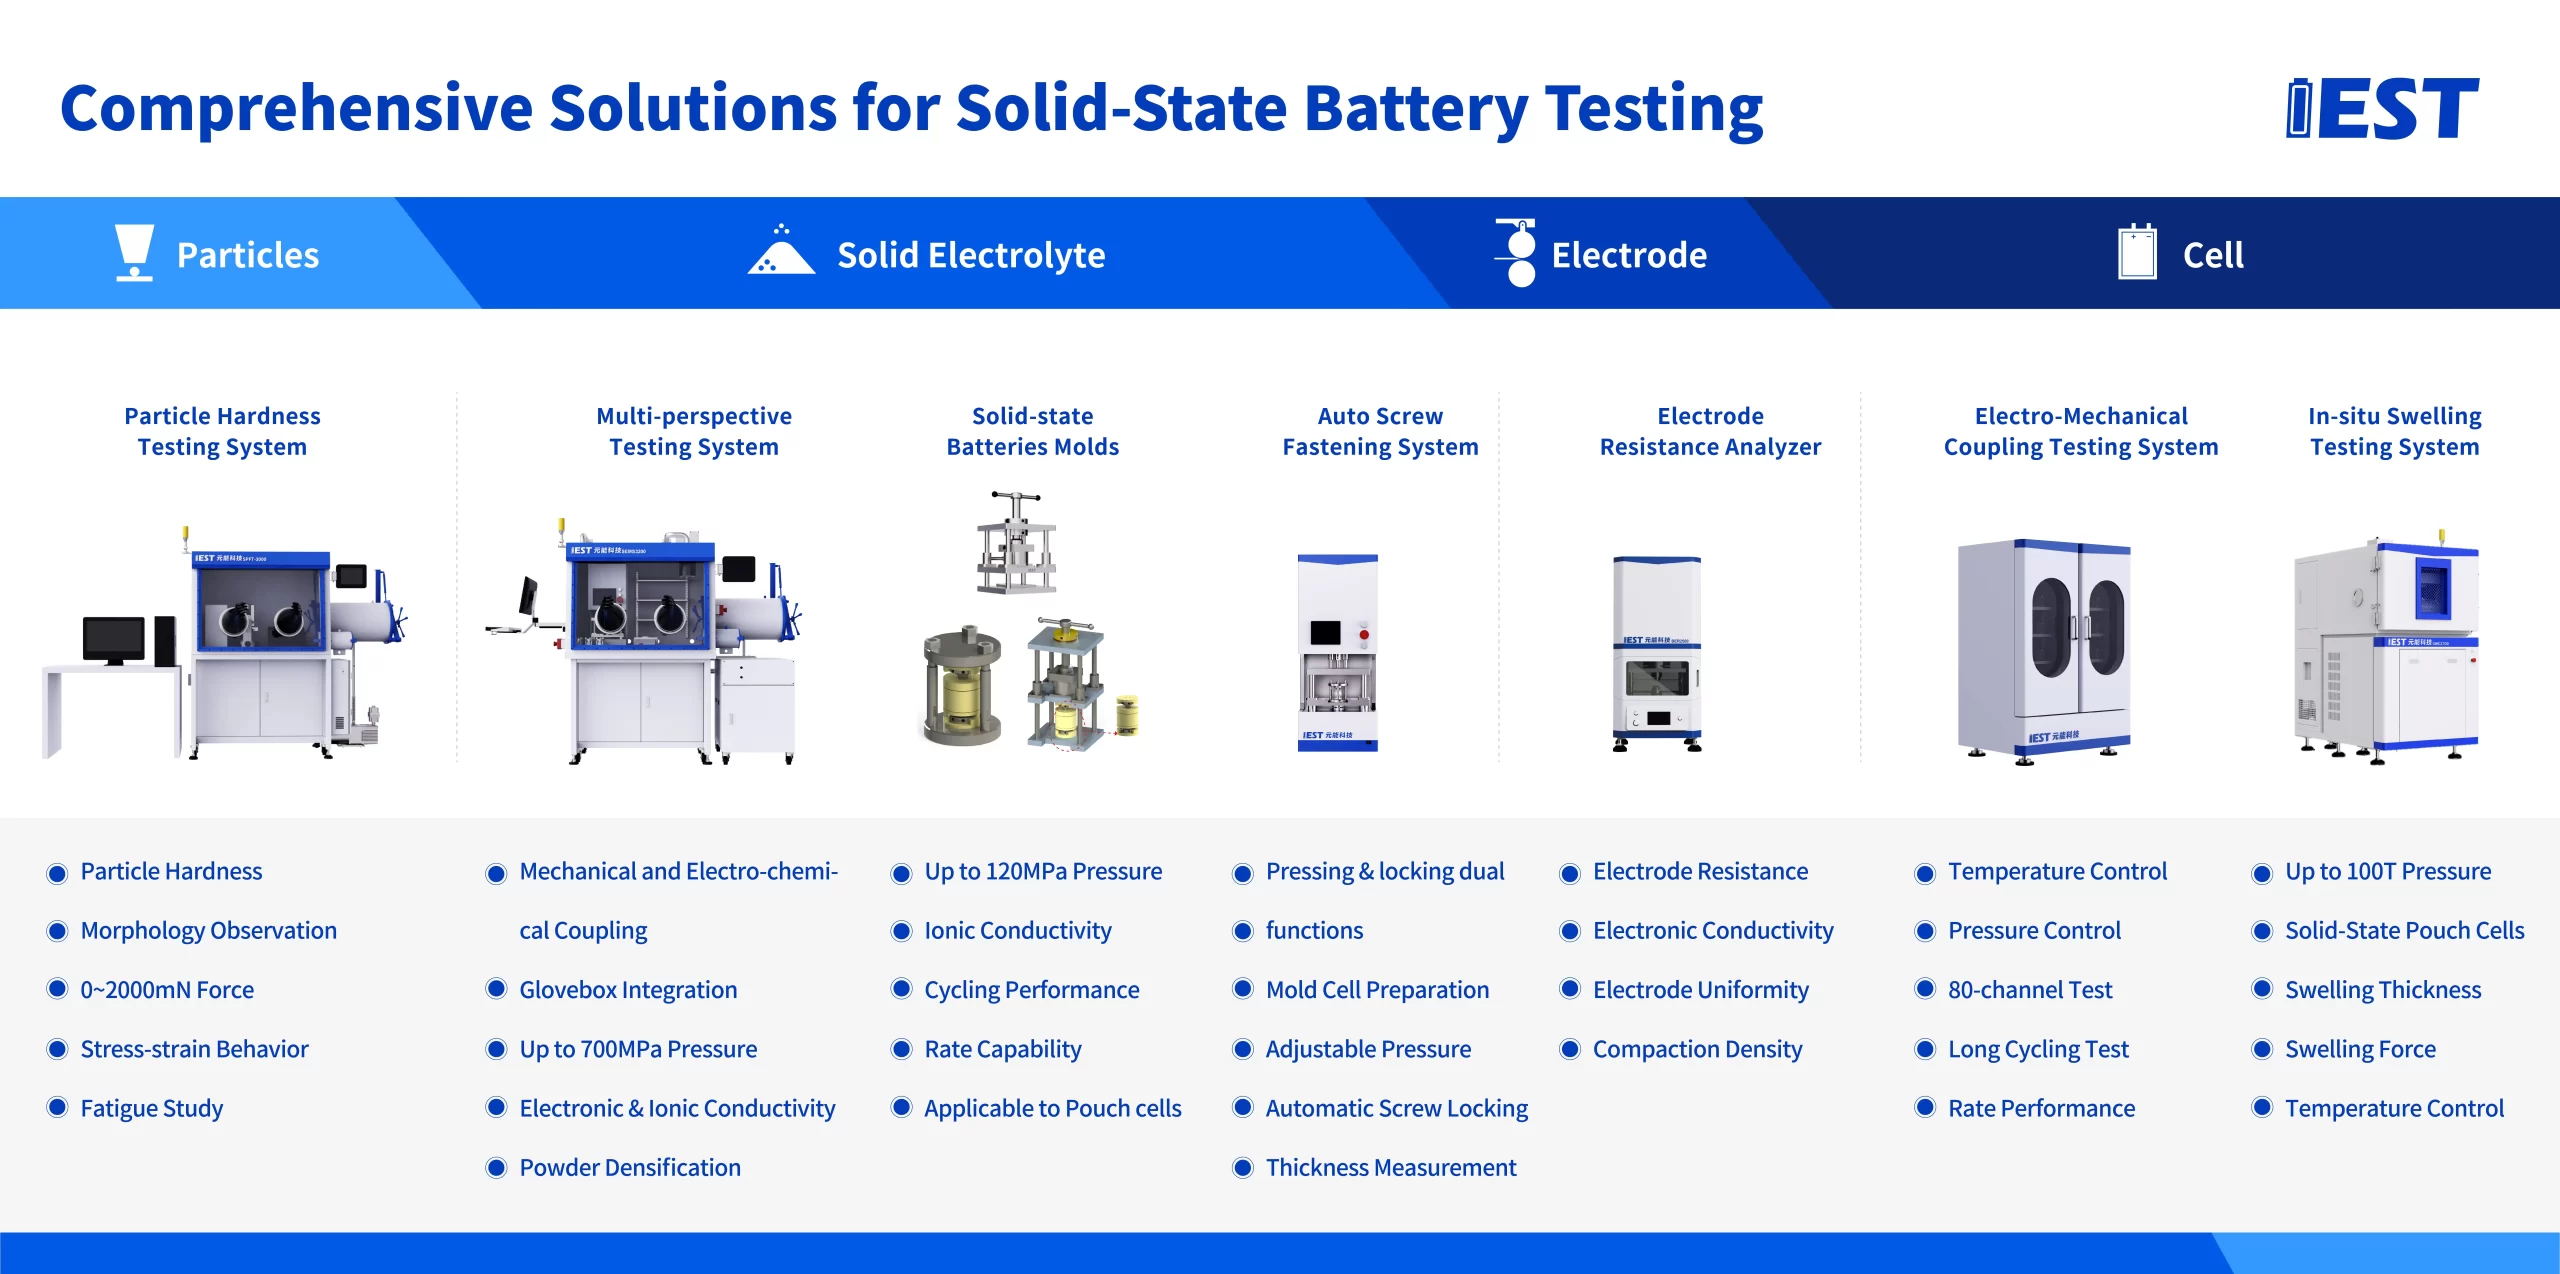
IEST provides a comprehensive suite of solid electrolyte characterization solutions — from 100 MHz ultra-high-frequency impedance for grain/grain boundary separation to SEMS integrated pressing + EIS platforms for oxide, sulfide, and polymer electrolytes.
LLZO (Li₇La₃Zr₂O₁₂) is a garnet-type oxide solid electrolyte for solid-state lithium batteries. It offers high room-temperature Li⁺ ionic conductivity (0.1–1 mS cm⁻¹ in cubic phase), electrochemical stability against metallic lithium anodes up to ~6 V vs. Li/Li⁺, and non-flammability — making it a primary candidate to replace liquid electrolytes for high-safety solid-state batteries. LLZO is distinguished from other solid electrolytes (sulfides, polymers, LIPON) by its combination of room-temperature conductivity, wide electrochemical window, and compatibility with lithium metal without dendrite-driven failure at moderate current densities.
Yes — LLZO solid electrolyte is moisture sensitive. Exposure to atmospheric moisture or protic solvents (such as isopropanol used in wet powder processing) drives H⁺/Li⁺ exchange (protonation) in the LLZO lattice. Protonation causes lattice expansion detectable by XRD peak shifts, reduces the cubic LLZO phase fraction, lowers ionic conductivity, and creates lithium-enriched contamination layers on particle surfaces. The solvent-free dry preparation route (using hydrophobic PTFE/PU binders instead of IPA) eliminates this moisture pathway and substantially reduces protonation — a key advantage confirmed by TG-DSC weight loss comparison and SEM-EDS cross-section analysis of green pellets.
XRD analysis of LLZO powders distinguishes between the high-conductivity cubic phase (space group Ia3̄d) and the low-conductivity tetragonal phase (space group I4₁/acd), as well as impurity phases such as La₂O₃. In wet-prepared LLZO, XRD shows predominantly cubic phase but with characteristic lattice parameter expansion — a signature of protonation-driven H⁺/Li⁺ exchange. In dry-prepared LLZO, XRD reveals tetragonal phase residuals and La₂O₃ impurities from less homogeneous mixing, while lattice expansion is smaller due to reduced protonation. Quantitative Rietveld refinement of XRD patterns provides phase fractions for each preparation route, guiding sintering temperature optimization to convert tetragonal to cubic phase.
Grain boundary impedance in LLZO refers to the additional resistance to Li⁺ transport at the interfaces between sintered LLZO ceramic grains, distinct from the bulk grain (intra-grain) resistance. Separating the two requires resolving their individual RC relaxation arcs in impedance spectra — but in LLZO, grain and grain boundary relaxation frequencies are very close (both in the MHz range), and their Nyquist arcs overlap. Measurements below 1 MHz cannot resolve the grain-interior arc, causing grain and grain boundary contributions to merge and resulting in systematic underestimation of grain boundary activation energy. Testing above 7 MHz (up to 100 MHz) with low-parasitic circuit design is required to fully separate both contributions — as demonstrated in this study and enabled by IEST’s ultra-high-frequency impedance system.
Among the four routes evaluated (1WW, 2WD, 3DW, 4DD), the fully dry route (4DD — dry mixing with PTFE/PU binders, dry forming) achieves the best electrochemical performance. All four routes show stable Li‖Li symmetric cell cycling over 2,000 hours at 0.1 mA/cm², but 4DD achieves a critical current density (CCD) of 1.6 mA/cm² at 60°C — compared to 1.1–1.2 mA/cm² for wet-route samples. The 4DD route also eliminates protonation and Li-rich surface contamination (confirmed by TG-DSC and SEM-EDS) and achieves approximately 2× higher tap density, making it the most promising route for industrial LLZO solid electrolyte production.
Dry-processed LLZO powder achieves a tap density approximately twice that of wet (IPA)-processed powder, primarily because dry mixing produces larger particles without the surface contamination layers that hinder compaction in wet-processed material. Higher tap density directly improves green pellet packing density before sintering, leading to lower sintering temperature requirements, smaller residual porosity in the fired ceramic, and better grain-to-grain contact — all of which contribute to higher ionic conductivity in the final sintered LLZO solid electrolyte. LLZO density after sintering typically targets >95% theoretical density for ceramic solid electrolyte pellets used in battery testing.
