-
iestinstrument
A New Method For Evaluating The Rate Performance Of Electrolyte | Characterization and Application Of McMullin Number & Tortuosity
This article discusses a new method for evaluating electrolyte performance in lithium-ion batteries, focusing on the correlation between electrolyte rate performance and electrode sheet tortuosity by introducing electrode sheet tortuosity and calculating the McMullin Number. Emphasizes how the microstructure of electrode pores (including their connectivity and size) affects lithium ion diffusion and, in turn, battery performance. This article also introduces test methods such as electrochemical impedance spectroscopy and tortuosity measurement to evaluate electrolyte efficiency and accelerate research and development.
In the complex system of lithium-ion batteries, the electrolyte plays an indispensable role as the “blood” inside the battery, responsible for transferring lithium ions between the positive and negative electrodes, thus realizing the storage and release of electrical energy. The performance of the electrolyte directly affects the overall performance of the battery, including energy density, cycle life, charge/discharge rate, and operating temperature range.
For a battery to achieve excellent rate performance, the electrolyte needs to have a high lithium ion transport capacity, and the speed of lithium ion transport is directly related to the electrolyte performance [1]. As shown in Figure 1(a), lithium-ion batteries in the charging process will go through four processes: (1) lithium ions and solvent molecules to form solvated lithium, solvated lithium in the potential difference and concentration difference driven by liquid diffusion; (2) in the solid electrolyte interface (sold electrolyte interphase, SEI) membrane interface solvated lithium ions will be separated from the solvent molecules that is (2) the solvated lithium ions will be separated from the solvent molecules at the SEI membrane interface, i.e., the desolvation process; (3) the desolvated lithium ions are transported in the SEI membrane; and (4) the lithium ions are transported in the active material body to form an intercalation compound[2, 3]
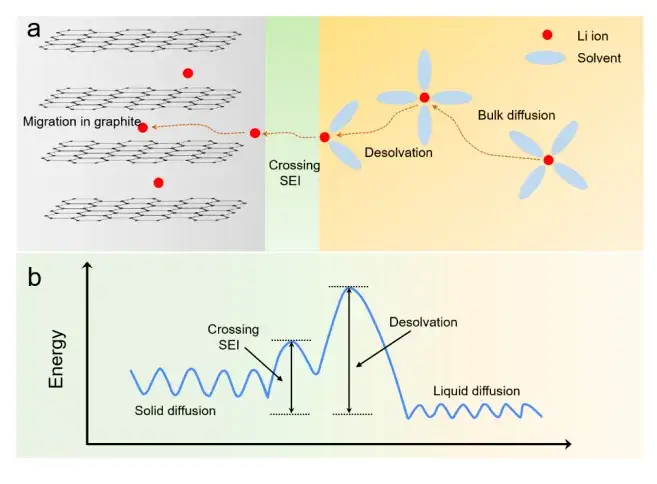 Fig. 1.(a) Schematic diagram of the charging process of a lithium-ion battery; (b) Schematic diagram of the energy barriers at different stages of the charging process[3, 4]
From the four aspects mentioned above, it can be seen that the diffusion and migration of lithium ions are the main factors affecting the rate performance of the battery, and it is well known that the electrode sheet curvature represents the degree of curvature of the transport path of the porous electrode, which can characterize the difficulty of lithium ions migrating through the electrode sheete coating, and thus reflect the rate performance of the battery. Considering from the perspective of electrode microstructure, the electrode sheet curvature is defined as the square of the ratio between the actual transport distance of lithium ions in the electrode and the vertical distance, i.e., τ=(L’/L)2, which is mainly related to the microstructure of the electrode, especially the structure of the pores, such as pore diameter size, pore throat size, pore connectivity, etc. The calculation of curvature is usually done by the method of calculating the porous electrode coating. The usual methods for calculating the curvature include image analysis, which tests the actual connectivity path of the pores, and then calculates it according to the definition; or electrochemical methods to test the effective conductivity or diffusion coefficient, and calculates it according to the effective conductivity (or the effective diffusion coefficient), σeff =σ*ε/τ. For example, testing the ionic impedance of symmetric cells, and then calculating the effective conductivity actually measured according to the thickness and area of the electrodes: 1/σeff = (Rion*A)/d , so that τ/ε=σ/σeff can be calculated.In this paper, by analyzing the correlation between the zigzag degree of the positive and negative electrodes in different electrolytes and the rate performance of the battery, we can preliminarily judge the rate performance of the electrolyte, and improve the research and development efficiency of the electrolyte.
1. Test Conditions & Methods
1.1 Test Equipment
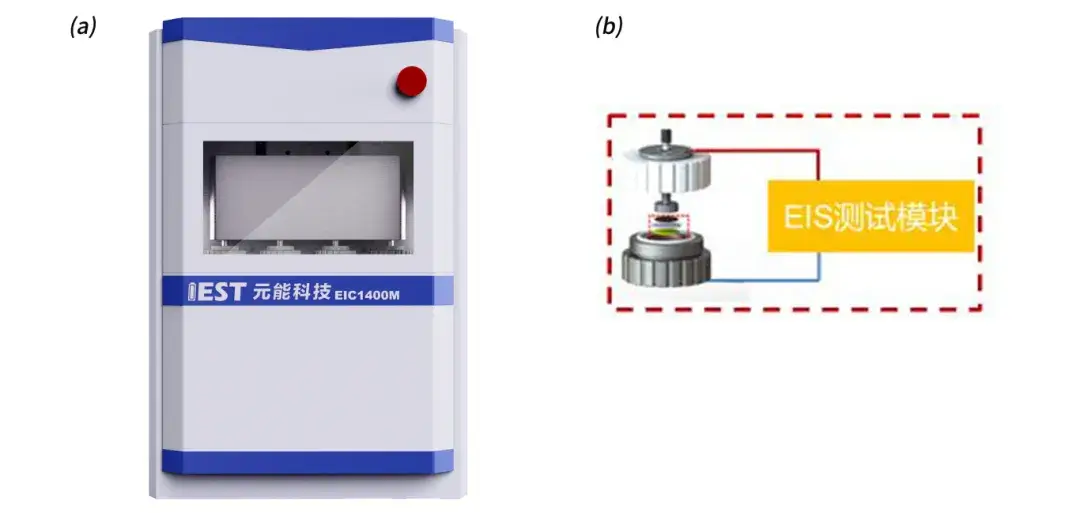
Symmetric battery assembly as well as testing: Electrode Sheet Tortuosity Tester & Separator Ion Conductivity Testerdeveloped(EIC1400) by IEST is used as shown in Fig. 2, which contains four battery assembly fixtures (Fig. 2(b)), and can realize four-channel rapid testing of electrochemical impedance spectra. The pressure range is 0~20Kg and the frequency range is 100KHz~0.01Hz.
Fig. 2. IEST Electrode Sheet Tortuosity Tester & Separator Ion Conductivity Tester(EIC1400) appearance of equipment (a); battery assembly fixtures (b)
Assembling and testing of soft pack batteries: Assemble soft pack batteries with the same positive and negative electrodes and different electrolytes, and test their electrochemical performance by charging and discharging equipment.
1.2 Test Samples
Positive electrode: lithium cobaltate material / negative electrode: graphite material
Electrolyte: Recipe 1: 0.8M LiPF6 EC:DMC:EMC=3:5:2 /
Formula 2: 1.0M LiPF6 EC:DMC:EMC=3:5:2 /
Formula 3: 1.6M LiPF6 EC:DMC:EMC=3:5:2
1.3 Testing Process
Assemble the symmetric cell with electrode sheets in the glove box by means of a jig, put the assembled jig into the equipment, set a force of 5kg to apply pressure to the jig, after about 10min, click start experiment on the software to test the electrochemical impedance of the cell, and finally get the McMullin number of the electrode sheets by fitting and calculating through the software.
Battery test: Test the charging and discharging performance of the battery at different multiplication rates (0.5C/1C/3C/5C/10C).
1.4 Calculation of the McMullin Number

In the formula: τ is the curvature; Rion is the ionic resistance; A is the area of the electrode sheet; ε is the porosity of the electrode sheet; σ is the conductivity of the electrolyte; d is the thickness of the electrode sheet. Because the test method of the porosity of the electrode sheet is complicated, the ratio of the curvature and porosity, i.e., McMullin number (Nm = τ / ε), is usually used to characterize the curvature of the electrode sheet, as shown in equation (2).

The impedance of the symmetric cell was tested using an electrochemical workstation and the EIS obtained is shown in Figure 3. The Nyquist plot of the electrochemical impedance spectrum at this point is characterized by the shape of the intersection of the line segments in the low-frequency region and the line segments in the high-frequency region, which is a typical Nyquist plot without electrochemical reaction. The low-frequency line segment in the Nyquist diagram is extended until it intersects with the X-axis, and the difference between the intersection point and the intersection point of the high-frequency line segment and the X-axis is three times of the ionic impedance of the coating of the electrode sheet, and the ionic impedance of the electrode sheet can be obtained by substituting the ionic impedance of the fitted Rion into Equation (2) to obtain the MacMillan number of the electrode sheet, which can be analyzed as the degree of the zigzagging of the electrode sheet.
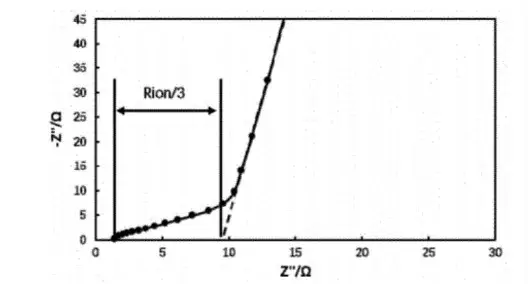
Fig. 3. electrochemical impedance spectra of symmetric cells
2. Analysis Of Results
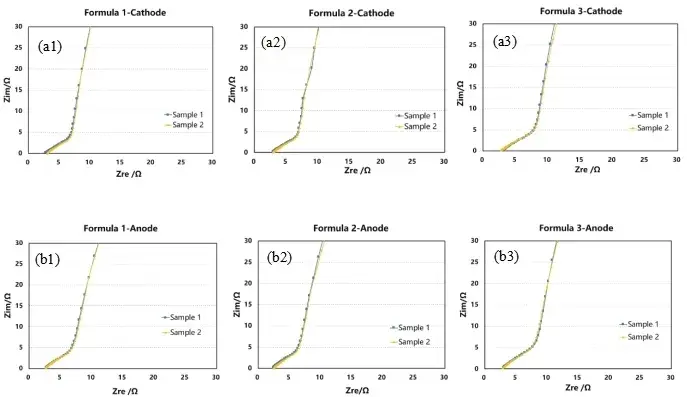
Fig. 4. Impedance profiles of positive (negative) cell symmetric cells with different electrolytes: Cathode-formulation 1 (a1); Cathode-formulation 2 (a2); Cathode-formulation 3 (a3); anode-formulation 1 (b1); anode-formulation 2 (b2); anode-formulation 3 (b3)
The electrochemical impedance spectra were tested using different electrolytes and the same positive or negative electrode sheets assembled into a symmetrical cell, and the results are shown in Figs. 3(a1), 3(a2), 3(a3), and 3(b1), 3(b2), 3(b3). The impedance profile was fitted to obtain the ionic resistance of each electrode sheet, and then the ionic resistance values were substituted into Eq. (2) to obtain the electrode sheet McMullin number, as shown in Fig. 5.
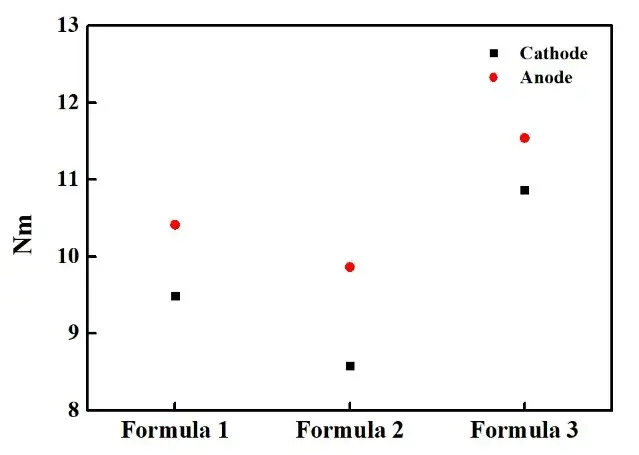
Fig. 5. McMullin number obtained from positive and negative electrode sheets tested in different electrolytes
As can be seen from the above figure, the McMullin numbers of both positive and negative electrode sheets in the electrolyte are: formula 2 < formula 1 < formula 3.When measuring the curvature by electrochemical methods, the effective conductivity or the effective diffusion coefficient obtained from the first test is more in line with the actual situation of the battery, which contains not only the information of the electrode microstructure, but also the physical characteristics of the electrolyte, for example, the viscosity of the electrolyte and the different surface tension will result in the Different electrolyte wettability, there may be no electrolyte in the actual part of the nanopore space, which will lead to the ion transport path becomes farther, hindering the lithium ion shuttle between the positive and negative electrodes, thus affecting the rate performance, discharge capacity and service life of the battery. The composition of the electrolyte and lithium salt concentration will change the viscosity and surface tension, which in turn affects the wettability. The wetting effect of electrolyte can be improved by improving the liquid injection process, improving the core winding process, and adding electrolyte wetting agents. In addition, additives in the electrolyte can also affect the battery performance by changing the Li+ solvation structure.
Table 1. Rate performance of batteries in different electrolytes

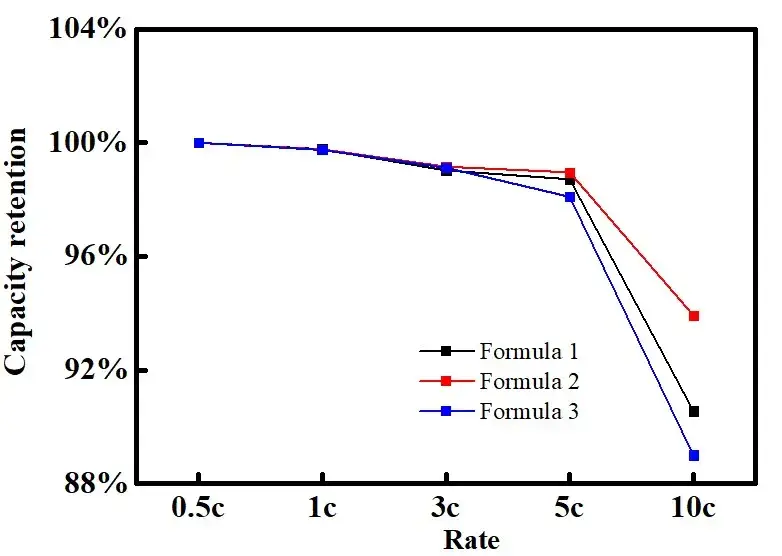
Fig. 6. Rate-capacity retention curves of batteries in different electrolytes
Fig. 6 and Table 1 demonstrate the capacity and capacity retention of soft pack batteries assembled with the same electrode sheet and different electrolytes at different multiplicities. From the table, it can be seen that the capacity of the battery decreases with the increase of multiplication rate. When the multiplication rate is equal to 10C, the capacity retention rate of the battery is 90.55% for formulation 1, 93.92% for formulation 2, and 89% for formulation 3. Combined with the data of McMullin’s number, it can be seen that the difficulty of lithium-ion migration in the coating is affected by the electrolyte formulation, and the batteries with large values of McMullin’s number correspond to poorer multiplication rates, which indicates that the results of the electrochemical performance test of the electrolyte and the results of the flexural test can be corresponded to each other. Therefore, we can predict the rate performance of the electrolyte through the curvature test of the electrodes in different electrolytes, which can quickly correlate the electrolyte formulation with the electrochemical performance, accelerate the development of electrolytes, and shorten the evaluation cycle.
3. Summary
This paper assembled symmetrical batteries and pouch cells with different electrolyte formulations, tested the tortuosity and McMullin Number of the electrode sheet in different electrolytes and the rate performance of the battery, and found that there is a certain correlation between the two. Therefore, we can preliminarily judge the rate performance of the electrolyte by testing the tortuosity of the electrode sheet. In addition to judging the rate performance of different electrolytes, the tortuosity test of the electrode sheet can also be used to study the effects of electrode formulation, porosity, main material morphology, diaphragm type, etc. on the performance of lithium-ion batteries.
4. References
[1] Li N, Chen Z P, Ren W C, et al. Flexible graphene-based lithium ion batteries with ultrafast charge and discharge rates[J]. Proceedings of the national academy of sciences of the United States of America, 2012, 109 (43): 17360-17365.
[2] Yamada Y, Furukawa K, Sodeyama K, et al. Unusual stability of acetonitrile-based superconcentrated electrolytes for fast-charging lithium-ion batteries [J]. Journal of the American chemical society, 2014, 136(13): 5039-5046.
[3] Caiwl, Yao Y X, Zhu G L, et al. A review on energy chemistry of fast-charging anodes [J]. Chemical society reviews, 2020, 49 (12): 3806-3833.
[4] Yin ZG, Wu NN, Cao MH, et al. Progress of electrolyte for fast-charging lithium-ion batteries[J]. New Energy Progress, 2024, 12(2): 216-226.
Subscribe Us
Contact Us
If you are interested in our products and want to know more details, please leave a message here, we will reply you as soon as we can.


