-
iestinstrument
Activation Energy Calculation And Temperature Changing Conductivity Testing Of Anode And Cathode Electrode Materials And Solid Electrolytes
1. Preface
Activation energy (Ea) refers to the energy barrier that must be overcome for a chemical reaction to proceed. First proposed by Swedish scientist S.A. Arrhenius in 1889, this concept is grounded in extensive experimental observations and is formalized through the well-known Arrhenius equation. The activation energy represents the minimum energy required to initiate a reaction, and its magnitude directly influences the kinetics of processes such as ion diffusion, electron conduction, and phase transformations in materials. In the context of lithium-ion batteries, it also reflects the energy needed for an atom to migrate from its equilibrium position.

Temperature significantly affects the performance and longevity of lithium-ion batteries. Therefore, studying the thermal behavior of battery materials—including cathodes, anodes, separators, and electrolytes—is essential for developing efficient, safe, and durable energy storage systems. However, holistic battery-level testing only reveals macroscopic trends without clarifying underlying mechanisms. Hence, it is necessary to evaluate the activation energy of individual material components and establish correlations among them. Such an approach provides fundamental insights and supports targeted material optimization.
To extract Ea experimentally we commonly use the Arrhenius equation to relate a transport coefficient (rate constant, ionic conductivity or electronic conductivity) to temperature. Plotting ln(conductivity) vs 1/T — an Arrhenius plot (conductivity) — yields a straight line whose slope gives Ea. This Arrhenius plot conductivity method is widely used to compare temperature-dependent performance of cathode, anode and solid-electrolyte materials.
This article explains experimental protocols (PRCD3100, EIS/LATP), demonstrates how combining temperature-dependent conductivity measurements with the Arrhenius equation enables a deeper understanding of charge transport mechanisms in battery materials. Such methodology also offers reliable data for computational modeling and material design.
2. Experimental Systems and Measurement Approach
2.1 Test Hardware
-
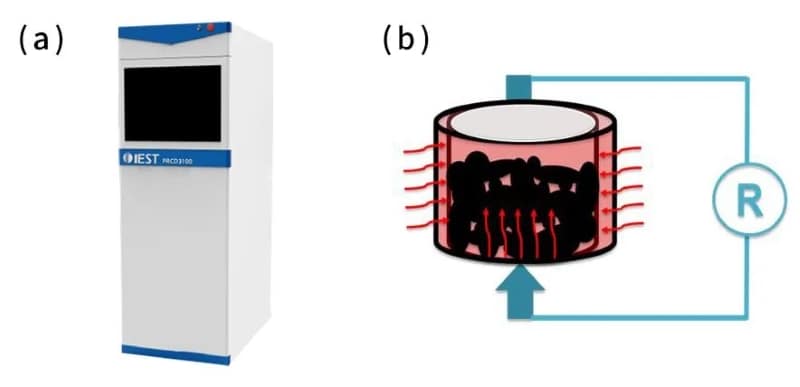
PRCD3100 Powder Resistivity & Compaction Density Tester (IEST) with temperature-raise module — used to measure powder electronic conductivity under controlled pressures (10–200 MPa) and temperatures.
-
Solid electrolyte testing rig + electrochemical workstation — used to measure ionic conductivity (via EIS) of pressed LATP pellets over a temperature range.
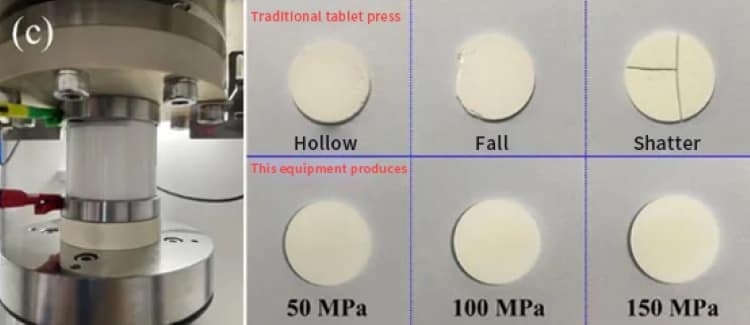
Figure 1. (a) PRCD3100; (b) temperature increasing device; (c) solid electrolyte testing system
2.2 Materials tested
-
Cathode materials: LiFePO₄ (LFP) and layered NCM (ternary) powders.
-
Anode material: Graphite.
-
Solid electrolyte: Oxide LATP (Li₁₊ₓAlₓTi₂₋ₓ(PO₄)₃).
2.3 Measurement principle
-
Measure conductivity σ(T) at multiple temperatures while holding pressure constant.
-
Use the Arrhenius equation in the conductivity form:

where σ is conductivity, σ₀ is the pre-exponential factor, Ea is activation energy, kB is Boltzmann’s constant, and T is absolute temperature (K). (Alternatively, for molar activation energies one may write σ=σ0exp(−Ea/RT)\sigma = \sigma_0 \exp(-E_a/RT)σ=σ0exp(−Ea/RT) with the gas constant R.)
-
Rearranged for linear fitting:

An Arrhenius plot (lnσ versus 1/T) yields a straight line; the slope = −Ea/kB. From the slope we calculate Ea (often reported in electronvolts, eV).
3. Results — Arrhenius Plot Conductivity and Extracted Activation Energies
3.1 Electronic Conductivity and Activation Energy of Electrode Materials (LFP, NCM, Graphite)
The resistivity of lithium iron phosphate (LFP) powder was measured under pressures ranging from 10 to 200 MPa and at various temperatures. As shown in Figure 2(a), resistivity decreases with rising temperature at all pressure levels.
Using the Arrhenius equation, we relate conductivity (σ) to temperature:

Taking the natural logarithm yields:

By plotting ln(σ)ln(σ) against 1/T1/T, we obtain a linear relationship where the slope corresponds to −Ea/k−Ea/k, enabling the calculation of activation energy.
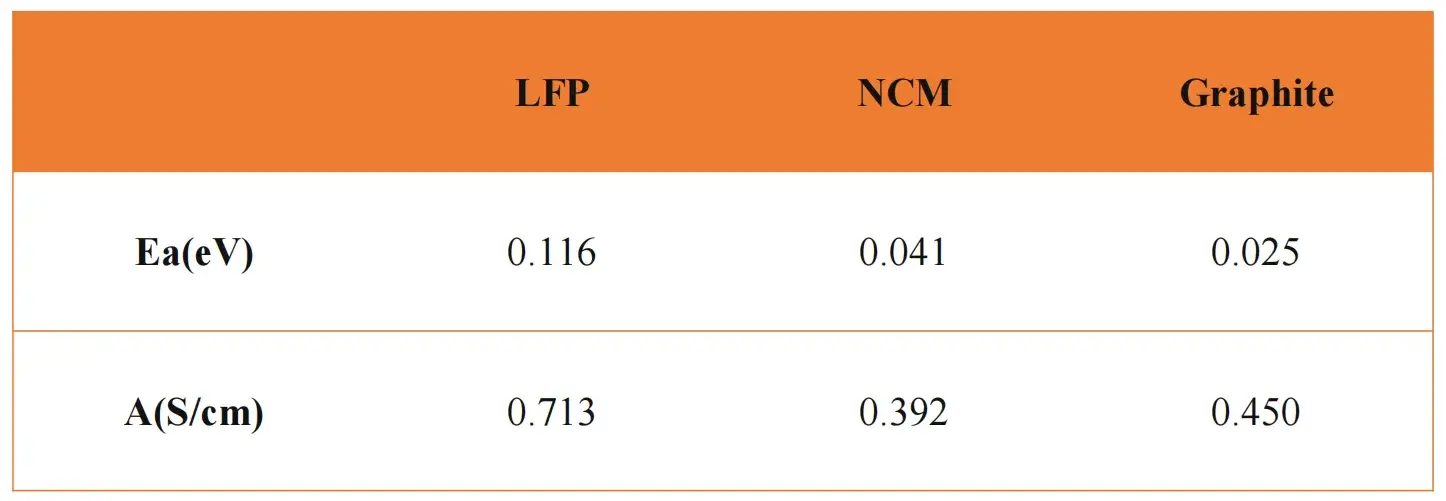
As illustrated in Figure 2(b), LFP, NCM, and graphite materials were evaluated using this method. Table 1 summarizes the calculated activation energies and pre-exponential factors. Graphite exhibited the lowest activation energy (0.025 eV), followed by NCM (0.041 eV), and LFP (0.116 eV). These results suggest that electron transfer is easiest in graphite and most challenging in LFP.
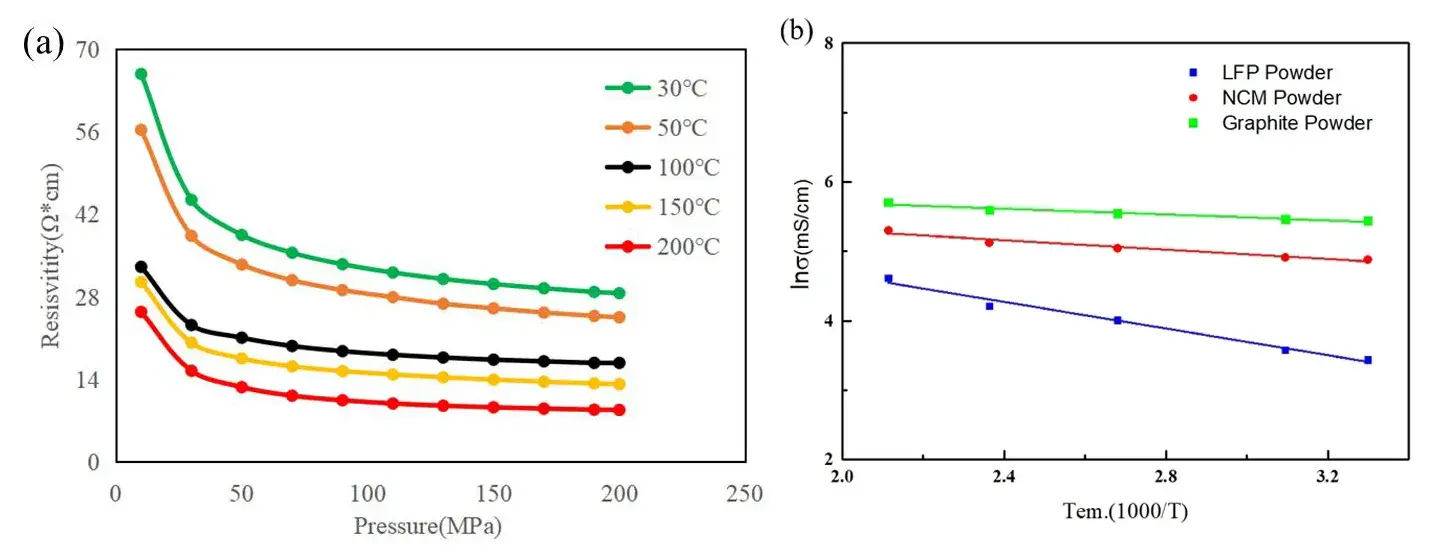
Figure 2. (a) Resistivity of LFP powder between 10 and 200MPa at different temperatures;
(b) Arrhenius plot of conductivity versus temperature of different positive and negative electrode materials.
Table 1. Calculated results of energy of activation and pre-exponential factor of different positive and negative electrode materials
3.2 Ionic Conductivity of Solid Electrolytes
Solid electrolytes face challenges in achieving sufficient ionic conductivity for practical applications. The energy barrier for Li-ion migration between stable lattice sites significantly influences macroscopic ion transport.
We performed EIS tests on an oxide-based solid electrolyte (LATP) at different temperatures. The Nyquist plots in Figure 3(a) show a characteristic semicircle whose size decreases with increasing temperature, indicating reduced ionic resistance.
Using the Arrhenius equation, the ionic conductivity was plotted against inverse temperature (Figure 3(b)). The calculated activation energy for LATP was 0.044 eV.
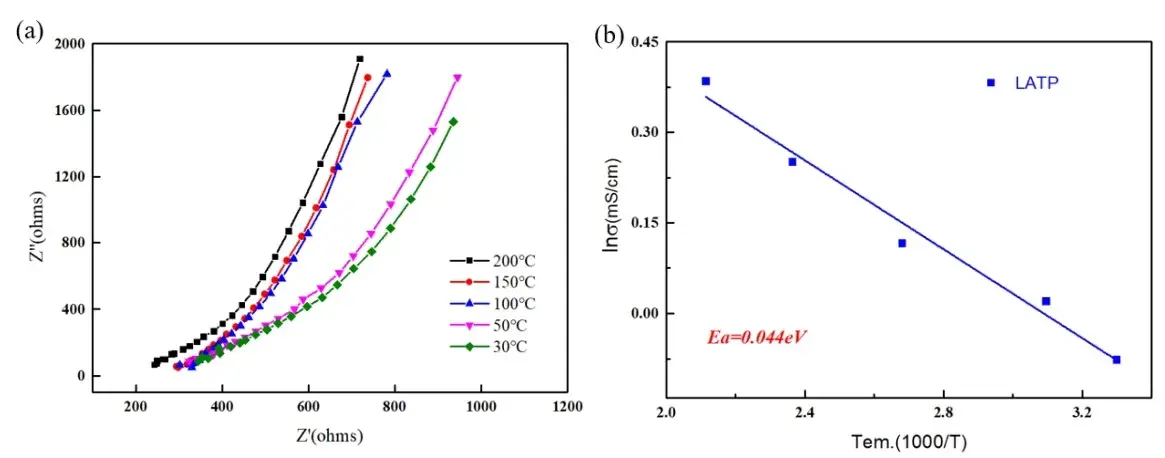
Figure 3. (a) Nyquist plots corresponding to Fig. 1(a) for LATP materials at different temperatures;
(b) Arrhenius plots of ionic conductivity versus temperature for LATP materials
During the test process of solid electrolyte ionic conductivity, on the one hand, the density, roughness and integrity of the pressed solid electrolyte sheet will affect the test results of the solid electrolyte conductivity; on the other hand, only stable and uniform force application during the test can ensure the accuracy of the test results. The testing system for solid electrolytes independently developed by IEST can continuously and stably press solid electrolyte tablets; at the same time, it can apply stable and standardized pressure, which plays an important role in the solid electrolyte and its lithium metal battery.
4. Discussion — what the Arrhenius analysis reveals and practical implications
4.1 Relating Ea to battery performance
-
Lower Ea → better temperature resilience: Materials with smaller activated barriers (e.g., graphite, NCM) maintain higher conductivity at low T and exhibit superior rate capability under cold conditions.
-
Higher Ea → require mitigation: LFP’s higher Ea explains its poorer intrinsic electronic conductivity and why electrode formulations include conductive carbon and optimized compaction to improve percolation networks.
-
Solid electrolytes: LATP’s moderate Ea (0.044 eV) indicates temperature sensitivity of ionic transport; reducing Ea via dopants or optimized crystal pathways improves room-temperature ionic conductivity.
4.2 Practical measurement considerations for reliable Arrhenius plots conductivity
-
Stable contact & pressure control: For powdered electrodes, conductivity depends strongly on compaction density and contact resistance. Keep pressure constant during temperature sweeps or correct for pressure effects.
-
High-resolution temperature control: Use small temperature steps and allow thermal equilibration before sampling σ(T) to avoid transient artifacts.
-
Range selection: Arrhenius behavior may change across temperature regimes (e.g., different conduction mechanisms). Fit linear regions separately if curvature appears.
-
Units & constants: When extracting Ea from slope, be consistent with units (if slope = −Ea/kB, with kB = 8.617×10⁻⁵ eV·K⁻¹ yields Ea in eV).
-
Error analysis: Report uncertainty from linear regression and replicate measurements to ensure statistical confidence.
4.3 Using Ea and Arrhenius plots for materials engineering
-
Material screening: Compare Ea from Arrhenius plot conductivity to prioritize materials with low thermal activation barriers for low-temperature applications.
-
Process optimization: Use Ea together with σ₀ to distinguish whether temperature sensitivity (Ea) or intrinsic prefactor (σ₀, microstructure) limits performance.
-
Model inputs: Ea values provide critical parameters for physics-based battery models and thermal-electrochemical simulations.
5. Recommendations & Best Practices
- Report both Ea and σ₀ from Arrhenius fits — they convey complementary information: barrier height and intrinsic prefactor.
- Standardize compaction/pressure for powder conductivity tests; log sample dimensions and contact geometry.
- Combine EIS and DC methods: use EIS for ionic conductors and four-probe or pressure-controlled DC for electronic conductivity to minimize contact artifacts.
- Validate linearity of the Arrhenius plot; curvature may indicate multiple conduction mechanisms or phase changes.
- Use Ea in design trade-offs: for electrodes, balance composition (e.g., Ni content) with mechanical robustness and acceptable Ea to meet target rate and temperature performance.
6. Summary
Temperature-dependent conductivity measurements, interpreted through the Arrhenius equation, provide deep insights into the charge transport properties of battery materials. The derived activation energy serves as a key indicator of how easily electrons or ions move within a material, supporting both fundamental research and engineering applications.
The pre-exponential factor A, which is material-specific and temperature-independent, also offers valuable information regarding the intrinsic properties of the material. Further research may explore the correlation between A and material microstructure or composition.
This methodology offers a powerful tool for battery material developers, providing essential data for simulation, optimization, and innovation in energy storage technologies.
7. References
[1] Wu Wenwei. Concise Inorganic Chemistry[M]. Chemical Industry Press, 2019.
[2] Weng S, Zhang X, Yang G, et al. Temperature-dependent interphase formation and Li+ transport in lithium metal batteries[J]. Nature communications, 2023, 14(1): 4474.
[3] Zhao Q, Liu X, Zheng J, et al. Designing electrolytes with polymerlike glass-forming properties and fast ion transport at low temperatures[J]. Proceedings of the National Academy of Sciences, 2020, 117(42): 26053-26060.
Contact Us
If you are interested in our products and want to know more details, please leave a message here, we will reply you as soon as we can.


