

📄 Source Paper
Ying Lin, Wenxuan Hu, Meifang Ding, Yonggang Hu, Yufan Peng, Jinding Liang, Yimin Wei, Ang Fu, Jianrong Lin, Yong Yang
DOI: 10.1002/aenm.202400894
| Journal: Advanced Energy Materials (2024)
| Institutions: Xiamen University
✓ Equipment: IEST Silicon-Based Anode Swelling Screening System(RSS1400) · IEST In-Situ Cell Swelling Testing System(SWE2100) used in this research
Lithium plating — metallic Li deposition on graphite — occurs under extreme conditions such as fast charging and sub-ambient temperatures, and can form electrically isolated “dead lithium,” accelerate SEI buildup, and produce dendrites that risk short circuits and thermal runaway. Existing detection methods often identify plating onset but lack resolution to describe its subsequent morphological evolution. This study applies a multidimensional, in-situ methodology combining DEIS and sub-micron thickness monitoring to (1) detect plating onset with high SOC resolution, (2) classify deposition states, and (3) link plating stages to capacity fade and safety risk metrics in commercial LFP pouch cells.
Recently, Professor Yong Yang team at Xiamen University comprehensively studied the evolution process of Lithium plating on graphite surfaces in graphite/LiFePO4 pouch batteries under harsh conditions (low temperature/room temperature fast charging) using a combined analysis method of in-situ dynamic electrochemical impedance spectroscopy (DEIS) and thickness measurements. This work expands the application of impedance spectroscopy and thickness measurement in detecting Li plating. Researchers found that the anode charge transfer resistance Rct,a exhibits a three-stage variation pattern as Li plating progresses. Combined with mass spectrometry titration (MST) and scanning electron microscopy, they confirmed that these three stages correspond to different Li plating evolution processes: non-plating, lithium nucleation & growth, and dendrite growth. The study also extensively analyzed the effects of lithium plating and different lithium deposition states on battery capacity degradation. This research titled “Unveiling the Three Stages of Li Plating and Dynamic Evolution Processes in Pouch C/LiFePO4 Batteries” was published in the prestigious journal “Advanced Energy Materials”.
Commercial pouch cells with graphite anodes and LiFePO₄ cathodes (C/LiFePO₄) were used as the primary test platform. To decouple electrode contributions in thickness signals, LTO (zero-strain anode material) was used in dedicated LTO//LFP and LTO//Graphite assemblies — providing independent reference measurements of each electrode’s volume expansion.
DEIS (dynamic EIS): A continuous AC perturbation (50 kHz → 5 Hz) was applied during charging. Low-frequency data were de-emphasized to obtain EIS spectra every 33 seconds (<1% SOC resolution). DRT (distribution of relaxation times) analysis extracted the negative-electrode charge transfer resistance Rct,a as a dynamic descriptor of plating state.
Thickness monitoring:The IEST RSS1400 provided high-resolution (0.1 µm) thickness traces for rapid electrode decoupling experiments. The IEST SWE2100 recorded real-time pouch cell thickness under controlled preload (285 kg) and temperature (0°C) to quantify the dT/dQ metric that serves as the macroscopic plating indicator.
Ex-situ validation: Mass spectrometry titration (MST) quantified “dead lithium” and SEI species at each stage. SEM and optical microscopy characterized deposited lithium morphology at representative plating stages.
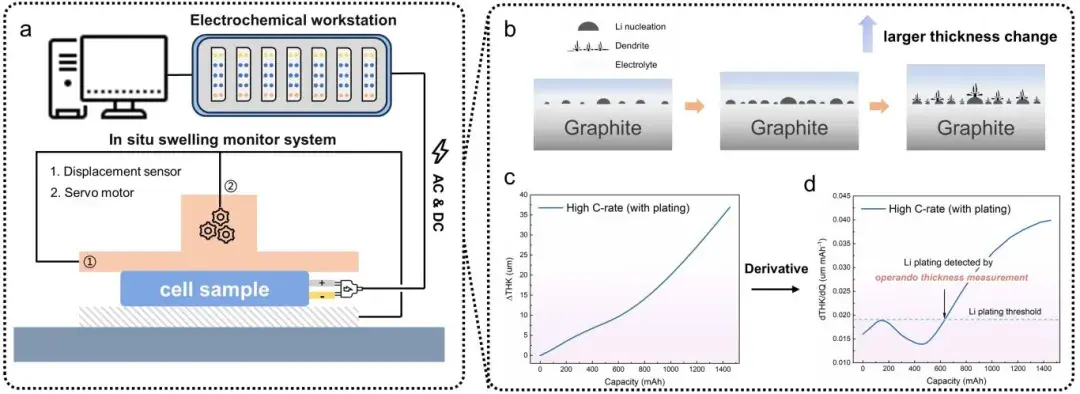
Figure 1. Schematic of the in-situ DEIS and thickness measurement device used for lithium plating detection experiments — electrochemical workstation integrated with the IEST in-situ swelling tester — and the thickness-based method for detecting lithium plating onset.
Cells were charged at multiple C-rates (0.1C, 0.2C, 0.5C at 0°C and room-temperature high-rate tests) to induce a spectrum of plating behaviors ranging from plating-free graphite lithiation through nucleation to extensive dendrite growth. Incremental capacity analysis (ICA) and differential OCV (dOCV) were used to cross-validate plating indicators against the DEIS and thickness signals.
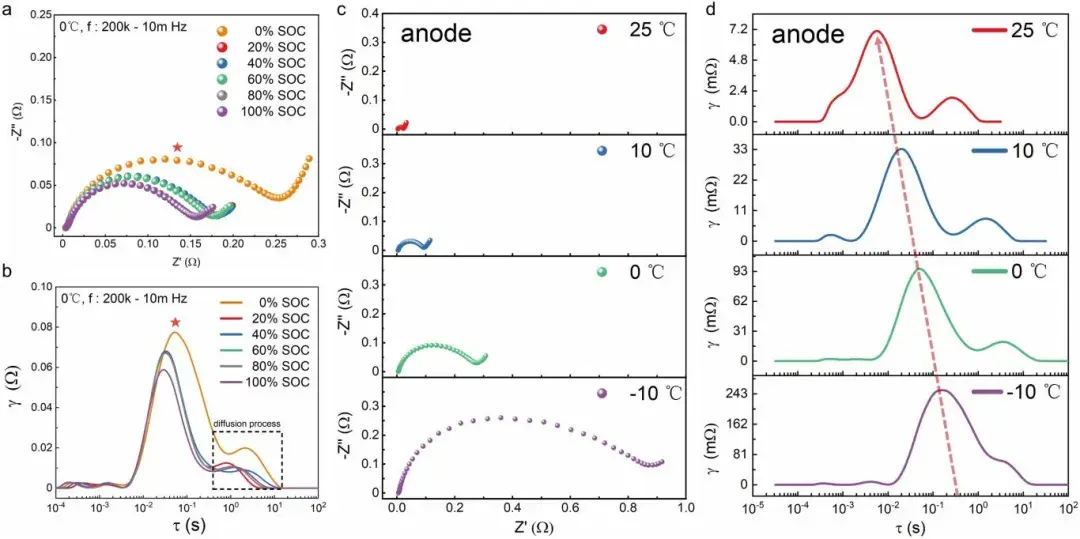
Figure 2. Negative electrode EIS Nyquist plot and DRT analysis at different SOC and temperatures — showing Rct,a evolution that underlies the three-stage lithium plating classification.
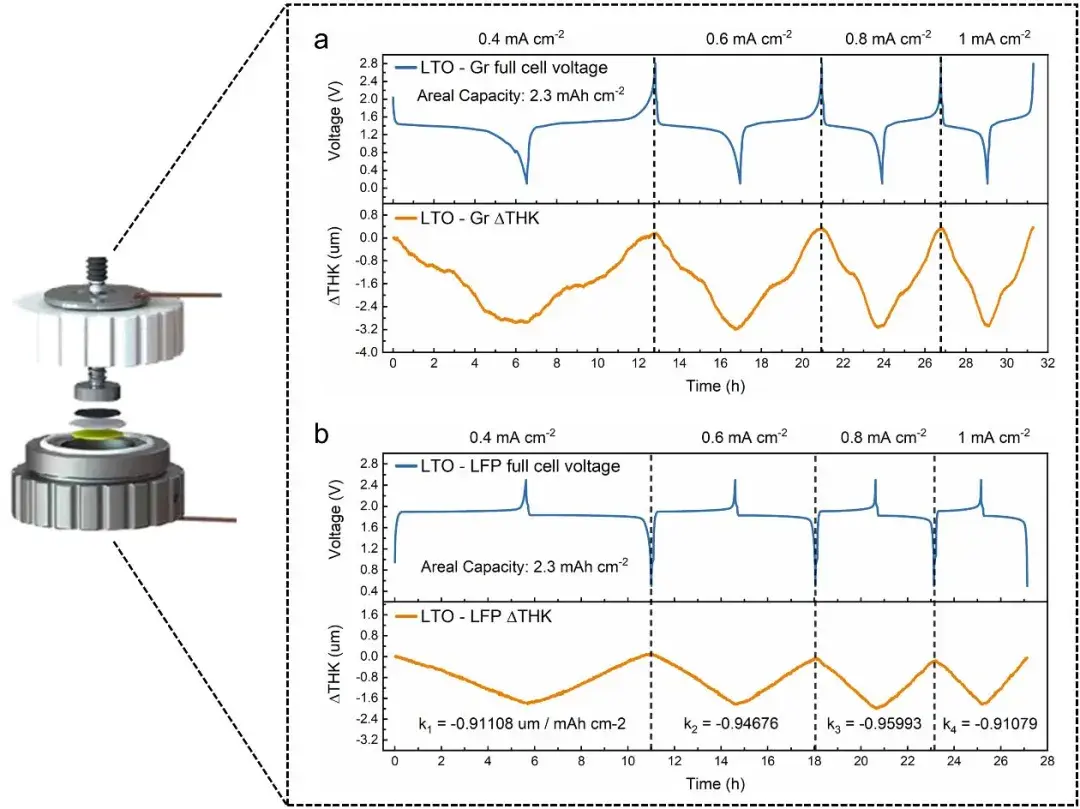
Figure 3. Decoupling of graphite and LiFePO₄ thickness expansion behaviors using LTO zero-strain reference assemblies, enabling accurate electrode-level thickness attribution during lithium plating experiments.
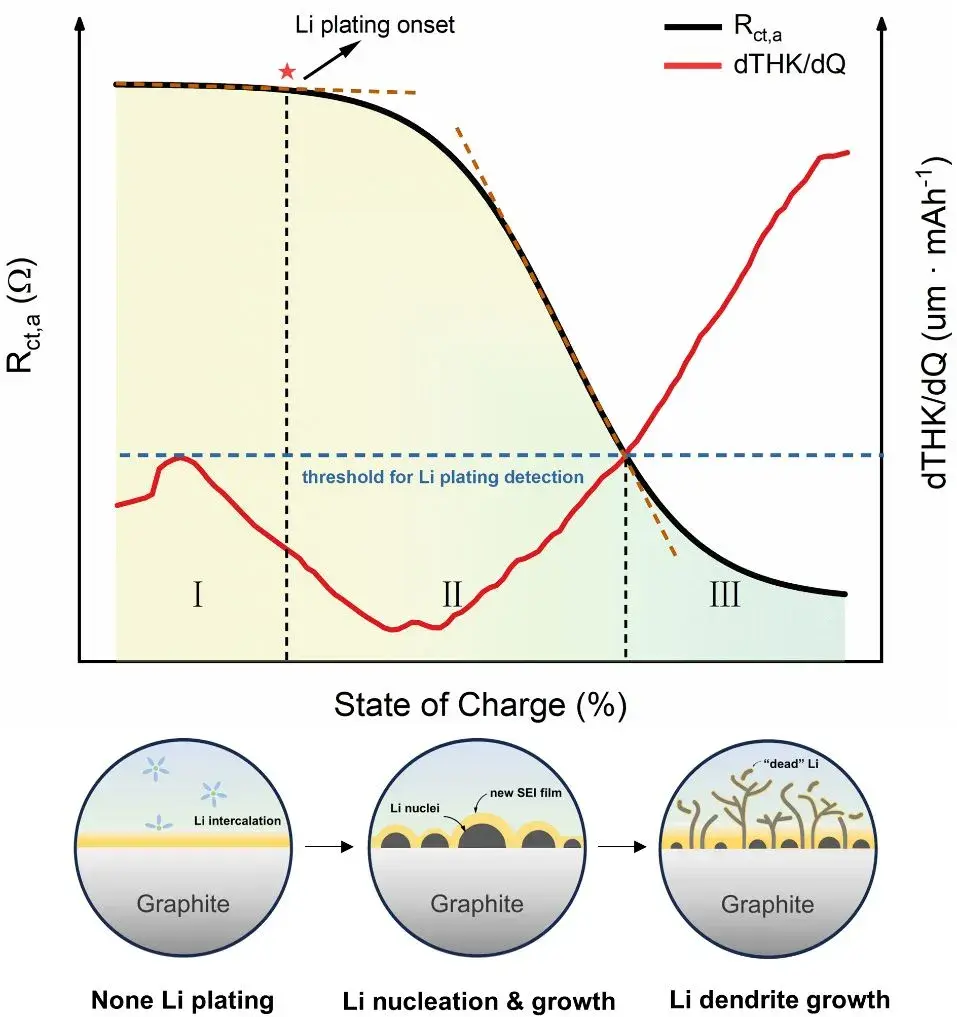
DEIS/DRT analysis of Rct,a revealed a reproducible three-stage profile under plating-prone conditions — low temperature (0°C) and high C-rate charging in commercial LFP pouch cells:
Stage I — Linear decrease:Rct,a decreases gradually, consistent with normal graphite lithiation kinetics. No Li deposits detected at this stage.
Stage II —Accelerated decline (nucleation/growth):Rct,a falls more rapidly. DRT indicates the emergence of a plating-related relaxation mode consistent with nascent Li nucleation and small aggregate growth on the graphite surface.
Stage III —Plateau (dendrite growth):Rct,a reaches a near-steady plateau despite continued charging, interpreted as a surface increasingly dominated by metallic Li coverage and dendritic morphology. The plateau reflects the transition from mixed insertion-plating to plating-dominated electrochemistry.
| Stage | Rct,a Behavior | Physical State | dT/dQ Signal | Capacity Impact |
|---|---|---|---|---|
| I — Graphite Lithiation | Linear decrease | Normal intercalation; no detectable metallic Li or SEI abnormalities | Below plating threshold | Minimal — reversible |
| II — Li Nucleation & Growth | Accelerated decline | Particulate/clustered Li deposits; early SEI organic growth (MST-quantified) | Approaching threshold | Moderate — active Li loss begins |
| III — Dendrite Growth | Near-steady plateau | Abundant metallic Li; thick SEI; dendritic morphology (SEM confirmed) | Exceeds threshold | Significant — dead Li, accelerated LLI, safety risk |
In conclusion, both impedance and thickness measurements can detect the process of lithium plating, but they provide different types of information and potential physical significance. They complement each other and cross-validate findings. Electrochemical information (Rct,a) and structural information (dT/dQ) together form multidimensional descriptors to accurately determine the state of lithium deposition, facilitating a more comprehensive understanding of the evolution process of lithium plating.
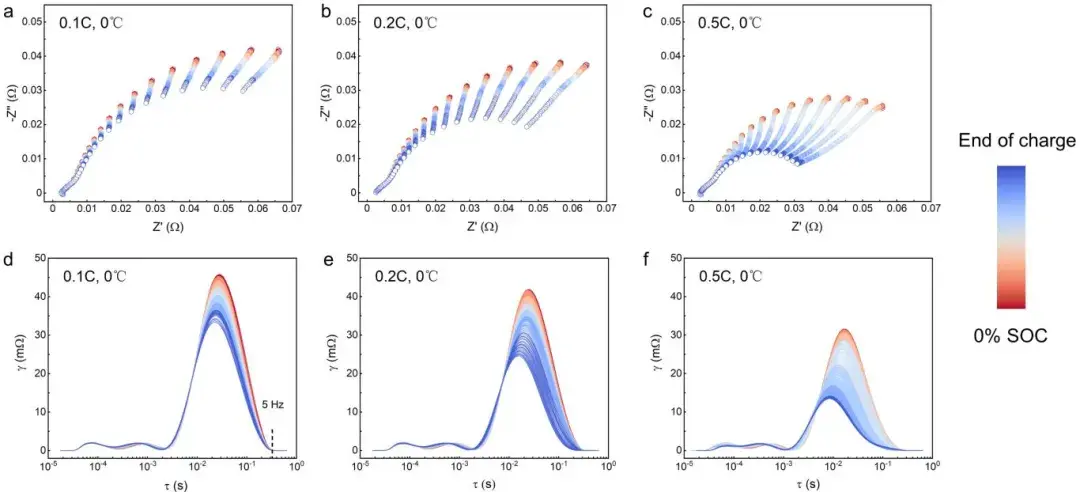
Figure 4. EIS Nyquist plot and DRT of LFP soft-pack batteries during charging at different C-rates, demonstrating how the three-stage lithium plating pattern emerges under more severe charging conditions.
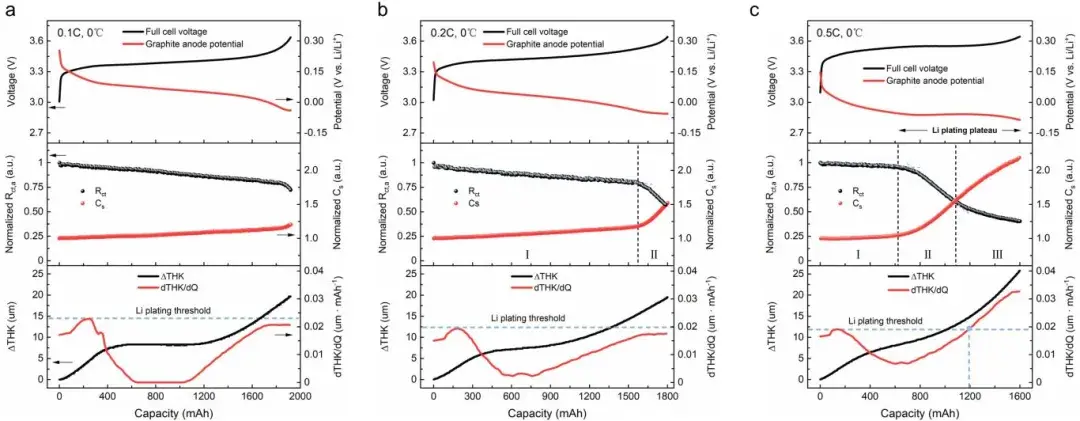
Figure 5. Cell voltage, negative electrode charge transfer resistance Rct,a/capacity, and thickness variation during lithium plating in LFP pouch cells — the three-stage pattern is visible across both electrochemical and mechanical signals.
At low rates (0.1C, 0.2C) and 0°C, dT/dQ remained below the empirically established plating threshold, consistent with no-plating classification by DEIS in most cases.
At 0.5C and higher SOC, dT/dQ exceeded the plating threshold after approximately 1,200 mAh of charge at 0°C — providing a macroscopic signature of extensive lithium accumulation consistent with Stage III.
DEIS detected lithium plating onset earlier than thickness methods, whereas dT/dQ better reflected the physical severity and bulk morphology of deposited lithium. The two modalities are complementary: electrochemical sensitivity (Rct,a) and structural sensitivity (dT/dQ) together enable more accurate staging than either method alone.
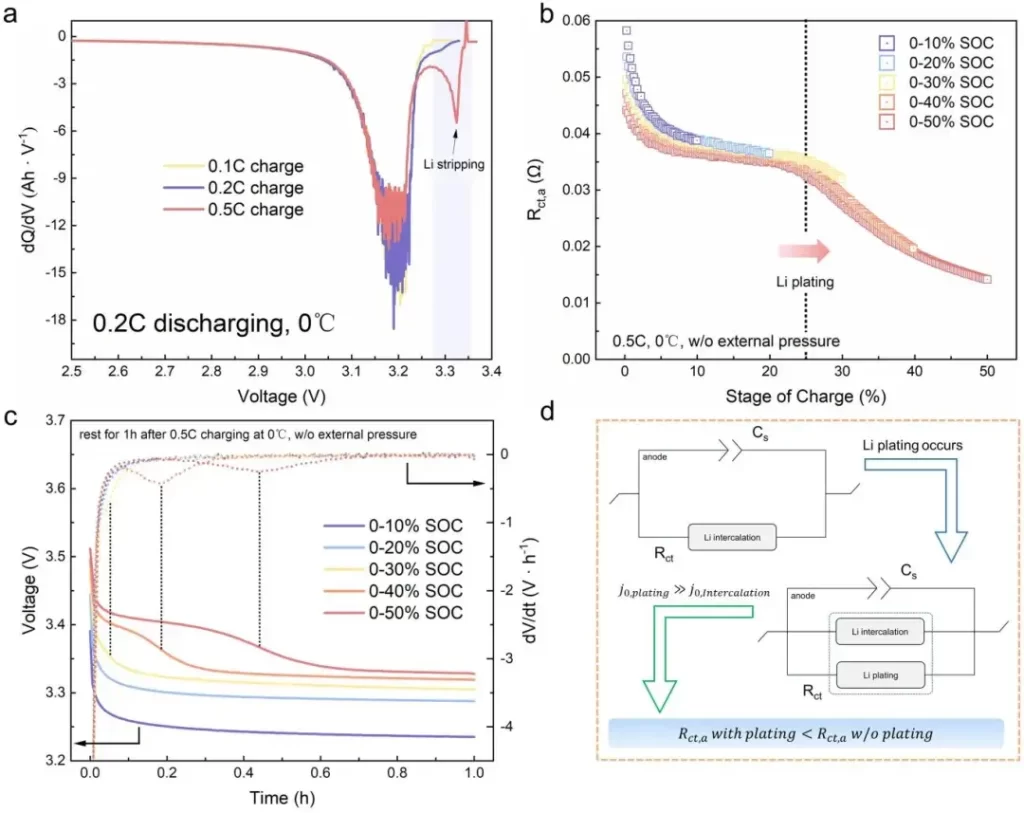
Figure 6. ICA (incremental capacity analysis) and dOCV (differential open circuit voltage relaxation) cross-validation of the DEIS method for lithium plating detection in LFP pouch cells.
MST and SEM analyses on cells disassembled at representative Rct,a stages confirmed direct correspondence between the electrochemical classification and physical lithium deposition state:
Stage I: No detectable metallic Li; normal SEI composition with no abnormal organic components.
Stage II: MST-quantified active Li deposits present; early SEI organic growth initiated; SEM reveals particulate and clustered deposits on the graphite surface.
Stage III: Abundant metallic Li and thick SEI layers confirmed; dendritic features observed by SEM; significant irreversible capacity loss attributed to dead lithium and extensive SEI formation.
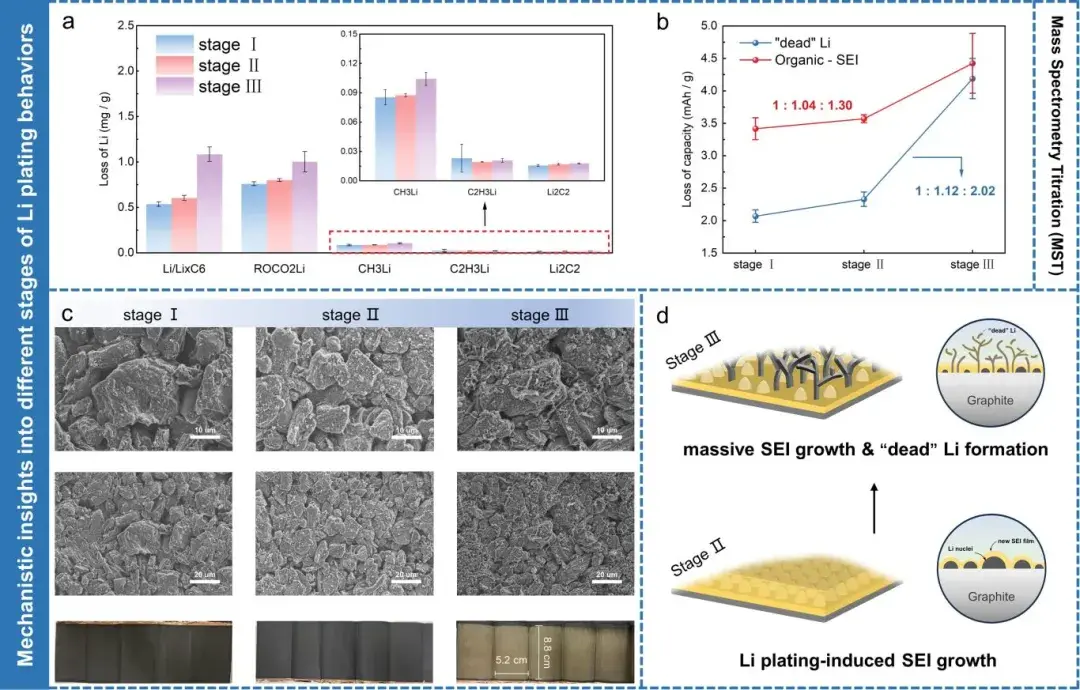
Figure 7. (a) Mass spectrometry titration results of graphite electrode sheets charged to three different stages of Rct,a variation. (b) Capacity loss attributed to “dead lithium” and different organic SEI components. (c) Scanning electron microscopy and optical images of three representative cells at different stages of Rct,a variation. (d) Schematic illustration of lithium plating behavior on graphite surface during Stages II/III of Rct,a variation.
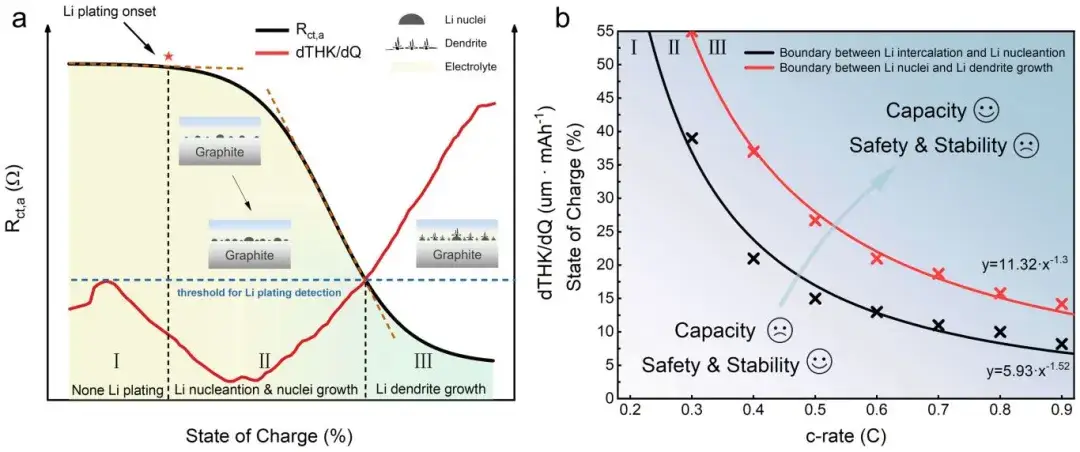
Figure 8. Schematic of the in-situ DEIS and thickness measurement method monitoring the lithium plating process in LFP pouch cells, with boundaries delineating Stage I, II, and III of lithium plating occurrence.
In continuous cycling experiments, Stage II and Stage III onset occurred at lower SOC in the second cycle compared to the first. The researchers attributed this to residual lithium on the graphite surface from the first discharge cycle — reducing the nucleation barrier for subsequent Li plating and thereby causing premature plating onset in later cycles. Three batteries were then cycled within SOC ranges corresponding to each plating stage. EMF-based analysis of SOH and Active Lithium Loss (LLI) confirmed that early onset of Stage II and III significantly accelerated capacity fade, with dendrite growth (Stage III) producing the most rapid and irreversible capacity loss. This underscores the critical importance of detailed analysis and monitoring of Li plating evolution processes to advance the application of lithium-ion batteries under extreme conditions.
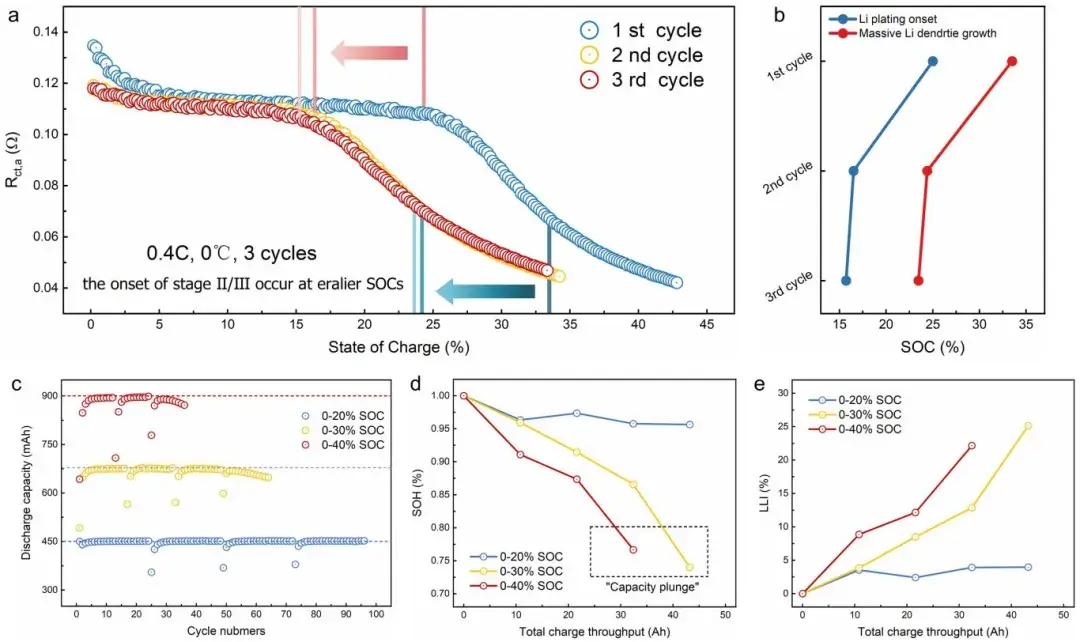
Figure 9. (a) Variation of Rct,a across three cycles, and (b) starting SOC of Stage II/Stage III during these cycles. (c) Discharge capacity variation with cycle number for three batteries cycled within different SOC ranges. Under equivalent total charge throughput, changes in (d) State of Health (SOH) and (e) Active Lithium Loss (LLI) of batteries.
DEIS (Rct,a) is highly sensitive to interfacial electrochemical changes and detects lithium plating initiation earlier than macroscopic thickness methods — making it directly applicable to early-warning BMS integration. In-situ thickness (dT/dQ) provides a robust measure of deposit volume and morphology that correlates with safety risk and irreversible capacity loss — more reflective of the physical severity of plating than impedance alone. Combining these modalities produces multidimensional descriptors (electrochemical + structural) that enable reliable staging of lithium plating and improved prognostics across fast-charging and low-temperature operating regimes.
Early detection: Dynamic EIS-derived Rct,a inflection signatures can serve as real-time precursors for adaptive BMS strategies — triggering dynamic charge current reduction or thermal management interventions before Stage II onset.
Stage-based thresholds: The Rct,a inflection boundaries mapped vs. C-rate and SOC define operational zones (safe graphite lithiation, nucleation risk, dendrite growth) directly useful for cell-level charge protocol optimization under LFP low-temperature charging conditions.
Aging management: Monitoring the cycle-to-cycle advancement of Stage II/III onset SOC provides a prognostic indicator of cumulative active lithium loss that can inform SOH models and maintenance schedules.
This work demonstrates a robust, in-situ methodology to detect, stage, and quantify lithium plating in commercial LFP pouch cells by combining DEIS (dynamic impedance via Rct,a) and high-precision thickness monitoring (IEST RSS1400, IEST SWE2100). The reproducible three-stage Rct,a evolution — (I) graphite lithiation, (II) Li nucleation/growth, (III) dendrite growth — corroborated by dT/dQ, MST, and SEM, provides a physically validated framework for staging lithium deposition in C/LFP cells. Without precise monitoring of lithium plating evolution states, Li plating can become uncontrollable, leading to rapid capacity degradation or catastrophic capacity drops. This work provides novel insights into the complex phenomenon of Li plating in commercial cells and contributes to the development of next-generation BMS strategies and potential applications involving graphite–lithium hybrid negative electrodes.
Ying Lin, Wenxuan Hu, Meifang Ding, Yonggang Hu, Yufan Peng, Jinding Liang, Yimin Wei, Ang Fu, Jianrong Lin, Yong Yang. Unveiling the Three Stages of Li Plating and Dynamic Evolution Processes in Pouch C/LiFePO₄ Batteries. Advanced Energy Materials. 2024, 2400894.
Lithium plating in LFP batteries refers to the deposition of metallic lithium on graphite anode surfaces instead of intercalation into the graphite lattice — a process that occurs primarily during fast charging or low-temperature operation when the lithiation rate exceeds the graphite’s intercalation capacity. Lithium plating is dangerous because: (1) deposited metallic Li forms “dead lithium” after electrical isolation, permanently consuming active lithium inventory; (2) repeated SEI rupture and regeneration on fresh plated surfaces consumes electrolyte and increases cell resistance; (3) dendritic lithium growth can penetrate the separator and cause internal short circuits, thermal runaway, and fire. A 2024 Advanced Energy Materials study from Xiamen University identified three reproducible stages of lithium plating evolution detectable by DEIS in commercial C/LFP pouch cells.
DEIS (Dynamic EIS) monitoring of the negative-electrode charge transfer resistance (Rct,a) reveals three reproducible stages in C/LFP pouch cells during fast or low-temperature charging. Stage I: Rct,a decreases linearly — normal graphite lithiation with no metallic Li deposits. Stage II: Rct,a declines acceleratedly — Li nucleation and growth begin; particulate deposits confirmed by SEM and MST. Stage III: Rct,a reaches a near-steady plateau — extensive dendritic lithium growth dominates; thick SEI forms; irreversible capacity loss (dead lithium + LLI) accelerates. Each stage boundary is validated by mass spectrometry titration (MST) and scanning electron microscopy (SEM) ex-situ analysis.
LFP battery charging below 0°C causes lithium plating because low temperatures substantially increase the charge transfer resistance (Rct,a) at the graphite anode, slowing Li-ion intercalation kinetics. When the applied charge current exceeds the rate at which Li ions can intercalate into graphite at sub-zero temperatures, Li ions instead deposit as metallic lithium on the graphite surface — initiating Stage II (nucleation) and, at higher C-rates or SOC, Stage III (dendrite growth). In the Xiamen University study, cells charged at 0.5C at 0°C showed dT/dQ exceeding the plating threshold after approximately 1,200 mAh of charge — a condition that would not cause plating at room temperature at the same C-rate.
Lithium plating in LFP batteries accelerates capacity fade through three interconnected mechanisms. First, metallic Li deposits that become electrically disconnected from the graphite (“dead lithium”) permanently remove active lithium from the electrochemical cycle — quantifiable as active lithium loss (LLI) using EMF-based analysis. Second, the repeated rupture and regeneration of SEI film on freshly exposed plated lithium surfaces consumes electrolyte and increases cell impedance. Third, the reduced nucleation barrier from residual plated lithium on the graphite surface causes Stage II and Stage III onset to advance to lower SOC in subsequent cycles — creating a self-reinforcing acceleration of degradation. Cells cycled within Stage III (dendrite growth) SOC ranges showed the fastest capacity loss and highest LLI among the three stage-based test groups in the Xiamen University study.
Yes. In-situ thickness measurement (quantified as dT/dQ — the derivative of cell thickness with respect to charge capacity) provides a macroscopic indicator of lithium plating in pouch cells. When lithium deposits on the graphite surface rather than intercalating, the cell thickness increases beyond the normal graphite expansion curve, producing a detectable dT/dQ anomaly that exceeds an empirically established plating threshold. However, DEIS (dynamic EIS) detects plating onset earlier than thickness methods. The IEST RSS1400 (0.1 µm resolution) and IEST SWE2100 (real-time thickness under controlled preload) systems were used in this study to provide thickness data complementary to DEIS impedance signals — together enabling more accurate lithium plating staging than either method alone.
