

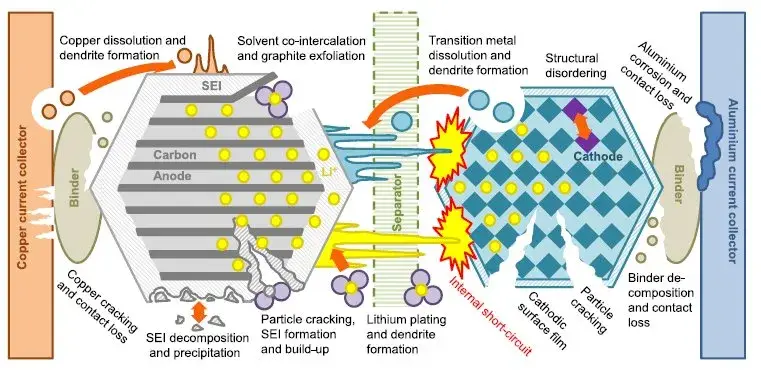
Figure 1. Causes of cell failure
In-situ swelling analyzer, model SWE2110 (IEST), which can apply a pressure range of 50~10000N.

Figure 2. Schematic diagram of the IEST in-situ swelling analyzer used for this differential voltage analysis study.
| Table 1. Information of Cell | |
|---|---|
| Capacity | 50.0Ah |
| Cathode | NCM811 |
| Anode | Graphite |
| Voltage | 2.5~4.25 |
| Size/mm | 12*100*200 |
The two largest surfaces of the cell were placed on cushion pads inside the test chamber of the in-situ swelling analyzer. Charge and discharge parameters: 25°C for 30 minutes; charge at 1.0C to cut-off current 0.05C; rest 30 minutes; discharge at 1.0C to a cut-off voltage of 2.5 V. The in-situ swelling analyzer was operated simultaneously in constant-pressure mode (50 kg), with the software automatically recording cell expansion thickness, expansion force, current, voltage, and capacity throughout cycling.
As the number of cycles increases, both capacity decay and cell thickness increase. As shown in Figure 3, charging thickness expands by 3.4% at the beginning of the cycle, discharge volume shrinks by 3.1%, and irreversible expansion is approximately 0.3% per cycle at this early stage. When capacity retention reaches 80%, maximum expansion thickness of the cell reaches approximately 20%, with the expansion curve increasing sharply as capacity decays sharply — a clear signal that thickness swelling and capacity decay are mechanistically linked rather than independent aging pathways.
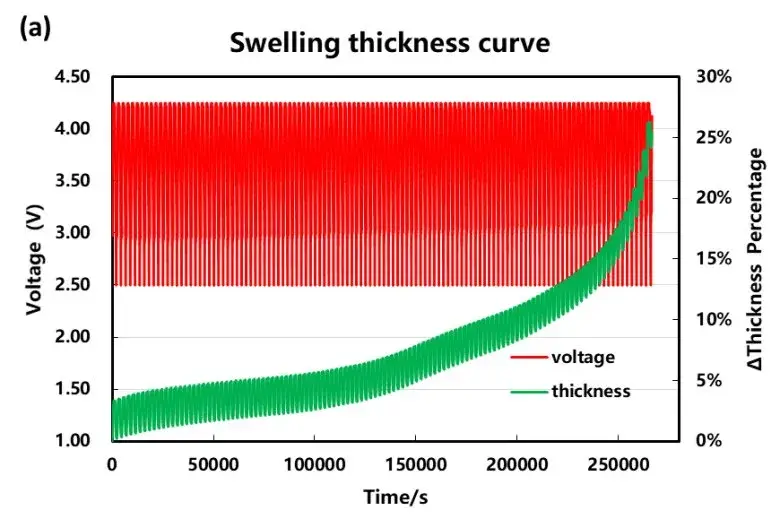
Figure 3. (a) Variation curve of charging and discharging voltage and swelling thickness.
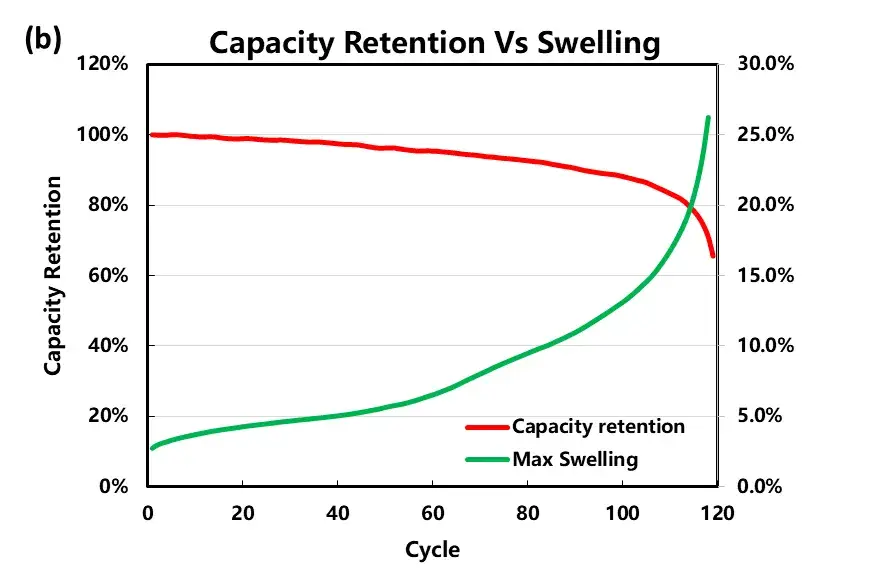
Figure 3. (b) Variation curve of charging capacity and charging maximum thickness.
For NCM/graphite cells, lithium ions intercalate into graphite to gradually form Li-C compounds including LiC₇₂, LiC₃₆, LiC₂₄, LiC₁₂, and LiC₆ — leading to expansion of the graphite lattice. The microscopic stress generated by this lattice expansion is the main driving force behind graphite anode thickness expansion. Electrodes are composed of active particles, binders, conductive additives, and the pores formed between them. Lattice expansion caused by lithium intercalation is accompanied by structural evolution of the binder and changes in the electrode’s porous structure — which in turn alter Li-ion transport, diffusion processes, and associated stresses in the electrode film during charging and discharging.
Cell thickness evolution can be divided into: (1) electrochemical expansion caused by the lithium intercalation/de-intercalation process; and (2) physical expansion caused by volume evolution of polymers (binders, dispersants) and electrode mechanical/structural changes. The lattice expansion process itself is reversible during lithiation and delithiation. However, continuous stress accumulation in graphite’s microscopic lattice expansion may cause material structure damage and mechanical cracks in the electrode, and mechanical or structural changes related to the electrode film are irreversible. The continuous increase in irreversible cell thickness therefore likely stems from several combined causes: electrode and material structure destruction, side reactions, and lithium precipitation.
To further analyze the cause of expansion, charging thickness change curves from different cycle numbers were compared after normalizing the horizontal axis to the initial cycle’s charging capacity (100%), with the vertical axis representing thickness expansion for each cycle (Figure 4). As cycle number increases, charging capacity continues to decrease, and after 110 cycles, the thickness expansion curve becomes distinctly different from earlier cycles — particularly at the later stage of charging, where the expansion curve’s slope increases significantly. This suggests that after 110 cycles, the cell has accumulated sufficient stress during charge-discharge cycling to cause irreversible mechanical damage, alongside side reactions such as lithium precipitation — causing the expansion rate to exceed the initial rate.
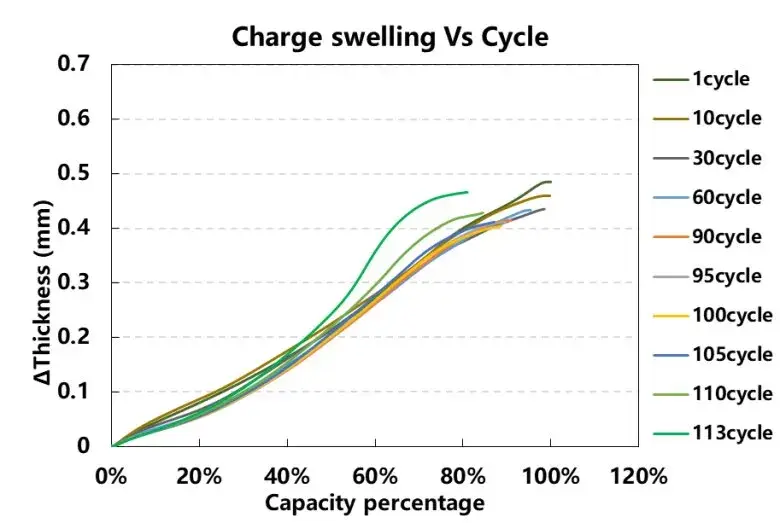
Figure 4. The change curve of the charging swelling force of each cycle of the battery cell
Differential capacity curves corresponding to different cycle numbers were analyzed (Figure 5). During charging, three characteristic peaks correspond to phase-transition transformation. As cycling increases, the voltage corresponding to each peak (Table 2) first decreases and then increases — meaning cell polarization first decreases, then increases. This indicates that applying external pressure to the cell can reduce polarization during early-cycle charging and discharging, but with continued accumulation of side reactions and lithium precipitation, polarization subsequently increases.
The intensity change of each peak (Table 2, Figure 6) shows an inconsistent ratio across the three characteristic peaks. This inconsistency in differential voltage analysis peak intensity is a key diagnostic finding: it indicates that cell cycling attenuation is not primarily due to structural damage of the active material itself, but is instead mainly driven by mechanical damage of the electrode and lithium plating caused by side reactions — a distinction that would not be visible from capacity-vs-cycle data alone.
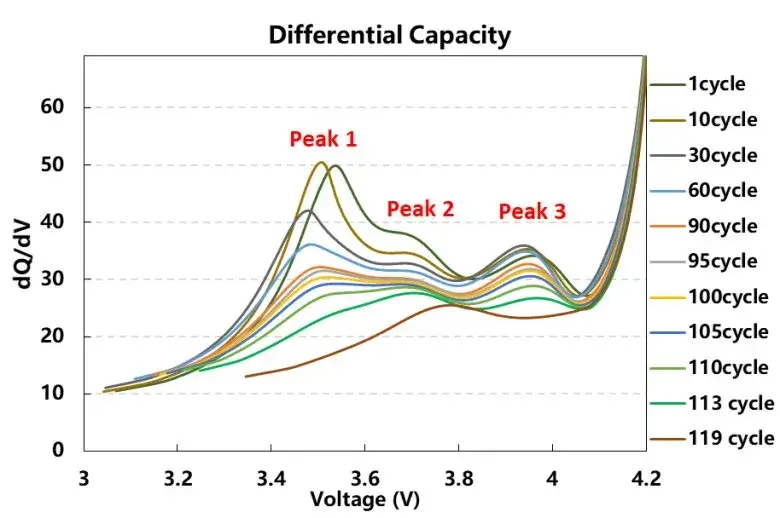
Figure 5. Differential voltage curve of cell charging swelling force.
| Cycle | Peak1 | Peak2 | Peak3 | |||
|---|---|---|---|---|---|---|
| Voltage (V) | dQ/dV-Intensity% | Voltage (V) | dQ/dV-Intensity% | Voltage (V) | dQ/dV-Intensity% | |
| 1 | 3.5343 | 100.0% | 3.7069 | 100.0% | 3.9738 | 100.0% |
| 10 | 3.5153 | 103.9% | 3.7053 | 89.0% | 3.9561 | 104.0% |
| 30 | 3.4858 | 86.9% | 3.7025 | 84.6% | 3.9471 | 105.9% |
| 60 | 3.4945 | 74.8% | 3.7044 | 81.1% | 3.9499 | 102.9% |
| 90 | 3.5072 | 66.8% | 3.7096 | 77.2% | 3.9558 | 96.5% |
| 95 | 3.5153 | 65.5% | 3.7106 | 76.8% | 3.9517 | 94.0% |
| 100 | 3.5212 | 63.1% | 3.7003 | 76.0% | 3.9598 | 92.9% |
| 105 | 3.5283 | 60.7% | 3.6873 | 74.0% | 3.9629 | 90.1% |
| 110 | 3.5292 | 57.1% | 3.6988 | 73.9% | 3.9670 | 85.2% |
| 113 | 3.5472 | 45.9% | 3.7059 | 71.5% | 3.9629 | 79.0% |
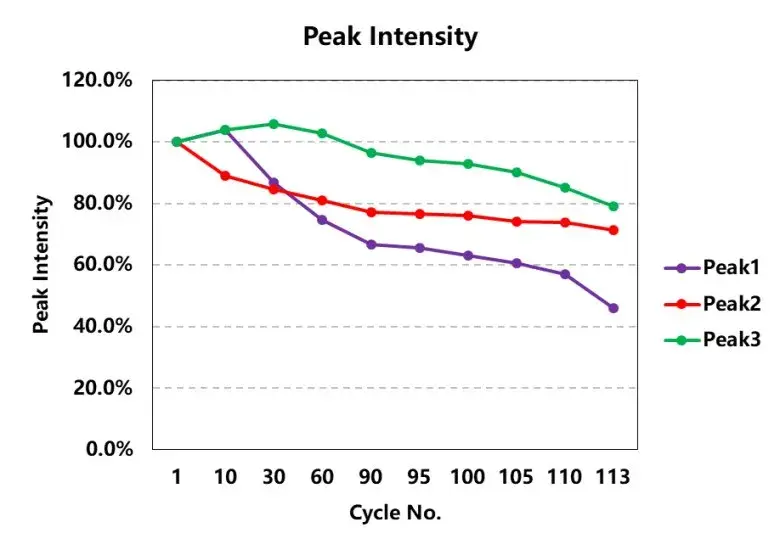
Figure 6. Trend chart of the peak intensity of each phase transition
| Parameter | Early Cycle | ~Cycle 110 Onward |
|---|---|---|
| Charging thickness expansion | 3.4% | Slope increases sharply |
| Discharge volume shrinkage | 3.1% | — |
| Irreversible expansion | ~0.3% | Accumulating faster |
| Maximum expansion thickness | — | ~20% at 80% capacity retention |
| Cell polarization (DVA peaks) | Decreasing | Increasing |
| Dominant degradation mechanism | Reversible lattice expansion | Mechanical damage + lithium plating |
This study used an in-situ swelling analyzer (SWE2110) to analyze the correlation between capacity decay and thickness swelling during long-cycling of NCM cells. Through combined analysis of cell swelling thickness data and differential voltage analysis / differential capacity analysis of the electrochemical data, the reasons for cycling degradation in this cell were identified as mechanical damage of the electrodes, lithium plating, and other side reactions — rather than fundamental structural degradation of the active material. This combined mechanical-electrochemical approach provides a more diagnostic view of capacity decay mechanisms than voltage-capacity data alone.
[1] Huang K L, Lyu Z Z, Liu S Q. On capacity fading and its mechanism for lithium-ion batteries[J]. Battery Bimonthly, 2001,31(3): 142-145.
[2] Wang Q Y, Wang S, Zhang J N, et al. Overview of the failure analysis of lithiumion batteries[J]. Energy Storage Science and Technology, 2017, 6(5): 1008-1025.
[3] Christoph R. Birkl, Matthew R. Roberts, Euan McTurk, Peter G. Bruce, David A. Howey, Degradation diagnostics for lithium ion cells,Journal of Power Sources 341 (2017) 373-386.
Differential voltage analysis (DVA) tracks the rate of voltage change with respect to capacity (dV/dQ) during charging or discharging, resolving distinct peaks that correspond to specific phase transitions in the electrode materials. For NCM/graphite cells, DVA reveals three characteristic peaks during charging. By tracking how the voltage position and intensity of these peaks shift across cycle life, DVA can distinguish between different degradation mechanisms — for example, an inconsistent intensity change ratio across peaks indicates mechanical electrode damage and lithium plating rather than structural degradation of the active material itself, a distinction that plain capacity-fade tracking cannot make.
Differential capacity analysis (DCA, dQ/dV) and differential voltage analysis (DVA, dV/dQ) are mathematically inverse representations of the same underlying voltage-capacity data, each emphasizing different features. DCA plots capacity derivative against voltage, producing sharp peaks at each phase transition that are useful for tracking active material loss and identifying specific electrode reactions. DVA plots voltage derivative against capacity, producing peaks whose position along the capacity axis shifts as active lithium inventory changes — making DVA particularly sensitive to lithium inventory loss and electrode balancing shifts. Using both together, as in this NCM/graphite cell study, provides complementary diagnostic power for identifying capacity decay mechanisms.
In this NCM/graphite pouch cell study, charging (lithiation) thickness expansion measured 3.4% at the beginning of cycle life, with discharge (delithiation) volume shrinkage of 3.1%, leaving approximately 0.3% irreversible expansion per early cycle. This expansion arises as lithium ions intercalate into graphite, forming a sequence of Li-C compounds (LiC₇₂, LiC₃₆, LiC₂₄, LiC₁₂, LiC₆) that progressively expand the graphite lattice. As cycling continues and capacity retention approaches 80%, maximum expansion thickness increases substantially to approximately 20% — reflecting accumulated irreversible mechanical damage superimposed on the normal reversible lattice expansion.
When normalized charging thickness curves from different cycles are overlaid, the expansion curve for this NCM/graphite cell shows a distinctly steeper slope after approximately 110 cycles, particularly during the later stage of charging. This is interpreted as evidence that the cell has accumulated sufficient internal stress during repeated charge-discharge cycling to cause irreversible mechanical damage to the electrode, combined with the onset of side reactions such as lithium precipitation (lithium plating). Both mechanisms increase the cell’s expansion rate beyond what reversible lattice expansion alone would produce, and this inflection point in the thickness-cycle data serves as an early, non-destructive indicator of accelerating degradation.
In this study, differential voltage analysis peak intensities changed with an inconsistent ratio across the three characteristic phase-transition peaks over cycle life. If capacity decay were driven primarily by structural degradation of the active material itself, all peaks would be expected to show a more consistent, proportional intensity decline. The inconsistent pattern observed instead points to mechanical damage of the electrode (from accumulated lattice-expansion stress) and lithium plating (from side reactions) as the dominant degradation mechanisms — a conclusion made possible specifically by combining in-situ thickness swelling measurement with differential voltage and differential capacity analysis, rather than relying on capacity-vs-cycle data alone.
