

To improve the volumetric energy density of lithium-ion batteries, researchers typically focus on two key strategies: (1) increasing the specific capacity of cathode and anode active materials; and (2) increasing the compaction density of the electrode sheets. Compaction density — also described as press density in powder characterization literature — is a material-level metric that directly determines how densely active material can be packed into a given electrode volume after calendaring.
The compaction density of an electrode powder is governed by the true density of the active material, its morphological characteristics, particle size distribution, and the manufacturing process. True density refers to the mass per unit volume of a solid material excluding internal pores or voids — an idealized packing state. In actual electrodes, interparticle voids are inevitable, and controlling porosity through applied calendaring pressure is essential to balance electrolyte wettability with efficient electron and ion transport.
Compaction density and true density often follow similar trends across material families, making compaction density a valuable metric for evaluating the physical properties of electrode materials and monitoring batch-to-batch consistency in production environments. For graphite anode materials, the Chinese national standard GB/T 24533-2019 specifies a pressure-relief-based method for compaction density measurement — reflecting the industry consensus that pressure-relief compaction density more accurately represents the electrode’s stress state after calendaring.
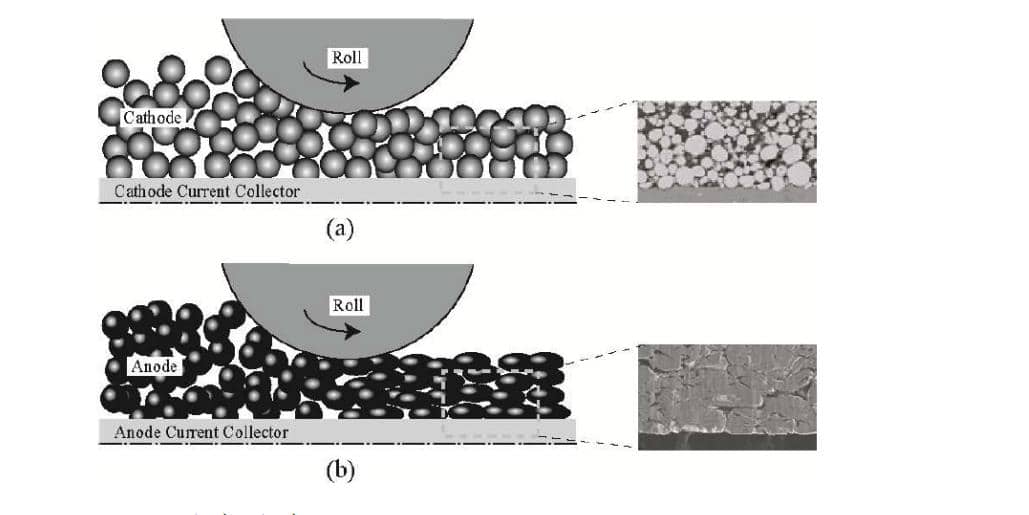
Figure 1. Schematic diagram of cathode and anode electrode plate rolling — particle packing changes before and after calendaring, illustrating why compaction density control is critical for high-energy-density electrodes.1
The compaction density of an electrode powder is calculated using the following formula:
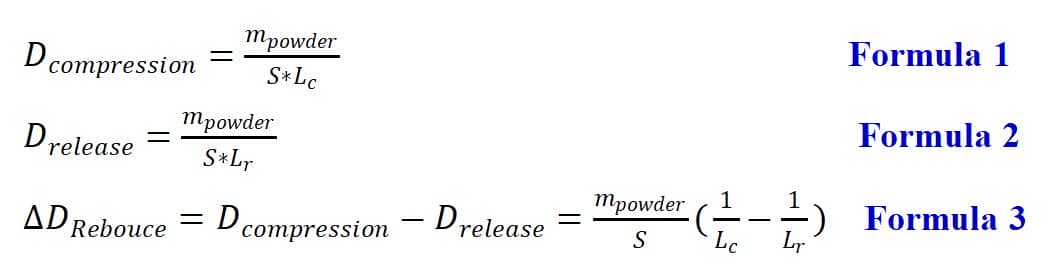
Where:
\(D\) = compaction density (g/cm\(^3\) or g/mL)
\(M\) = mass of the powder sample (g)
\(S\) = cross-sectional area of the containing fixture (cm\(^2\))
\(L\) = thickness of the powder under pressure (\(L_c\), pressurization value) or after pressure release (\(L_r\), pressure-relief value)
Two methods exist for measuring electrode powder compaction density:
Pressurization method (\(L_c\)): A defined pressure is applied to the powder and held for a set time, and thickness \(L_c\) is measured while under load. This represents the in-press state.
Pressure-relief method (\(L_r\)): After applying and holding the target pressure, the load is reduced to a lower residual pressure and held for a further period before measuring thickness \(L_r\). Due to elastic deformation of particles and inter-particle slip during pressure release, \(L_r\) is generally greater than \(L_c\) — meaning the pressure-relief compaction density is lower than the pressurization value. The difference between \(L_c\) and \(L_r\) quantifies the powder’s elastic rebound.
The pressure-relief method places powder particles in a stress state closer to that in a real calendared electrode, giving it better predictive value for manufacturing outcomes. The Chinese national standard GB/T 24533-2019 (“Graphite anode materials for lithium-ion batteries”) specifies a pressure-relief protocol for graphite anode compaction density measurement.2
Note that compaction density is distinct from — but related to — tap density (measured by mechanical tapping of loose powder without applied pressure) and true density (theoretical maximum density excluding all pores). Compaction density under defined pressure sits between tap density and true density, and is the most relevant metric for predicting calendared electrode volumetric energy density.
Accurate compaction density measurement requires careful instrument calibration and sample preparation. Recommended best practices for anode powder testing and cathode powder compaction measurements:
High-precision mass measurement: Use an analytical balance with resolution ≥ 0.0001 g for sample mass (M). Mass errors directly and proportionally bias the density result.
Thickness gauge resolution: Ensure the thickness sensor accuracy is ±5 µm or better. For high-rebound materials like graphite, sub-micron displacement sensors significantly improve repeatability of \(L_r\) measurement.
Prevent powder loss: Verify fixtures are sealed and powder does not escape during loading — mass and thickness errors compound directly into density error.
Consistent initial packing: Pre-condition samples using standardized vibration or gentle tamping so initial packing states are reproducible across replicates and operators.
The IEST PRCD1100 Powder Resistivity and Compaction Density Tester was used to measure the compaction density of five cathode and anode electrode materials, covering the full range from high-density oxide cathodes to low-density carbonaceous anodes.
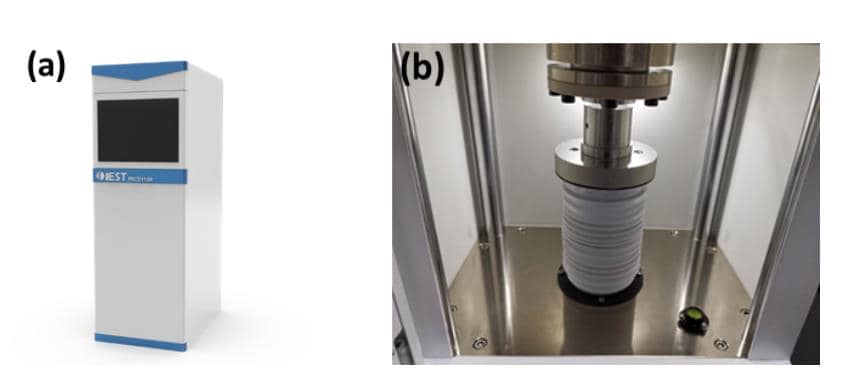
Figure 2. (a) Appearance of the IEST PRCD1100 powder resistivity and compaction density tester; (b) Internal structure of the PRCD1100 measurement fixture.
Lithium cobalt oxide (LCO) / ternary (NCM): 2.0000 g
Lithium iron phosphate (LFP) / graphite: 1.0000 g
Activated carbon: 0.5000 g
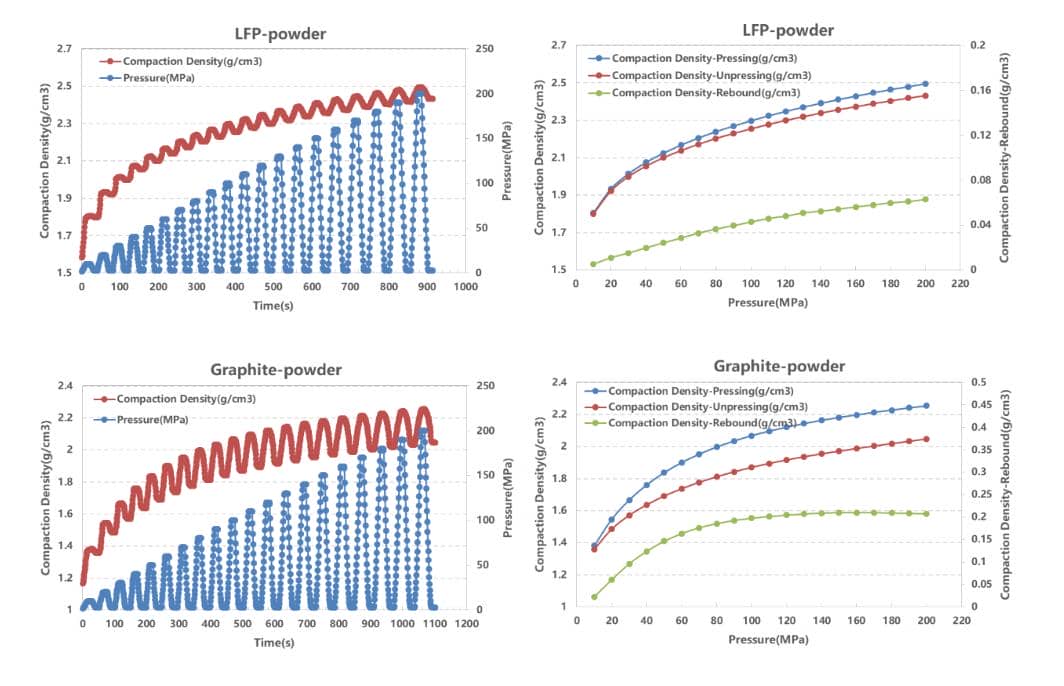
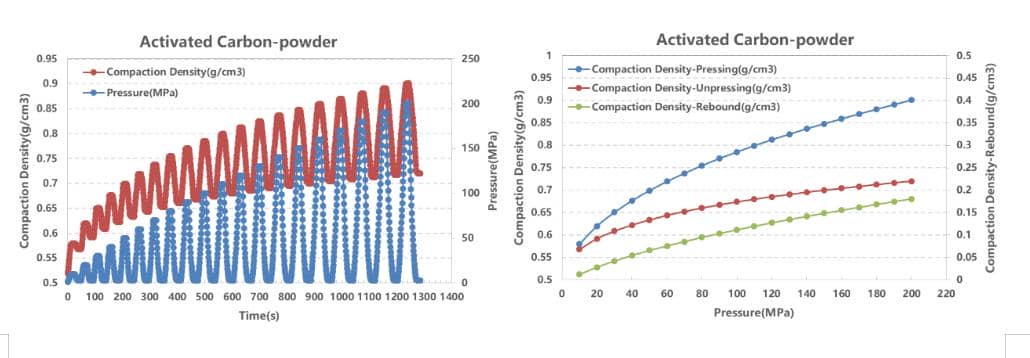
| Powder system | 200MPa Pressure | ||
|---|---|---|---|
| Compaction Density- Pressing (g/cm³) |
Compaction Density- Unpressing (g/cm³) |
Compaction Density- Rebound (g/cm³) |
|
| LCO | 4.2031 | 4.1188 | 0.0843 |
| NCM | 3.4435 | 3.3488 | 0.0947 |
| LFP | 2.4953 | 2.4324 | 0.0629 |
| Graphite | 2.2539 | 2.0468 | 0.2071 |
| Activated Carbon | 0.901 | 0.7203 | 0.1807 |
| Material | Compaction Density Rank | Rebound Rank (1 = most) | Crystal Structure | Rebound Mechanism |
|---|---|---|---|---|
| LCO (Cathode) | 1 — Highest | 5 — Least rebound | Layered Li-CoO2 | Rigid cobalt-oxygen framework limits elastic recovery |
| NCM (Cathode) | 2 | 3 — Moderate rebound | Layered Ni-Co-Mn oxide | Nickel content increases structural flexibility vs LCO |
| LFP (Cathode) | 3 | 4 — Very low rebound | Olivine Fe-PO4 | Stable 3D olivine structure; minimal elastic deformation |
| Graphite (Anode) | 4 | 1 — Highest rebound | Layered sp2 carbon | Interlayer sliding enables large elastic strain recovery |
| Activated Carbon (Anode) | 5 — Lowest | 2 — High rebound | Porous amorphous carbon | High porosity causes elastic springback upon pressure release |
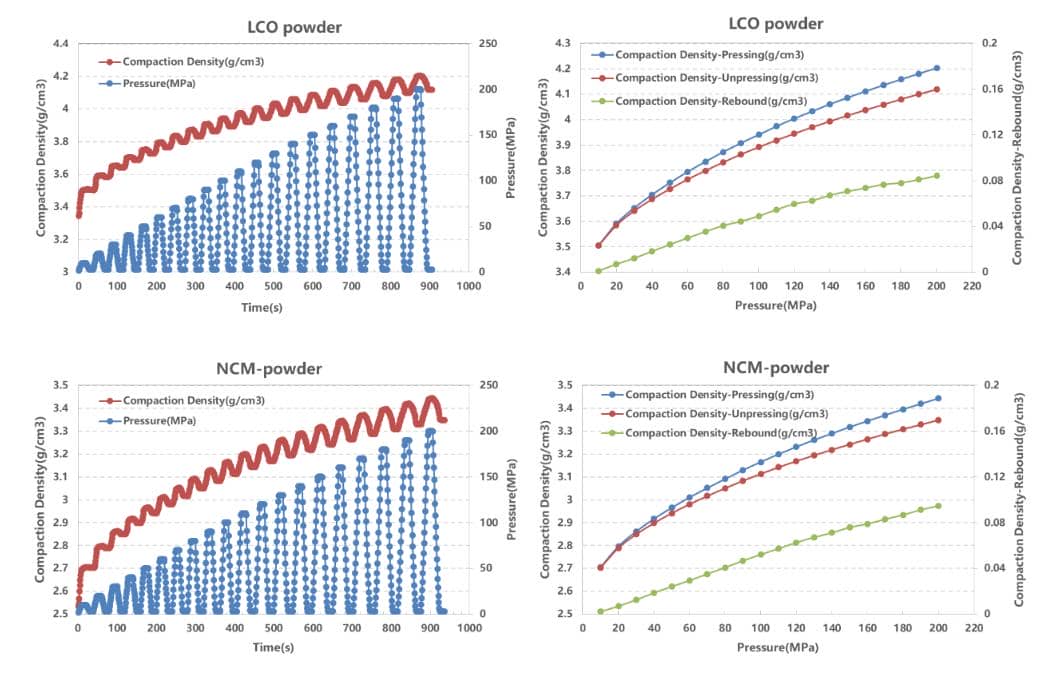
Compaction density follows the order: LCO > NCM > LFP > Graphite > Activated Carbon, consistent with the true density hierarchy of these materials. All five materials exhibited measurable rebound after pressure release, with the rebound order: Graphite > Activated Carbon > NCM > LCO > LFP.
The structure-rebound relationship is consistent with known material physics:
Graphite‘s layered sp² carbon structure allows inter-layer sliding under compression, enabling large elastic strain recovery upon pressure release — producing the highest rebound of all five materials tested.
NCM materials show greater elastic deformation than LCO due to structural differences influenced by nickel substitution in the layered oxide framework.
LFP‘s stable 3D olivine structure — comprising Fe-PO₄ tetrahedra and FeO₆ octahedra — is highly resistant to elastic deformation, resulting in the smallest rebound of any material tested. This makes LFP true density and LFP compaction density particularly close in value compared to other electrode chemistries.
These results confirm that both compaction density and rebound behavior are governed primarily by crystal structure, and secondarily by particle size distribution and morphology — a promising area for future optimization of high-energy electrode formulations.
Use pressure-relief compaction density protocols (GB/T 24533-2019) when optimizing calendaring conditions and predicting real electrode thickness after assembly. Pressurization-only values consistently overestimate achievable density in the final electrode.
Combine powder-level compaction density testing with anode thickness measurement on actual coated and calendared electrodes to close the loop between material properties and manufacturing outcomes — the gap between powder compaction density and electrode density reflects binder, conductive additive, and porosity contributions.
For high-energy anodes (e.g., silicon-graphite blends), evaluate rebound and fracture risk at multiple pressure points to avoid delamination or cracking during high-pressure calendering. Silicon’s high true density and silicon-graphite composites’ non-linear compaction behavior require dedicated pressure profiles.
Report full compaction test metadata with published data — sample mass, mold geometry, pressure profile, hold times, release pressure, and temperature — to enable inter-laboratory comparison and protocol reproducibility.
Compaction density — the key parameter linking electrode powder properties to cell volumetric energy density — must be measured with appropriate method selection, instrumentation precision, and test condition standardization. The pressure-relief method per GB/T 24533-2019 better represents real electrode stress states than the pressurization-only approach. Among the five electrode materials tested on the IEST PRCD1100, compaction density follows LCO > NCM > LFP > Graphite > Activated Carbon, while elastic rebound follows the inverse trend for anodes — with graphite’s layered structure driving the largest springback. Material-specific density and rebound characteristics must be accounted for when optimizing electrode calendaring parameters for high-energy lithium-ion cells.
[1] Sang Gun Lee, Dong Hyup Jeon. Effect of electrode compression on the wettability of lithium-ion batteries. Journal of Power Sources 265(2014) 363-369.
[2] 《Graphite anode materials for lithium ion batteries》GB/T 24533-2019.
Compaction density — also referred to as press density — is the mass per unit volume of an electrode powder measured under a defined applied pressure. It is calculated as D = M / (S × L), where M is the sample mass, S is the mold cross-sectional area, and L is the measured powder thickness at the target pressure (Lc, pressurization) or after pressure release (Lr, pressure-relief method). Compaction density is a key metric for evaluating how densely an active material can be packed into a battery electrode after calendaring, and directly determines achievable volumetric energy density in the final cell.
The pressurization method measures powder thickness Lc while the target pressure is still applied — representing the maximum achievable packing density under load. The pressure-relief method releases load to a lower residual pressure before measuring thickness Lr — the value after elastic springback. Because Lr is always greater than Lc (due to particle elastic recovery and inter-particle slip), the pressure-relief compaction density is lower than the pressurization value. The pressure-relief method more accurately represents the electrode’s actual stress state after calendaring and is specified by GB/T 24533-2019 for graphite anode powder testing. The difference between Lc and Lr quantifies the material’s elastic rebound — a critical parameter for calendaring process optimization.
Among five common battery electrode materials measured by pressure-relief compaction density testing (IEST PRCD1100, 10–200 MPa, GB/T 24533-2019 protocol), the compaction density order from highest to lowest is: LCO (lithium cobalt oxide) > NCM (ternary nickel-cobalt-manganese) > LFP > Graphite > Activated Carbon. This ranking correlates with the true density hierarchy of these materials. Elastic rebound after pressure release follows the reverse trend for carbons: Graphite > Activated Carbon > NCM > LCO > LFP — with graphite’s layered structure enabling the largest springback, and LFP’s stable olivine structure producing the smallest rebound of all materials tested.
Graphite’s higher compaction density rebound compared to LFP reflects the fundamental difference in their crystal structures. Graphite has a layered sp² carbon architecture in which individual graphene planes are held together by weak van der Waals forces — enabling significant inter-layer sliding during compression and elastic recovery upon pressure release. LFP has a 3D olivine crystal structure comprising Fe-PO₄ tetrahedra and FeO₆ octahedra covalently bonded in three dimensions, which is highly resistant to elastic deformation. As a result, LFP true density and LFP compaction density are closer in value than for graphite, and LFP electrodes exhibit more predictable thickness behavior after calendaring.
Compaction density directly determines how many grams of active material can be packed into a given electrode volume after calendaring. Higher compaction density means more active material per unit volume of electrode, which increases the volumetric energy density of the final cell. However, increasing compaction density also reduces electrode porosity — the void space that allows electrolyte to wet and access active particle surfaces. Excessive compaction can restrict electrolyte infiltration, increase Li-ion diffusion resistance, and reduce rate capability. The optimal compaction density therefore balances maximum material packing with sufficient porosity for electrolyte wettability and ionic transport — a trade-off that must be characterized material-by-material through combined compaction density testing and electrode-level performance evaluation.
