-
iestinstrument
Correlation Between Electrolyte Wettability And Electrode Tortuosity
1. Preface
In this paper, we explore the correlation between electrolyte wettability and electrode tortuosity by testing the tortuosity and wetting rate of electrodes with different compaction densities to provide some new methods for electrode design and optimization.
In the field of power batteries, due to the demand for lightweight vehicles and longer cruising range, higher energy density has become a key indicator of consumer concern, which puts forward higher requirements for the design of cell. Under the same chemical system, energy density can often be improved by optimizing the core design parameters, such as increasing the compaction density of the pole piece and optimizing the conductive agent and electrolyte formulations. However, the increase of compaction density will bring a series of problems, including the difficulty of electrolyte wetting. Without certain design optimization, the capacity and efficiency of the cell will be affected in the short term, and the cycle life and safety and reliability will be affected in the long term[1-3] , so the evaluation of the performance of the electrode becomes particularly important.
2. Test Conditions & Methods
2.1 Test Instrument
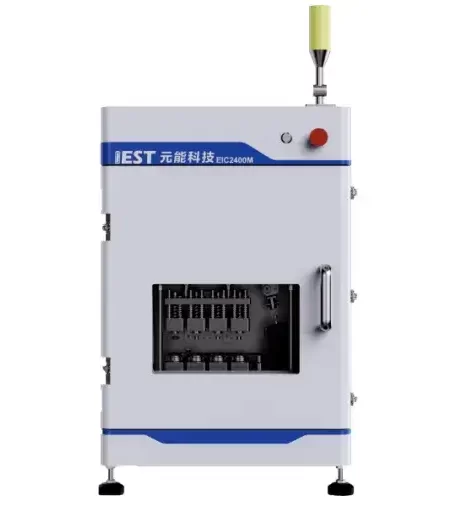
Electrode Tortuosity Tester: The multi-channel ionic conductivity test system (EIC2400M, IEST) developed by IEST is used as shown in Figure 1, which contains 4 test channels and can provide high-purity argon atmosphere to realize the electrochemical impedance spectrum test of multi-channel symmetric batteries. The pressure range is 10~50Kg and the frequency range is 100KHz~0.01Hz.
Figure 1. IEST Electrode Tortuosity Tester & Separator Ion Conductivity Tester(EIC Series)
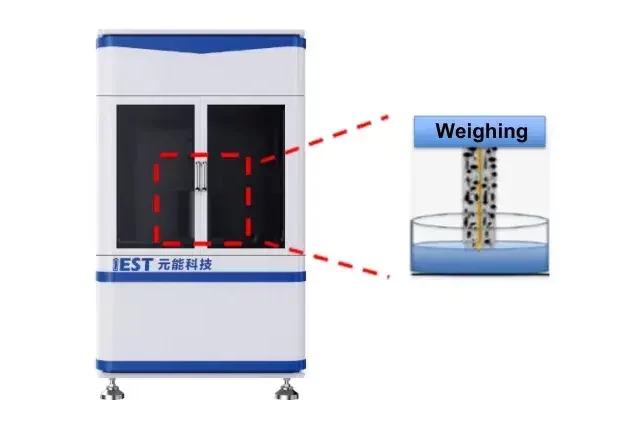
Electrode Electrolyte wettability Testing: IEST’s self-developed electrolyte wettability test system (ETS1000, IEST) is shown in Figure 2, which is equipped with a high-precision weighing system to characterize the electrolyte wettability rate of the electrode in-situ, and to explore the wettability effect of different electrodes. At the same time, it can also carry out bare cell wetting effect test, liquid retention amount test, and so on.
Figure 2. Electrolyte Wettability Test System(EWS)
2.2 Test samples
Lithium iron phosphate cathode wafers with different compression densities, the size of compression densities are A<B<C.
2.3 Test procedure
Electrode tortuosity test: put the sample into the jig in the order of electrode – diaphragm – electrode → close the door of the equipment warehouse, vacuum the inner cavity – charge high purity argon gas to remove the water in the inner cavity → quantitatively inject the liquid into each channel → after reaching the infiltration time, automatically test the EIS → finally get the flexure of the electrode through the fitting and calculation of the software.
Electrode Electrolyte wettability Test: place the pole piece on the hook in the cavity of the equipment, then immerse the bottom of the pole piece into the electrolyte about 5mm, record the change of the weight of the pole piece with the time, test time 900s. finally fit the data linearly to get the infiltration K value.
2.4 Calculation method
MacMullin number calculation method:

Where: τ is the tortuosity; Rion is the ionic resistance; A is the area of the electrode; ε is the porosity of the pole piece; σ is the conductivity of the electrolyte; and d is the thickness of the electrode. Due to the complexity of the test method for the porosity of the electrode, the ratio of the curvature and porosity, i.e., MacMullin number (Nm = τ / ε), is usually used to characterize the curvature of the electrode, as shown in equation (2).

The impedance of the symmetric cell was tested using an electrochemical workstation and the EIS obtained is shown in Figure 3. The low-frequency line segment in the Nyquist plot is extended until it intersects with the X-axis, and three times the difference between this intersection point and the intersection point of the high-frequency line segment and the X-axis is the ionic impedance Rion of the pole coating. The MacMullin number of the electrode coating can be obtained by substituting the fitted ionic impedance Rion into Equation (2) to calculate the MacMullin number of the electrode coating, which can be used to analyze the tortuosity degree of the electrode coating.
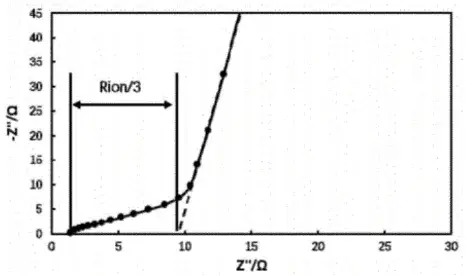
Figure 3. Electrochemical impedance spectra of symmetric cells
Method of calculating the wettability coefficient:
The infiltration process of the electrode in the electrolyte can be understood as the capillary absorption effect. The Lucas – Washburn infiltration model is usually used to describe the kinetics of liquid absorption by the capillary effect of the electrode, as shown in Equation (3):

Where h is the suction height, t is the suction time, c is the shape coefficient corresponding to capillaries with different voids, r is the capillary radius, cr is a constant value called the form radius, σ is the surface tension of the liquid, and η is the liquid viscosity. From the formula, it can be seen that the square of the liquid infiltration height h is proportional to the suction time t. The ratio of h and √t, K, is defined as the infiltration rate (Eq. (4)). The relationship between the weight of the electrode during the infiltration process with respect to time is also in accordance with the above equation.
3. Results Analysis
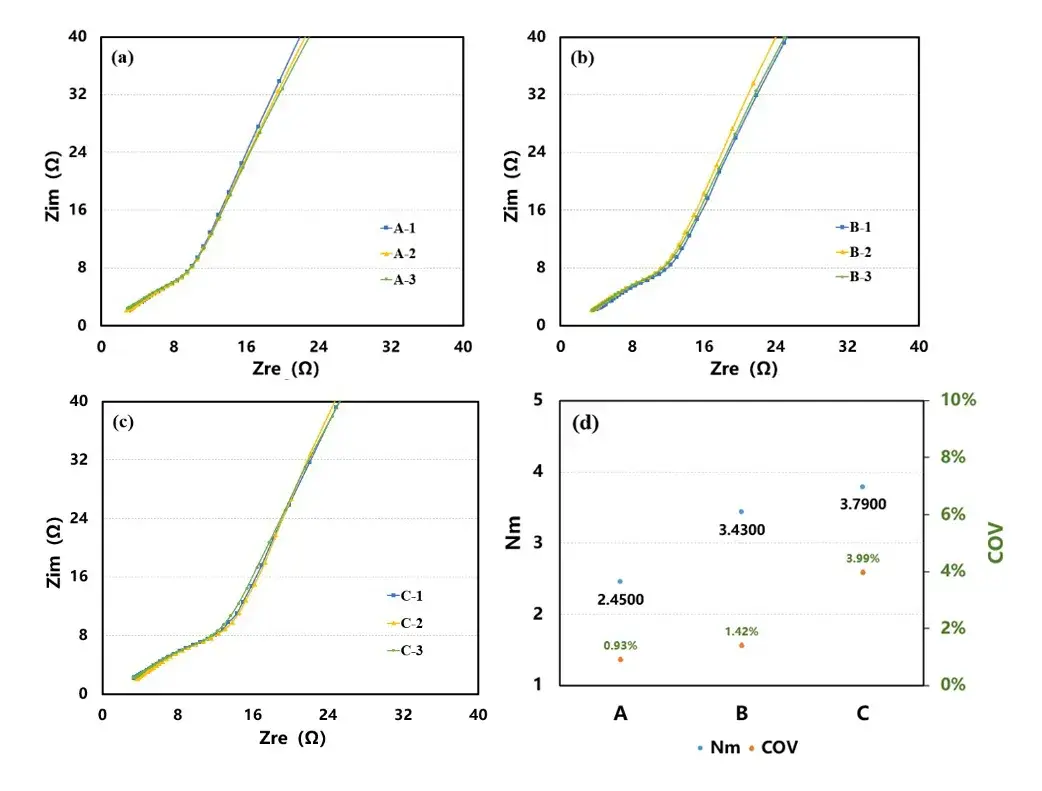
Figure 4. Nyquist plots of symmetric cells with different pressure-tight positive wafers A (a) ; B (b) ; C (c) and MacMullin number obtained by fitting (d)
The electrochemical impedance spectroscopy (EIS) test was carried out on the symmetric cell assembled with different compression densities of anode wafers, and the results are shown in Figure 4. The ionic resistance of each pole piece was obtained by fitting the EIS spectra, and then the ionic resistance value was substituted into Eq. (2) to obtain the electrode McMullin number, as shown in Figure 4(d). The trend of the data shows that the ionic resistance and MacMullin number increase with the increase of the electrode pressure density.
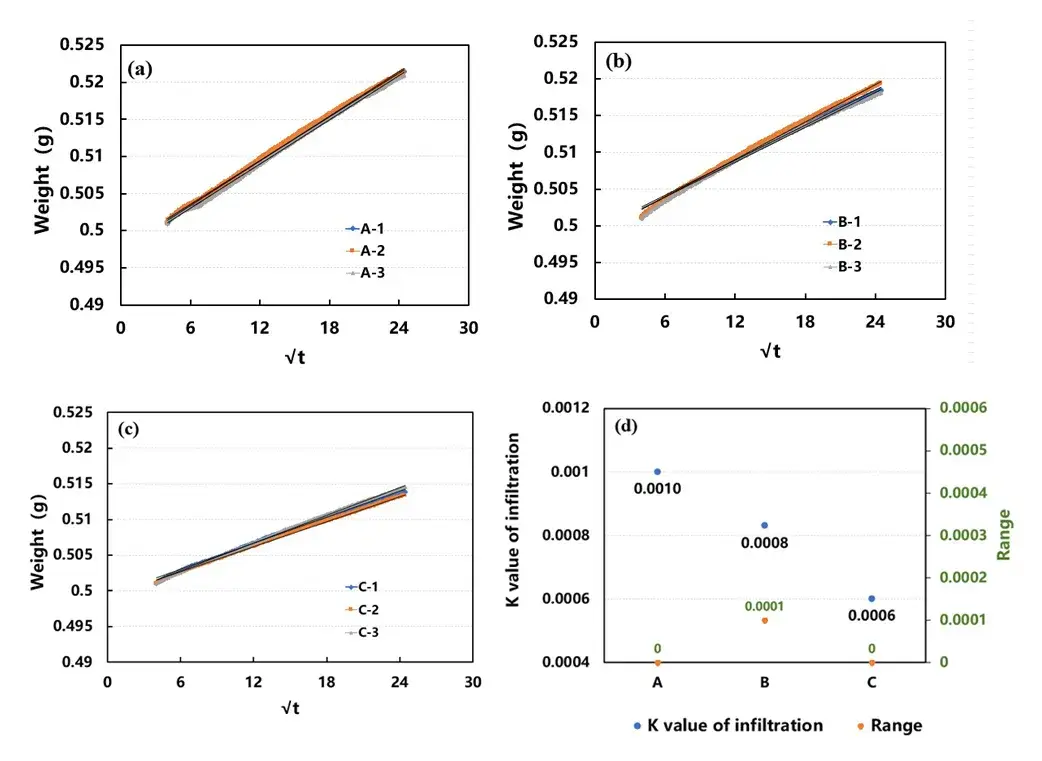
Figure 5. Curves A (a) ; B (b) ; C (c) and fitted K values (d) of weight versus time during infiltration of different compacted cathode wafers
Figure 5 shows the electrolyte wettability curves of three kinds of electrodes, A, B and C. Linear fitting of the curves to obtain the corresponding K values, as shown in Figure 5 (d), it can be found that the slope of the electrolyte wettability curves of the electrodes decreases with the increase of the compaction density, i.e., the larger the compaction density, the worse the wettability.
Combined with the electrode curvature and wettability test results found that the worse the wettability effect of the electrode curvature is larger, indicating that with the increase in the compaction density, the contact between the particles and the conductive agent particles is more dense, and the performance of the electrolyte absorption becomes worse, and it is difficult to electrolyte wettability, which makes it more difficult for lithium ions to migrate, and increases the ion transmission impedance, which results in the increase of the curvature of the electrode. This experiment shows that the electrolyte wetting effect of the electrode is an important factor affecting the degree of curvature.
4. Summary
In this paper, the curvature and electrolyte wettability rate of lithium iron phosphate cathode wafers with different compaction densities were tested, and the experimental data showed that electrolyte wettability is an important factor affecting the curvature of electrode wafers with different compaction densities. Generally speaking, within the allowable compaction range of the material, the higher the compaction density of the electrode, the more active material can be accommodated in the unit volume, and the higher the capacity of the battery can be made. However, when the compaction of the pole piece is too high, the porosity decreases, the greater the curvature, the longer the lithium ion transport path, which will seriously reduce the multiplicity performance and cycle performance of the battery. Therefore, compaction density is very important for battery design. We can characterize the performance of the cell initially through the flexure and infiltration tests to determine the appropriate cell design.
5. References
[1] HENG Hai-Ning,CAO Lian. Study on the electrolyte infiltration rate of lithium battery electrodes[J]. Power Supply Technology, 2022,46:500-503.
[2] SUO L M, HU Y S, LI H, et al. A new class of solvent-in-salt electrolyte for high-energy rechargeable metallic lithium batteries [J]. Nature Communications, 2013, 4: 1481.
[3] KNOCHEA T, SUREKA F, REINHARTA G. A process model for the electrolyte filling of lithium-ion batteries [J]. Procedia CIRP, 2016, 31: 405-410.
Subscribe Us
Contact Us
If you are interested in our products and want to know more details, please leave a message here, we will reply you as soon as we can.


