-
iestinstrument
Comparative Analysis of Electrode Resistance Testing: Two Probe and Four Probe Methods
1. Introduction
The electrode sheet plays a critical role in lithium-ion battery production, directly influencing battery stability, safety, and performance. Evaluating electrode sheet resistance is essential for understanding the conductivity of electrode materials and optimizing the manufacturing process.
Several methods are widely used to measure electrode resistance, including the single probe method, two probe method, four probe method, and multi-probe configurations. Among them, the 2 probe method and the 4 probe method are the most commonly applied techniques in battery research and industrial testing.
This article compares the principles, advantages, and limitations of these testing methods, with a particular focus on the 2 probe vs 4 probe for measuring electrode resistivity.
2. Experimental Equipment and Test Methods
2.1 Experimental Equipment
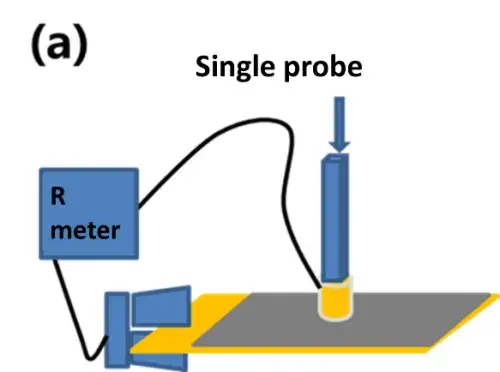
The single probe device, as shown in Figure 1 (a), and the device for the two probes is as shown in Figure 1 (b).
 |
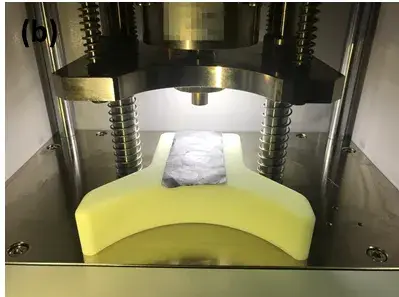 |
Figure 1. (a) Single-probe method device (b) Structural diagram of the two probe method
2.2 Test Method
The single probe method applies one contact terminal directly to the sample. However, variations in pressure lead to large measurement fluctuations. By contrast, the two probe method fixes both probes under a controlled pressure system, improving measurement accuracy.
Data such as electrode thickness, resistance, resistivity, and conductivity can be automatically recorded with modern software-controlled test equipment.
3. Results and Comparative Data
3.1 Resistance Comparison of Single Probe Pressure Control and Uncontrolled Pressure Test
Take aluminum foil, copper foil, anode, cathode with two different single probe device test 10 sets of data, it can be seen from the figure, simple single probe method whether test foil or electrode resistance, the COV value is greater than the controllable pressure, the maximum of more than 60%, the test resistance volatility is large, this is because the simple device single probe cannot fix the pressure, each test contact resistance is different, so the test error is greater than the controlled pressure device.
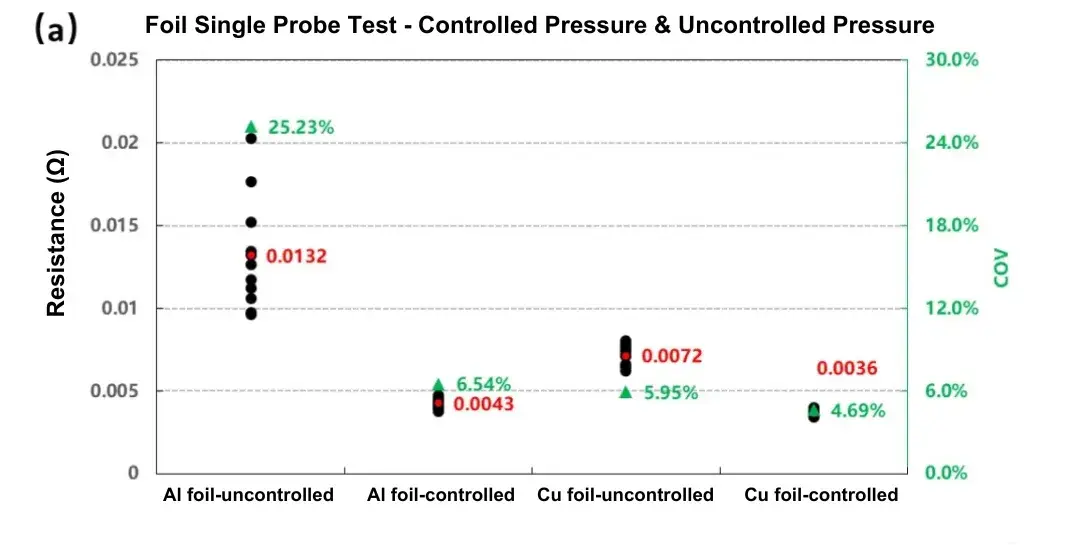
Figure 2. (a) Single probe – foil pressure control and uncontrolled Resistance Comparison
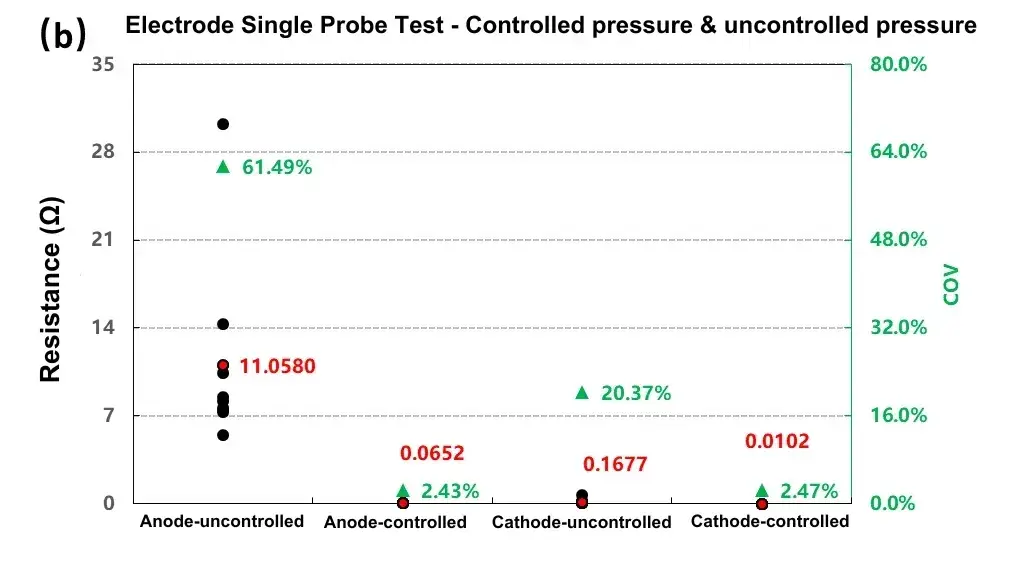
Figure 2. (b) Single probe – pressure control and uncontrolled electrode resistance comparison
3.2 Comparative analysis of the resistivity of the test samples by single-probe method, two probe method and four probe method of controllable pressure.
Using pressure-controlled single probe, two probe method, and four probe method, ten measurements each were taken for aluminum foil, copper foil, anode, and cathode samples. Results indicate the following order of resistivity values:
single probe > two probe method > four probe method
This trend holds for both foil and electrode materials.
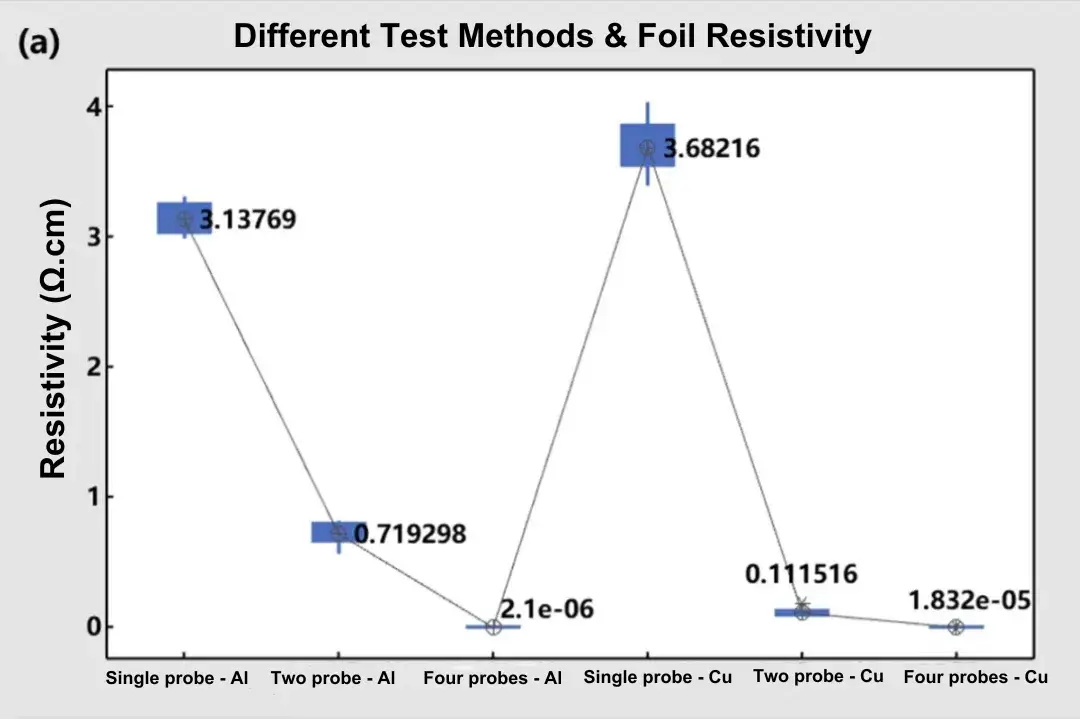
Figure 3. (a) Comparison of resistivity of foils with different test methods
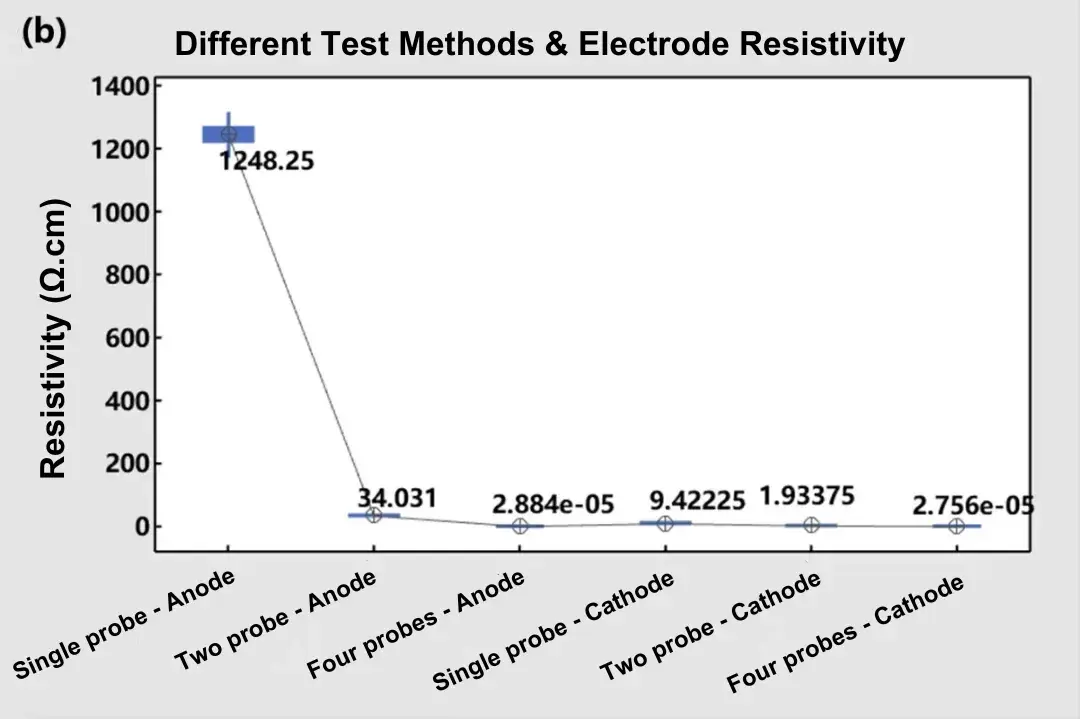
Figure 4. (b) Comparison of resistivity of electrodes with different test methods
The discrepancy arises from differences in contact resistance and electron transmission paths across methods. In the single probe method, electrons pass through the coating, the coating–current collector interface, and laterally along the foil. The two probe method includes an additional lateral conduction component. The four probe method uses separate current and voltage electrodes, effectively eliminating lead and contact resistance, thus providing the lowest absolute resistivity value.

Figure 5. Schematic of the three measurement methods
4. Test Principle Analysis
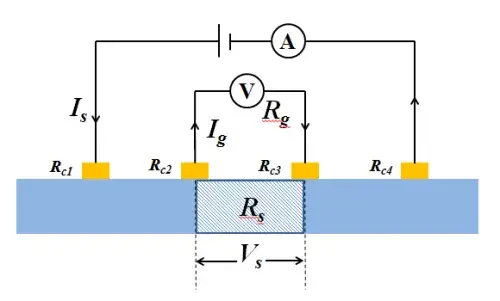
Figure 6. Schematic diagram of the four probes method test
Figure 5 shows a schematic diagram of the test resistance by the four probe method, assuming that the contact resistance of the four-terminal wiring and the probe are Rc1, Rc2, Rc3, and Rc4, respectively; the constant current source applies current Is (ammeter reading) to the sample through terminals # 1 and 4 #. If the resistance in the voltmeter is Rg, the voltmeter branch current is Ig, and the voltmeter voltage reading is Vg= Rg * Ig; the measured resistance between terminals 2 # and 3 # is Rs, then the measured resistance branch current is Is-I g, and the voltage of the measured resistance is V s; then:
Calculated by the voltmeter branch, the voltage between terminals 2 # and 3 # is:

Calculated by the resistance branch to be measured, the voltage between terminals 2 # and 3 # can also be expressed as:

At this point, if there is Rg + Rc2 + Rc3>> Rs, then Is>> Ig, then Is Is-Ig, If Rg>> Rc2 + Rc3, there is V s Ig * Rg=Vg.
Then, the resistance is R =Vg / Is V s / (Is-Ig) =Rs that is calculated from the current and voltmeter readings. Therefore, the resistance calculated according to the current and voltmeter reading is almost equal to the actual measured resistance value, which is equivalent to testing the absolute resistance value of the sample to be tested. The resistivity of the material was then calculated based on the size specification of the probe and the test sample size.
In summary, the separate current and voltage electrodes used in the four probe method eliminate the impedance of the wiring and the probe contact resistance. The key is that the resistance in the voltmeter is large enough, so that the branch current and the pressure drop of the line contact terminal can be ignored. The two probes for the voltage detection must be separated from the current source two probes. For the connection between the two probes for the voltage detection, all the main loop resistance between the two points will be included in the measured resistance. However, if the resistance of the sample to be tested is very large, it may be difficult to ensure that the resistance in the voltmeter is much greater than the sample to be tested, and that is, Rg + Rc2 + Rc3>> Rs may not be true, and the measurement results may have a large error.
Therefore, the four probe method is often used to determine the absolute value of the electronic conductance of the battery electrode sheet because it eliminates the contact resistance between the probe and the sample (the compacted sheet or coating). Most four probe methods choose to coat the slurry of the electrode material with a thin layer or an appropriate thickness on the insulation substrate, rather than the fluid-collecting material such as aluminum foil. This coating on the insulating substrate is designed to avoid tributaries in the substrate direction, thus accurately test the resistance of the electrode material. If the substrate is a fluid collector, the resistance of the coating, by adjusting the probe distance. However, the electrode coating in practical battery application is relatively thick (60~150 m), and the four-probe method only obtains part of the resistance contribution of the coating, while ignoring the coating gradient of the electrode, and cannot comprehensively represent the resistance value of the electrode. Moreover, the direction of the current transmission is parallel to the coating, which is different from the current transmission direction of the vertical coating in the actual battery, and the interface resistance of the substrate and the coating is also ignored, rather than the real situation of the polar sheet. And two probe method because the test results include probe, probe and coating contact resistance, so unable to measure the absolute value of electrode resistivity, and loading pressure and current test parameters affect the results, for high resistance of positive electrode, small load current can get stable results, and for low resistance of graphite electrode or foil, loading current is relatively high to get stable results. If the loading pressure increases and the resistivity of the foil or electrode decreases, the test results can be independent of the pressure. However, it contains some advantages: the electron conduction path of the test process is basically the same as that in the actual battery application. A total test value includes the electron conduction characteristics of the fluid collector, the fluid collector and the coating interface and each part of the coating itself, which can quickly study the influence of the formula and process on the resistivity of the electrode sheet.
5. Summary
In this paper, by exploring the variability of the resistance of samples tested by the single-probe method with and without pressure control, it is found that the pressure has a significant effect on the stability of the resistance data, so the testers must pay attention to the size and stability of the test pressure. Comparison of the three principles of the test method to test the variability of the sample resistivity, found that the absolute value of the resistance measured by the difference is large. For practical electrode applications and operational convenience, the two-point probe is recommended for evaluating through-thickness electrode resistance. It enables efficient study of how formulation and processing affect electrode sheet resistance.
6. IEST Related Test Equipment Recommendation
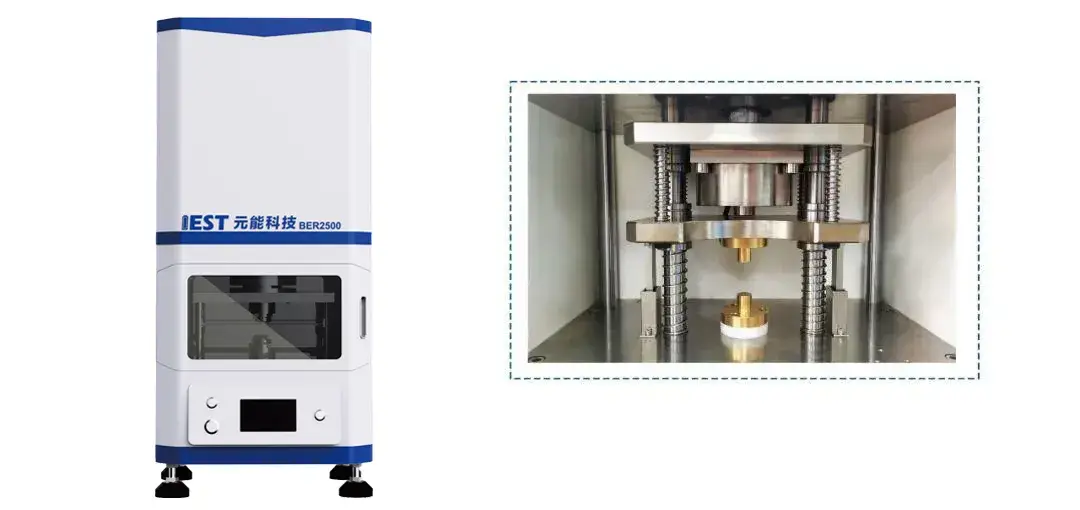
The BER Series Multi-function Battery Electrode Resistance Instrument (IEST) uses an advanced double-planar, controlled-voltage disc electrode method, offering:
-
Separate voltage and current sensing to eliminate inductive effects and improve accuracy.
-
A 14mm diameter disc electrode for increased contact area and reduced error.
-
Direct measurement of through-thickness resistance, including coating, interface, and current collector contributions.
-
Real-time monitoring of resistance, thickness, and density under variable pressure.
-
Precise pressure control ensuring data consistency.
The BER series instrument is ideal for evaluating conductive network performance and electrode microstructure uniformity. It supports optimization of electrode formulation, mixing, coating, and calendering processes.
Subscribe Us
Contact Us
If you are interested in our products and want to know more details, please leave a message here, we will reply you as soon as we can.


