

In lithium-ion battery manufacturing, the electrode sheet is the fundamental platform for electrochemical energy conversion. Its electronic conductivity is a primary determinant of critical cell characteristics, including internal resistance, rate capability, and overall performance uniformity. During large-scale production, ambient humidity emerges as a key, yet often variable, process parameter.
This challenge intensifies for companies with global production footprints across diverse climatic zones. Inconsistent humidity control can directly impact electrode quality, leading to undesirable batch-to-batch performance variations. Consequently, a systematic investigation into how environmental lithium battery humidity exposure influences electrode sheet resistance is not only a significant scientific inquiry but also a pressing industrial need for achieving high-standard, precise quality control.
To quantitatively assess the effect of storage humidity on electrode resistance, this study used an IEST Electrode Resistance Analyzer.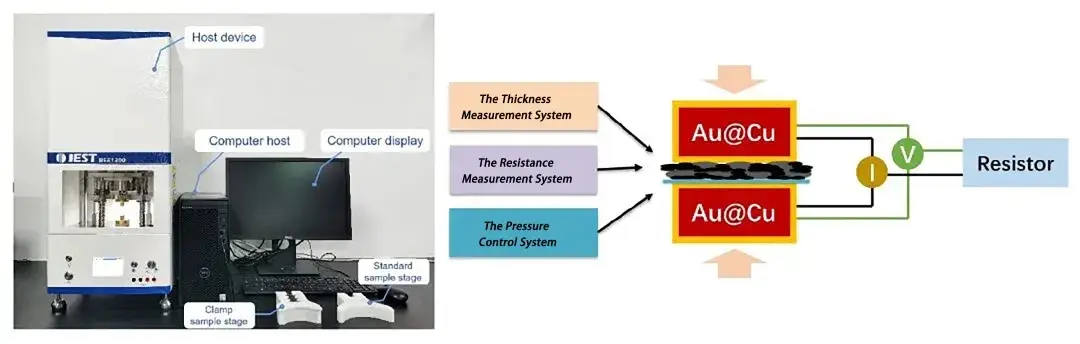
Figure 1. IEST Electrode Resistance Analyzer (BER Series) used for this humidity study.
Test Sample and Protocol:
Lithium iron phosphate (LFP) cathode sheets from the same production batch were used. After obtaining baseline resistance measurements on Day 1 (control group), electrode samples were stored for 24 hours in four distinct humidity environments:
Glovebox: ~0% RH
Dry Room: ~2% RH
Laboratory: ~50% RH
Air Vent Area: >70% RH
After 24 hours, electrode sheet resistance was measured using the IEST Electrode Resistance Tester under a compaction pressure of 25 MPa with a 15 s hold time. The protocol isolates the influence of ambient moisture on electrode electrical response by keeping all electrochemical and mechanical test parameters constant across samples.
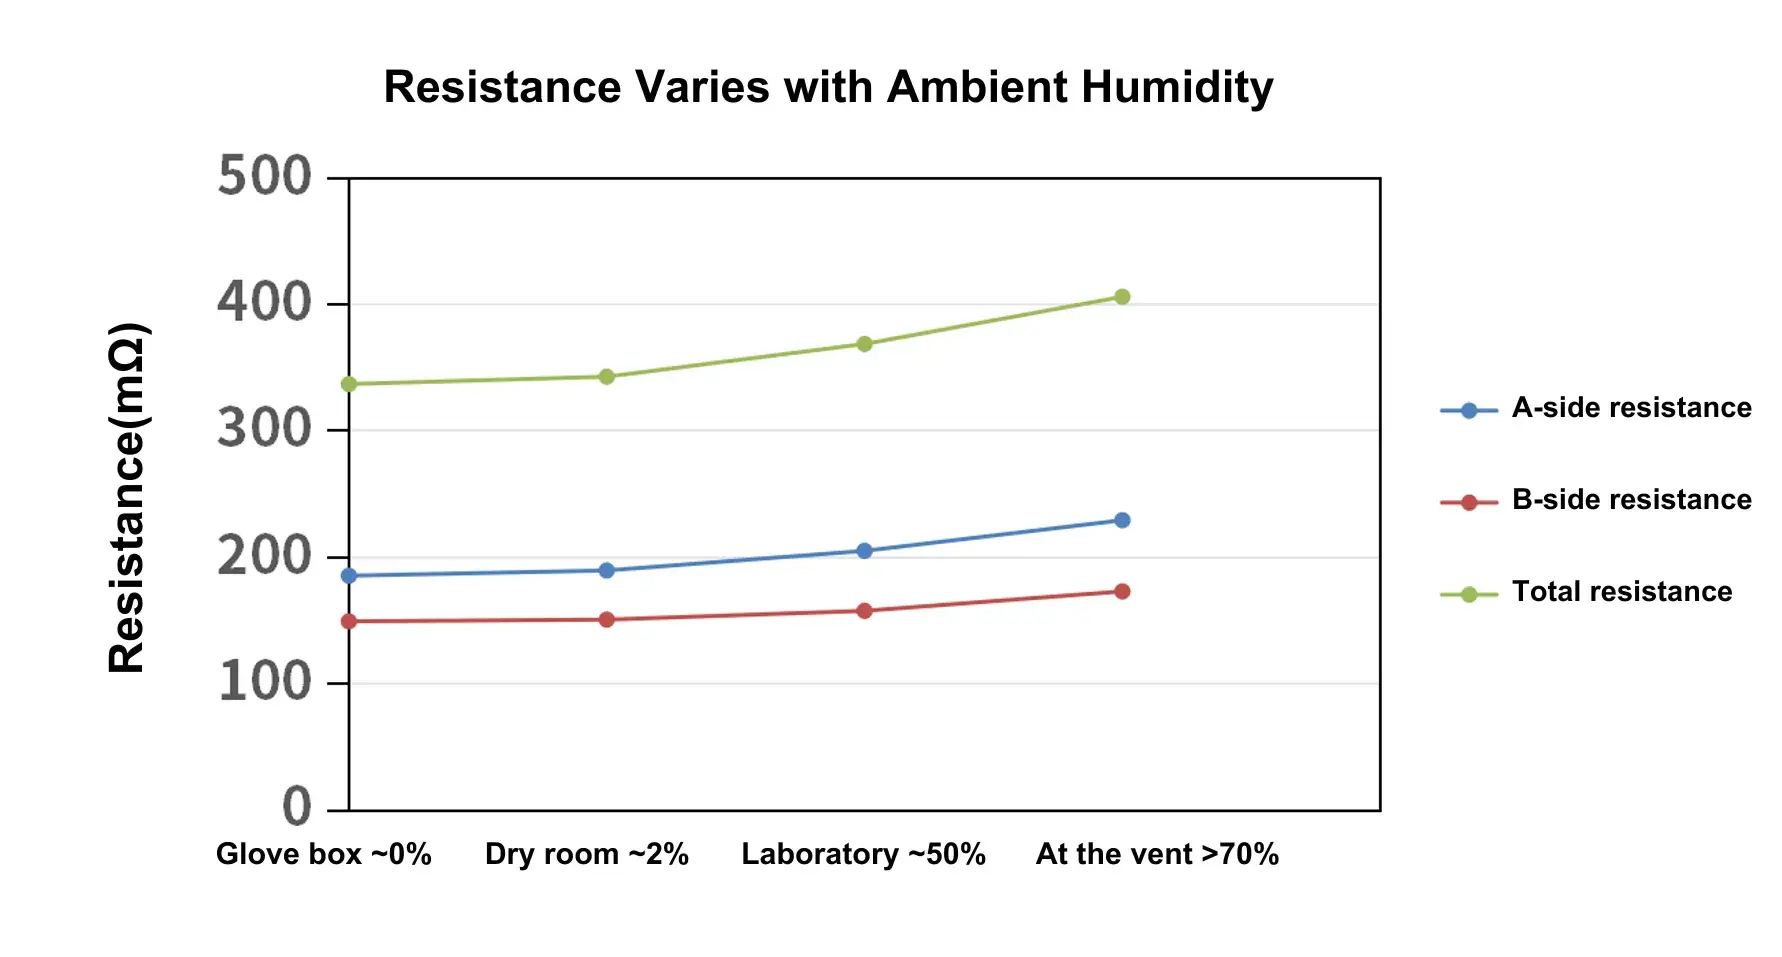
Figure 2. Electrode sheet resistance measurements after 24-hour storage at four different humidity levels.
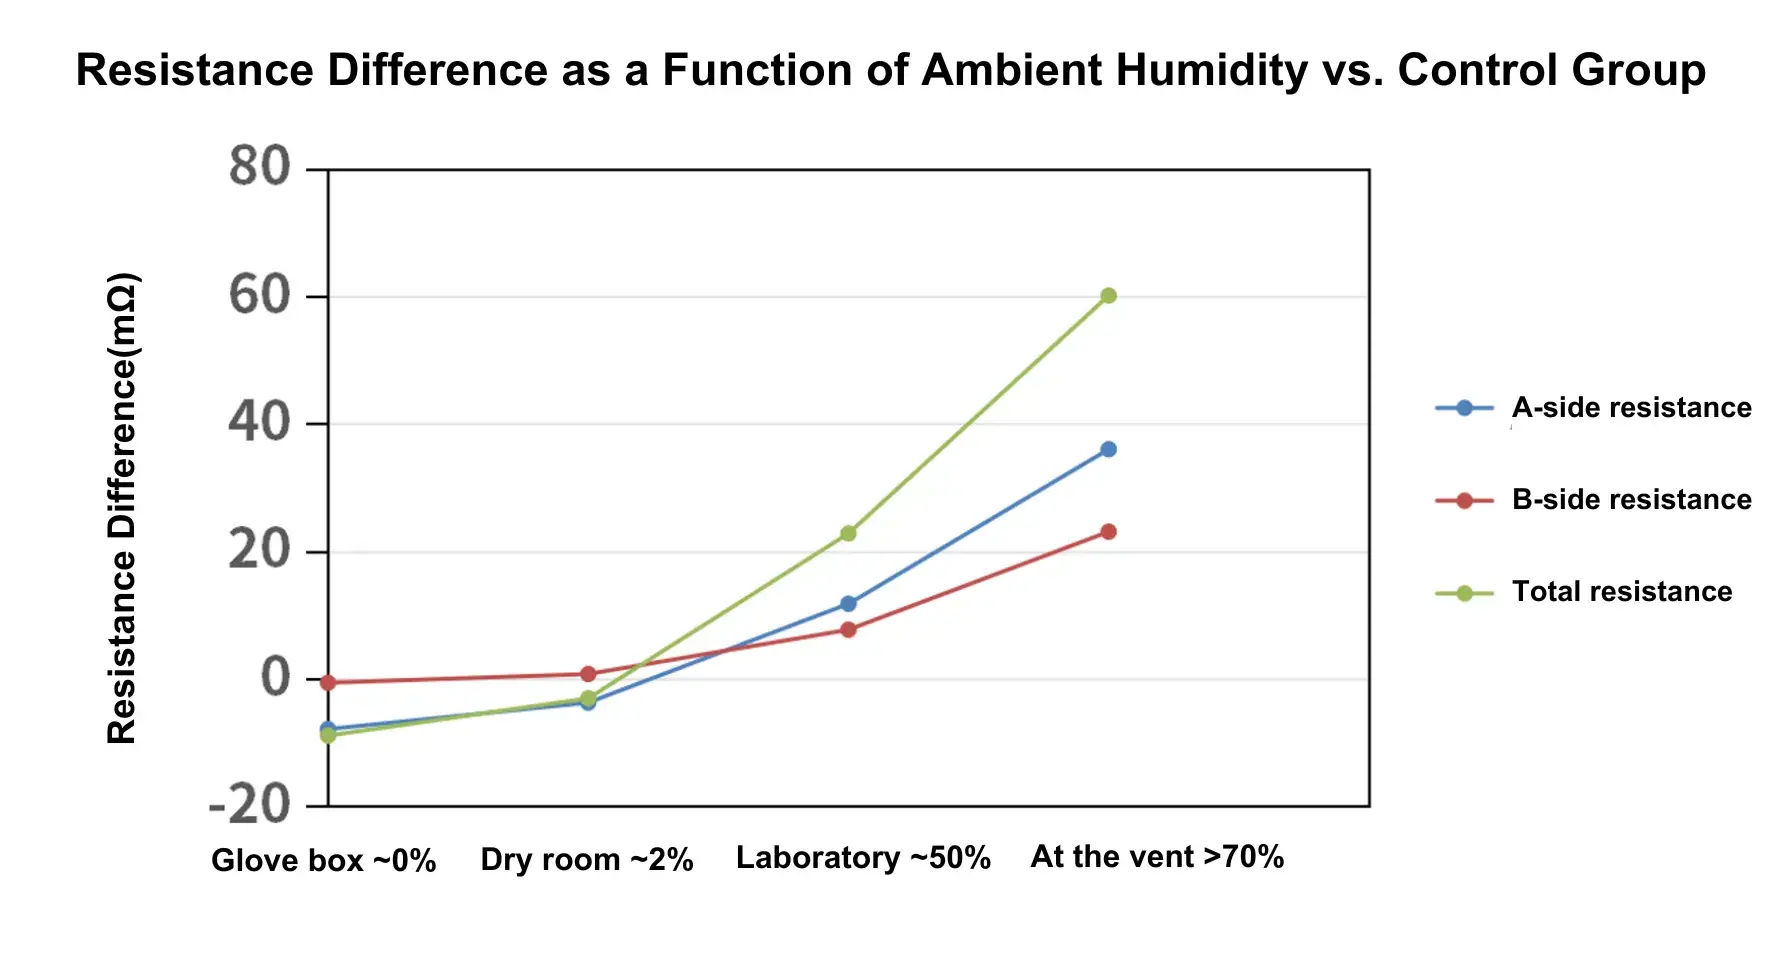
Figure 3. Change in electrode sheet resistance vs ambient humidity after 24 hours of storage, compared to the Day 1 control group.
Table 1. Summary of measured electrode sheet resistance after storage at various humidity levels.
| Resistance at 25 MPa, Side A (mΩ) | |||||
|---|---|---|---|---|---|
| Day 1 | Day 2 | ||||
| No. | Control Group (Lab) | Glove Box (0% RH) | Dry Room (2% RH) | Lab (50% RH) | Vent (>70% RH) |
| 1 | 192.8744 | 179.9017 | 182.8979 | 203.2323 | 223.9898 |
| 2 | 192.259 | 185.7867 | 188.1029 | 204.8011 | 228.2004 |
| 3 | 192.4656 | 186.3103 | 191.7003 | 203.9758 | 227.8305 |
| 4 | 193.7622 | 187.7809 | 193.7058 | 206.3837 | 235.3601 |
| mean | 192.8403 | 184.9449 | 189.101725 | 204.598225 | 228.8452 |
| COV | 0.35% | 1.87% | 2.51% | 0.66% | 2.07% |
| Resistance at 25 MPa, Side B (mΩ) | |||||
|---|---|---|---|---|---|
| Day 1 | Day 2 | ||||
| No. | Control Group (Lab) | Glove Box (0% RH) | Dry Room (2% RH) | Lab (50% RH) | Vent (>70% RH) |
| 1 | 146.6044 | 145.8883 | 146.047 | 156.9191 | 172.0851 |
| 2 | 149.4288 | 149.3366 | 150.3654 | 155.3823 | 172.5082 |
| 3 | 151.4978 | 149.6065 | 151.6959 | 157.8963 | 171.9818 |
| 4 | 150.3627 | 150.5589 | 152.7748 | 158.469 | 173.6018 |
| mean | 149.473425 | 148.847575 | 150.220775 | 157.166675 | 172.544225 |
| COV | 1.40% | 1.37% | 1.97% | 0.86% | 0.43% |
| Total Resistance at 25 MPa(mΩ) | |||||
|---|---|---|---|---|---|
| Day 1 | Day 2 | ||||
| No. | Control Group (Lab) | Glove Box (0% RH) | Dry Room (2% RH) | Lab (50% RH) | Vent (>70% RH) |
| 1 | 342.5056 | 328.2692 | 331.6606 | 370.8212 | 400.1304 |
| 2 | 344.8877 | 337.8352 | 341.5911 | 366.9732 | 405.0371 |
| 3 | 347.3556 | 338.7414 | 346.4416 | 366.4772 | 403.9905 |
| 4 | 347.0348 | 341.2632 | 349.8341 | 368.702 | 413.0797 |
| mean | 345.445925 | 336.52725 | 342.38185 | 368.2434 | 405.559425 |
| COV | 0.65% | 1.69% | 2.31% | 0.53% | 1.34% |
The experimental data reveals a direct and significant correlation between storage humidity and measured resistance:
Low-Humidity Benefit: Storage in extremely dry environments (0-2% RH) resulted in a decrease in electrode sheet resistance compared to the Day 1 baseline. The lower the humidity, the lower the resistance.
High-Humidity Detriment: As storage humidity increased, electrode sheet resistance exhibited a clear upward trend. Notably, exposure to high-humidity conditions (>70% RH) caused a substantial increase in resistance.
| Storage Condition | Relative Humidity | Resistance Trend vs Day 1 Baseline |
|---|---|---|
| Glovebox | ~0% RH | Decreased — lowest resistance |
| Dry Room | ~2% RH | Decreased |
| Laboratory | ~50% RH | Moderate increase |
| Air Vent Area | >70% RH | Substantial increase — highest resistance |
The electronic conductivity of an electrode relies on a stable, three-dimensional network formed by active material particles, conductive additives (e.g., carbon black, CNTs), and binder. This network is highly sensitive to moisture ingress. Humidity impacts performance through several interconnected microscopic mechanisms:
Degradation of the Conductive Network: Nano-scale conductive agents possess high surface areas, making them prone to water adsorption. The presence of water molecules can alter inter-particle interfacial energy, disrupting the uniform and efficient pathways for electron transport, thereby increasing bulk resistance.
Alteration of Active Material Interfaces: The surfaces of cathode and anode active materials (e.g., NCM, LFP, LCO) can interact with moisture physically and chemically. This may lead to slight surface hydrolysis or the formation of insulating/semi-conducting by-product layers (e.g., lithium carbonate), increasing the interfacial resistance for electron transfer from the active material to the conductive network.
Changes in Micro-Mechanics and Porosity: Binders (e.g., PVDF, SBR/CMC) can swell upon water absorption. This swelling can physically compress the conductive network, increasing electron tunneling distances. It can also alter the electrode’s porosity and mechanical integrity, compromising intimate contact with the current collector and raising interfacial contact resistance.
To mitigate humidity effects on electrode sheet resistance and electronic conductivity, implement the following:
Control and standardize ambient RH across critical process steps (coating, drying, calendaring, slitting, and stacking). Maintain documented target ranges and alarm thresholds.
Integrate rapid resistance checks (online or offline) as a production QA metric. Use the same compaction pressure and dwell time for all checks (e.g., 25 MPa, 15 s) to ensure comparability.
Build a reference database correlating storage RH, time, and measured sheet resistance for each electrode formulation. This database enables trend detection and permits quantitative alarm limits.
Run targeted root-cause assays when resistance excursions occur: measure binder uptake (water uptake tests), perform surface analyses (XPS or FTIR) for carbonate or hydrolysis products, and image microstructure (SEM) to detect network disruption.
Design formulations and processing to reduce moisture sensitivity where possible — e.g., selection of less hydrophilic conductive additives, optimized binder chemistry, improved drying procedures.
Exposure to battery manufacturing humidity does more than immediately increase electrode sheet resistance — it can induce potentially irreversible microstructural changes, inflicting lasting “hidden” damage to the battery’s electrochemical performance. Therefore, stringent humidity control throughout the manufacturing process is a non-negotiable requirement for ensuring electrode quality and final cell consistency.
Implementing electrode sheet resistance as a key parameter for inline or offline rapid quality control provides a powerful tool. Establishing a quantified database of this metric enables manufacturers to promptly detect process deviations and material anomalies, ensuring robust batch-to-batch consistency and supporting the production of high-performance, reliable lithium-ion batteries.
[1] Zhen Tong, Chao Lv, Guo-Dong Bai, Zu-Wei Yin, Yao Zhou, Jun-Tao Li. A review on applications and challenges of carbon nanotubes in lithium‐ion battery. 2025, 7, 2
[2] Gongrui Wang, Zhihong Bi, Anping Zhang, Pratteek Das, Hu Lin, Zhong-Shuai Wu. High-Voltage and Fast-Charging Lithium Cobalt Oxide Cathodes: From Key Challenges and Strategies to Future Perspectives. Engineering, 2024, 37(6): 115–139.
[3] Malte Kosfeld, Bastian Westphal, Arno Kwade, Moisture behavior of lithium-ion battery components along the production process, Journal of Energy Storage, Volume 57, 2023, 106174.
[4] Niu Aimin, Li Xianhong, Lü Haoran, Zang Haoting, Song Ran, Gao Mingjuan, Ma Wenqing. Research Progress of Anode Binder for Lithium Ion Battery [J]. Journal of Liaocheng University (Natural Science Edition), 2025, 38(1):51-586
Battery manufacturing humidity has a direct, measurable effect on electrode sheet resistance. Testing LFP cathode sheets stored for 24 hours across four humidity levels — 0% RH glovebox, 2% RH dry room, 50% RH laboratory, and greater-than-70% RH vent area — showed that lower humidity storage decreased resistance relative to the Day 1 baseline, while higher humidity storage increased it, with a substantial resistance increase at greater than 70% RH. This confirms ambient humidity as a controllable but critical process variable that directly influences electrode electronic conductivity in production environments.
Three interconnected mechanisms explain how humidity increases electrode resistance. First, degradation of the conductive network: nano-scale conductive additives (carbon black, CNTs) have high surface areas prone to water adsorption, and adsorbed water alters inter-particle interfacial energy, disrupting electron transport pathways. Second, alteration of active material interfaces: moisture can cause surface hydrolysis or form insulating by-product layers such as lithium carbonate on cathode or anode active material surfaces, increasing interfacial resistance. Third, changes in micro-mechanics and porosity: binders such as PVDF or SBR/CMC swell upon water absorption, physically compressing the conductive network, increasing electron tunneling distances, and compromising contact with the current collector.
Testing showed that extremely dry storage conditions — 0% RH (glovebox) and 2% RH (dry room) — both resulted in decreased electrode sheet resistance relative to the Day 1 baseline, with the lowest humidity producing the lowest resistance. In contrast, 50% RH (typical laboratory conditions) produced a moderate resistance increase, and greater than 70% RH (an air vent area) caused a substantial resistance increase. For production environments handling moisture-sensitive electrode formulations, maintaining storage and processing humidity as close to dry-room conditions (under 2–3% RH) as practical minimizes resistance-related quality risk.
Electrode sheet resistance for moisture analysis is measured using an electrode resistance tester such as the IEST BER series, applying a controlled compaction pressure and hold time to ensure comparable results across samples. In this study, LFP cathode sheets were tested under 25 MPa compaction pressure with a 15-second hold time, both as a Day 1 baseline and after 24-hour storage at each humidity condition. Keeping compaction pressure and dwell time constant across all measurements isolates the effect of ambient moisture exposure on electrode electrical response, separating it from mechanical test variability.
Humidity exposure during lithium battery manufacturing can cause potentially irreversible microstructural changes to the electrode’s conductive network — including binder swelling, active material surface hydrolysis, and disruption of conductive additive contact pathways — that inflict lasting damage to electrochemical performance beyond the immediately measurable resistance increase. This makes stringent humidity control across coating, drying, calendaring, slitting, and stacking process steps a non-negotiable requirement for consistent electrode quality, rather than a concern limited to the moment of measurement. Establishing a quantified humidity-vs-resistance reference database for each electrode formulation enables manufacturers to detect process deviations early and maintain batch-to-batch consistency.
